Donate Now

Executive summary
The rising trend of government expenditure in Australia has long been present but has received new impetus from government policy in recent years.
Economists have paid it more attention because of inflation, but even as inflation recedes the growth of government spending remains a serious economic concern because of what it means for persistent budget deficits, rising public debt and taxation, weak productivity growth and the societal consequences of a deepening dependency on government.
A culture of dependency and entitlement has taken root in the population and political behaviour has become only too willing to accommodate and encourage it in a feedback loop. This has been on display in recent policy announcements and in the federal election campaign. The community’s expectations of government have outgrown its economic capacity to respond responsibly, and only government itself can reset those expectations.
Total government expenditure now stands near 39 per cent of GDP, up from 34 to 35% before the global financial crisis of 2008. At the Commonwealth government level – which is the focus of this report – the increase over that period has been from 24 to 25% to above 27% currently.
Narrowing the focus to the period since 2012-13, we find that Commonwealth real per-capita expenditure has registered an average annual increase of 1.8%, compared with productivity growth of 0.5% and real GDP growth of 0.8%. This gap cannot be allowed to persist, and its closure is most unlikely to be achieved by resurgent productivity – it will require action by government to moderate spending growth.
Delving into expenditure program details, we find that a list of a dozen social spending, ‘care’ economy and defence programs, along with public debt interest, has averaged growth of almost 10% a year since 2012-13 and lifted its share of the budget from around 35% to almost 50% in just 12 years. The NDIS, of course, dominates this growth story.
Covid-19 pandemic era spending was also a factor, but its main legacy has been the debt service bill from the massive deficits of that period.
Administrative expenses such as the public service payroll were restrained before the pandemic but have risen sharply since. Controlling these expenses is essential, but will not be enough on its own to make room for program expenses to continue their rapid ascent. Cutting the running costs of government is a worthy goal, but government also needs to do much less and to do those things much more effectively.
Looking ahead, the forward estimates point to easing growth in most of the fast-growing program expenses except debt interest, while other expenses are said to be slowing to a crawl. However, this outlook strains credulity in view of the long list of known pressure points in the budget.
Policy action to bring down the growth of government spending is critical to the country’s economic future — but it is far from clear that such action will be forthcoming. There is much talk of the need for tax reform, but the need for expenditure reform is just as pressing.
To listen to this research on the go, subscribe on your favourite platform: Apple, Spotify, Amazon, iHeartRadio or PlayerFM.
Introduction
The growth of government expenditure in Australia has become a more compelling feature of the economic landscape thanks to events of the last five years, but it is not a new phenomenon. It should be a priority issue for correction by policymakers – but there is little sign that it is.
Looking back to 2020, we have had the COVID-19 pandemic and the massive increase in government spending as part of the health and economic policy response. Then there was an upsurge in inflation, in part attributable to the contribution of public sector demand growth to aggregate demand. This year has seen the federal election in May and the promises made by both major parties involving additional spending. At the global level geopolitical developments have intensified pressure for more defence expenditure in Australia. At the same time, the new Trump administration’s government efficiency project (DOGE) has captured world-wide attention. Throughout all of the above, the National Disability Insurance Scheme (NDIS) has repeatedly exceeded cost estimates by a wide margin and has done more than any other program to drive government spending growth.
This is not to say that the rising trend of government expenditure in Australia is new – it is just receiving more attention. The seeds of this trend were sown long ago. The upsurge in inflation of recent years has probably done more than anything else to draw attention to the economic disruption excessive government spending can create, but even if and when inflation subsides bloated government budgets will remain as a serious economic issue. It will do so because of what it means for budget deficits, debt, taxation, productivity and the societal consequences of a widening and deepening dependency on government.
That is the background to this report, the aim of which is to document the growth of government spending in Australia over a particular period – since 2012-13 – and to highlight the main reasons for it. The focus is on the Commonwealth government rather than the broader public sector including states, territories and local government, although they also raise some of the same issues.
There is also some discussion of the underlying causes and consequences of government spending growth and of how it might be curbed if the government were to turn its attention to the problem. If current trends continue, Australia will continue on the path towards a European size welfare state. There are always calls for tax reform, but expenditure reform is at least as important.
A culture of dependency
Key point: “The state is that great fiction by which everyone tries to live at the expense of everyone else.” Frederic Bastiat, “The State”, Journal des debats, September 1848.
There is a school of thought that the growth of government – at least in developed democratic countries — has at its core an entrenched culture of dependency and entitlement. People have come to expect more support from government and once they are in receipt of a benefit will resist any attempt to take it away from them. At the same time they expect the largesse to be financed by someone other than themselves.
A vast network of lobby groups and organisations has evolved to safeguard and increase social spending. A large proportion of the population has become dependent on government for a living either through public sector employment or the spread of social benefits. The growth of government becomes self-sustaining as it nourishes the powers that demand it continue. Occasionally in history, a government with the will to overturn the culture of dependency has come to power, but none has ever made a long-lasting impact. Indeed, most politicians are complicit in the growth of government – they encourage the culture of dependency as much as the voters demand more.
Does this explain the growth of government in Australia? Historians have often argued that Australia has developed under a culture of dependency on government ever since its European origins as a penal colony. Whether or not that characterisation is accurate, government in Australia has become more intrusive through both regulation and expenditure over the long run, with few set-backs along the way. There are clear signs of a culture of dependency and entitlement – and whenever or however it started, it is currently flourishing. We are very much part of the developed democracy club of big government countries described above, even if in some respects we are not (yet) as big as some in that club.
Australia has managed to stay out of the ranks of the biggest government countries not because we do not have the full panoply of social benefits but because they have traditionally been more narrowly targeted through means testing and because compulsory — but private — superannuation has eased the pressure on the public pension system. However, this is changing as the emphasis has shifted from social benefits in cash to universal in-kind benefits such as Medicare, the NDIS and child care.
The entitlement mentality is apparent in the parties’ platforms in the recent election campaign, in the narrow focus of the public’s assessment of budgets on ‘what’s in it for me’, in the demands for relief from cost of living pressures from budget measures, and in the expectation of ‘free’ goods and services via public subsidies. It is also apparent in the diminished profile of fiscal discipline – balanced budgets and low debt – in public debate; the willingness of parties to promise new spending to be financed by increased debt; and the paucity of offsetting expenditure savings.
As one commentator recently put it, “All the evidence is that Australians like big government, debt-funded government spending, and the government telling them what to do.”[1]
Terrence O’Brien and I in 2018 described the pattern of self-sustaining growth of government as “voting for a living: a shift in Australian politics from selling policies to voting for a living”. As we said then:
“We may have reached the point that such a large segment of society – whether measured by people, households or voters – are beneficiaries of government that big government and its further growth feeds on itself because of the strong resistance to any withdrawal of existing benefits, the lure of more benefits and reinforcement by the advocacy industry that has grown up around the welfare state. To put this another way, government may have grown to the point that there is a large segment of the population – perhaps even a majority – facing incentives to ‘vote for a living’ rather than to ‘work for a living’ by adding value to resources through market-tested employment in the private sector.”[2]
Whose fault is this? It is true that the community has come to expect a lot from government, but those expectations have not developed spontaneously. Government actions have encouraged them and only changes in government policy can reshape expectations.
The economic and social harm from government spending growth
Key point: As government spending grows, the marginal benefits become smaller while the marginal costs of financing the higher spending through taxation or borrowing increase.
Why should we be concerned about the size of government as measured by the amount of government expenditure?[3]
Australia’s burst of high inflation since 2021 has drawn attention to the connection between government expenditure and inflation. There is no doubt that while other factors were also at work, the rapid growth of public sector demand has contributed to elevated inflation.[4] In general, however, whether any particular episode of government spending growth causes inflation depends on overall macroeconomic conditions.
To the extent that fiscal policy is used as a short-term economic management tool to smooth out fluctuations in economic activity, it should work in harmony with monetary policy. If it fails to do so, an independent central bank can still crush an inflation outbreak, but with greater friction than if fiscal policy were applied to the same objective. This is what has happened in recent years – monetary policy has worked to bring inflation back down while fiscal policy has been adding to inflationary pressures.
There have been episodes of accelerated growth in government spending in the past with and without an increase in inflation. If inflation accelerates it is one reason to curb public sector demand, but even if it doesn’t then there are still other reasons to be concerned about excesses of government spending – and arguably more important ones related to the structure of the economy. These include the upwards pressure on taxation and the growth of public debt. This point has played second fiddle to inflation in the recent Australian debate.
The effects of any given level of government expenditure depend on what the money is spent on and how effectively it is spent. Expenditure at 35% of GDP may do more for economic welfare than expenditure at 30%, but it may also do less once the negative effects of higher taxation are considered. When government had a minor presence in economic and community life it was easy to find beneficial ways to expand its presence. But as government has become larger any benefits of its further expansion – the marginal benefits — are likely to have shrunk.
Spending more money has become a political device for politicians to signal their concern about a problem or issue that voters expect to be addressed. In this political response, whether the additional spending actually fixes or diminishes the problem has become secondary. It is much easier to turn on the money tap than it is to do the hard and perhaps politically unpopular work of redesigning a program to reach its objectives more efficiently, or just abandoning the program.
In the meantime, on the other side of the accounts government has to raise money through taxation or borrowing to finance the higher spending. The reality is that the bigger government becomes, just as the marginal benefits of more spending are likely to shrink, the marginal cost of taxation or borrowing is likely to expand, and the more likely it is that the last dollar spent was wasted or did not generate sufficient benefit to justify the extra dollar of taxation or borrowing needed to finance it.
The costs of ever increasing government expenditure can be considered as both economic and societal. The economic costs may come from a rising debt burden if spending is financed by deficits and borrowing. But even if this is avoided through increasing taxation, the rising tax burden also does economic harm by eroding incentives for productive work, saving and investment. The higher the levels of borrowing and taxation to start with, the higher the marginal costs of further borrowing and taxation.
Expanding government also directs resources away from more productive economic activity in the private sector. That is, it can be a drag on productivity through inefficient resource allocation.
Finally, as government grows more resources are devoted to lobbying and attracting greater benefits and more rents, which further reduces efficiency.
It is for all these reasons that above a certain level bigger government tends to be associated with slower productivity growth, slower economic growth, and slower advances in living standards. Conversely, a stabilisation or reversal of the trend to bigger government can improve these variables.
The societal implications of bigger government include the encouragement of an entitlement mentality that corrodes the work ethic and entrepreneurship and channels effort from productive, market-based activity to politically-based jockeying for benefits at the expense of others.
Bigger government also corrodes ‘social capital’, which is a way of describing the ties that keep society functioning effectively – such as extended family supports, philanthropy, charities, volunteering and the spirit of self-reliance in place of state dependency.
Finally, society’s attitudes have shifted in favour of more government spending and taxation as an increasing proportion of the population becomes directly dependent on government either for employment or cash and in-kind benefits.
As we shall see later in this report, more than 30% of the work force is now employed either in the public sector or in activities heavily dependent on government payments. This dependency has taken a new turn in recent years with the federal government advocating and directly funding wage increases for some non-government service providers. This is not to deny that many of these workers perform useful and sometimes vital services for the rest of the population and are motivated by high ideals of service. But they also share a vested interest in defending big government and high taxation through the political system, trade unions and other organized activity.
When we add public and quasi-public employment to the substantial part of the population that relies heavily on government welfare payments for their income, it is likely that more than half of voters rely on government for most of their income. This dependence poses a formidable opposition for any politician trying to curb the growth in public expenditure. Although the proportion of voters without the same dependence on government is also substantial, they are a much more disparate force. The winners from big government are concentrated and vocal; the losers diffuse and docile.
Putting the Trump administration’s government efficiency drive into perspective
Key point: Restraints on government administrative expenses must be part of any effort to curb overall expenses, but they are not the whole solution as other categories of spending are much larger.
The US federal government’s finances are in a parlous state and spending cuts need to be at least part of the solution. This is the context of the new Trump administration’s government efficiency project led by Elon Musk. The project has been implemented in such a way that it has captured much critical attention even outside the US, including in Australia. And the results have fallen far short of what was promised.
However, while the implementation is open to criticism for its clumsiness, this aspect does not discredit its underlying objective and does not mean that spending restraint should not be pursued in the US or, by extension, Australia.
Rather, the main lesson is that federal government spending and deficit excesses in the US will never be solved by targeting the cost of government administration alone. It is not feasible to extract sufficient administrative cost savings to make a major dent in the fiscal deficit problem.[5]
The US federal budget is dominated by defence and social spending programs such as social security (the age pension) and Medicare (medical care for over-65s), which have grown at faster rates than administrative expenses and will continue to do so. However, these benefits are excluded from the scope of the government efficiency project. Interest on the public debt has also grown rapidly and is a major expense, but cannot to be reduced without reducing the primary budget deficit.
Although the proportions are different in Australia, there is also a fiscal deficit and spending growth problem. The cost of social transfers and subsidies far exceeds the cost of government administration and has been growing more rapidly. While inefficiencies and excessive costs in government administration need to be tackled, that alone will be insufficient to substantially shift the growth path of government spending. Social spending also needs to be in the frame.
National government expenditure
Key point: Total expenditure at all levels of government in Australia was typically 34 – 35% of GDP from the late 1990s until the global financial crisis of 2008 but is now 38 – 39% and may be headed higher. Commonwealth government expenditure was 24-25% of GDP before the GFC and is now 27 – 28% and accounts for most of the increase in the total, although this is partly due to its funding of services delivered by the states.
There are various measures of total government spending in Australia. The one we start with covers general government expenditure by all levels of government, including recurrent and capital expenditure (Appendix A discusses data issues.)
Looking back to 1999-2000, Figure 1 shows this aggregate expressed as a percentage of GDP up to 2024-25, for which we use an estimate based on actual data for the first three quarters. Total national expenditure on this measure has increased from 34.5% at the beginning to 38 – 39% at the end with some fluctuation along the way and a pronounced upsurge in 2019-20 and 2020-21 as governments spent heavily in response to the Covid-19 pandemic. The pandemic-related spending has now largely washed out of the system, but expenditure remains higher than at the turn of the century.
Figure 1: Government Expenditure as % of GDP 1999-2000 to 2024-25 (est)
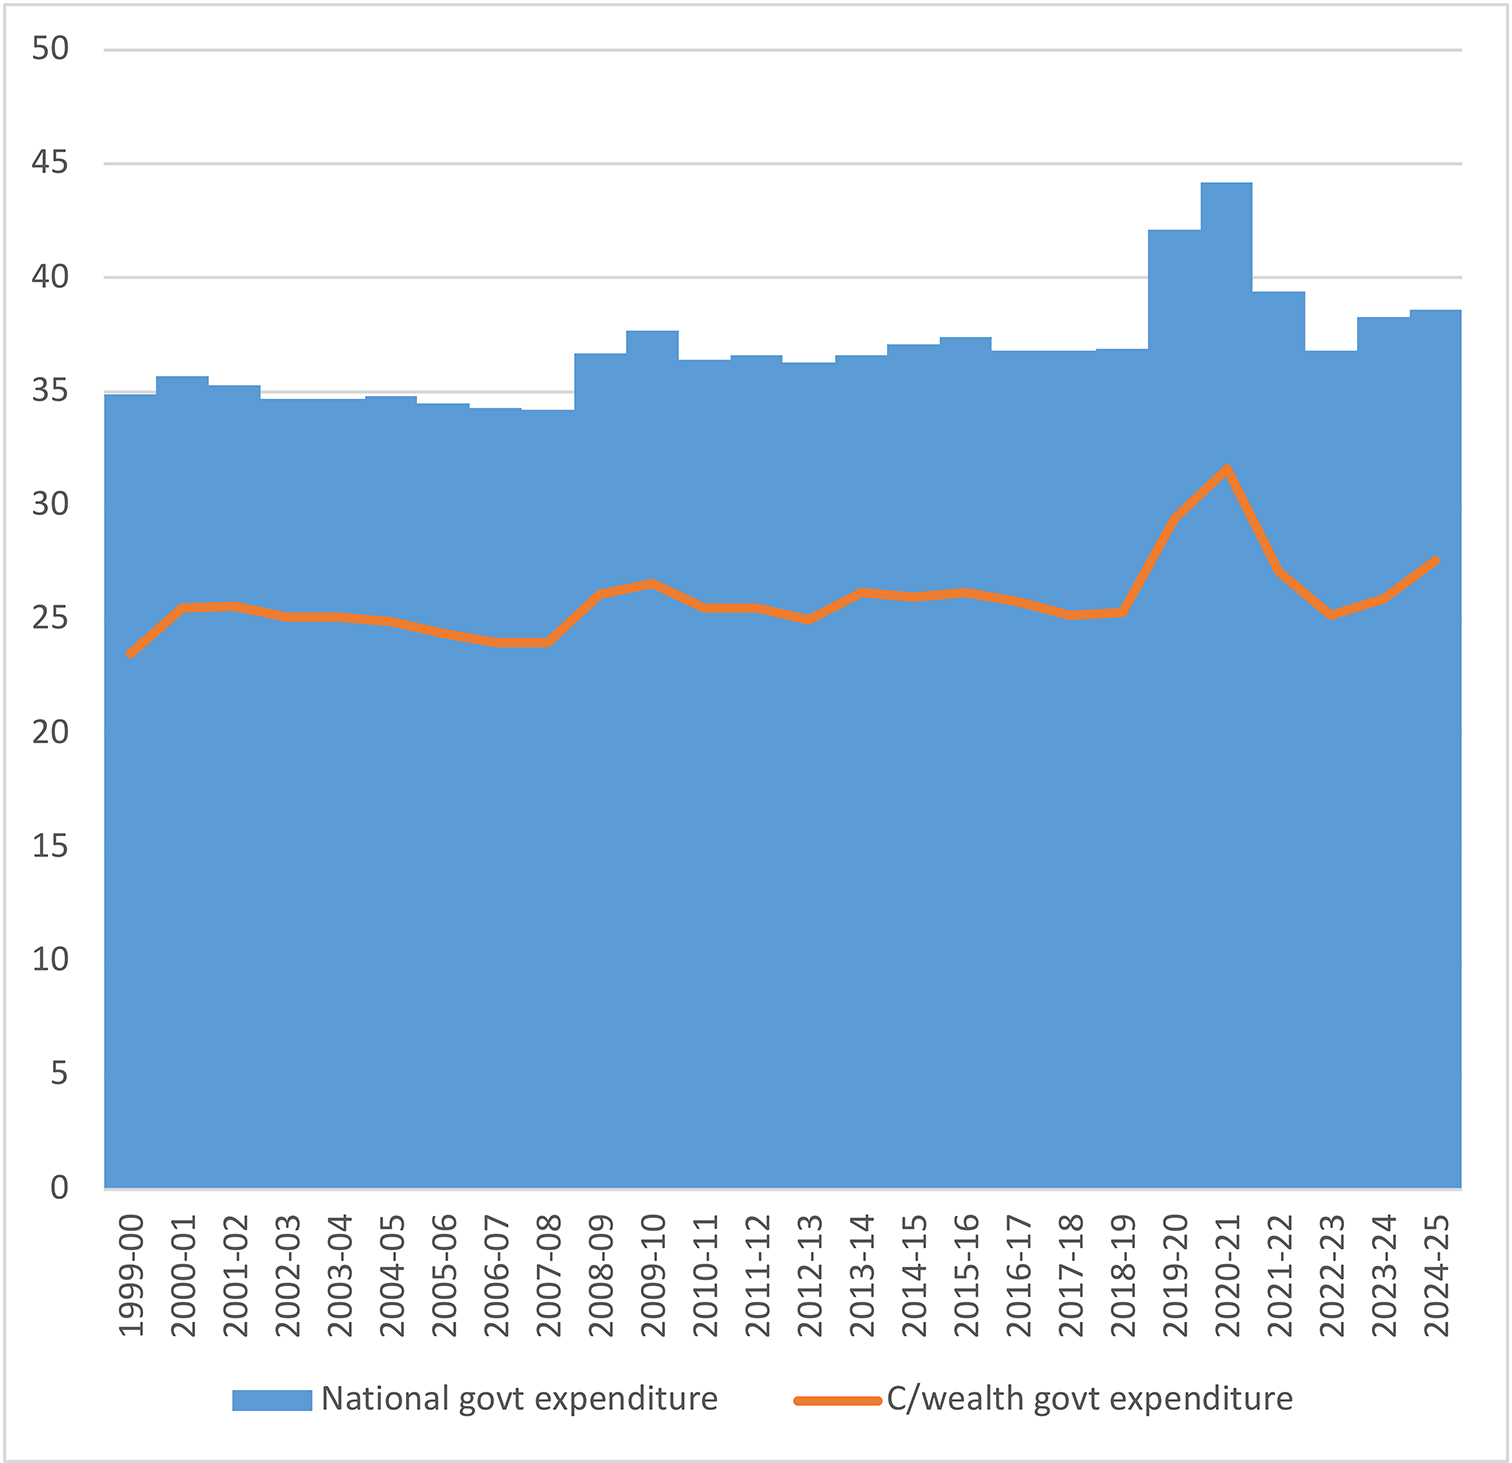
There are several important points to make about these historical comparisons. The first is that 1999-2000 is a neat but essentially data-driven starting point. The reality is that we could look back to any point in history and find an upward trend in this ratio, even though the trend has been obscured by wars, recessions and depressions, pandemics, and even occasionally the actions of governments attempting to halt or reverse the upward trend. The view back to 1999 is one snapshot from a longer history.
That longer history shows that until the early 1970s public expenditure was below 25% of GDP before it jumped suddenly above 30% under the expansionist Whitlam government. It has since crept up to its current level approaching 40% with considerable fluctuation along the way. Although the Whitlam era expansion has earned a place in the fiscal record books, the further expansion since then has been at least as large – just over a longer period and thus less startling.
The second point is about international comparisons, according to which Australia is often described as a ‘low tax’ or ‘small government’ country. The story is in fact much more nuanced. Although Australia has long been below tax and expenditure averages for advanced countries and sub-groups such as the G7 and euro-area countries, such averages are inflated by fiscal basket cases such as France and others particularly in Europe. If such cases are excluded, Australia is in the middle of the pack. Moreover, the gap has narrowed over the long term. Any remaining appearance of smaller government is due to our private superannuation system which takes the place of more generous public pensions funded from earmarked specific taxes in many other advanced countries.
The third point is that the measure of expenditure as a percentage of GDP is subject to what has happened to GDP itself. If GDP is growing rapidly then government spending can also grow rapidly without increasing as a proportion. This has happened at times, such as the boom years from the late 1990s until the global financial crisis – and in that period GDP was further boosted by a leap in Australia’s terms of trade.
If we take the whole 25 year period since 1999-2000, in nominal dollar terms GDP has approximately quadrupled and in real terms it has approximately doubled. These cumulative total increases translate to average annual increases of 5.9% in nominal terms and 2.7% in real terms.
Over the same period general government expenditure has more than quadrupled in nominal terms, for an average annual increase of 6.4%. When adjusted for the increase in the CPI, this translates to an average increase in real terms of 3.4% per year, which is well ahead of population growth of 1.5%.
In some respects it is more meaningful to say that real per capita government expenditure has increased by 1.9% a year than to recite percentages of GDP. The real per capita growth figure can be related to productivity growth – which has been lower – to show that government spending has outstripped the economy’s capacity to pay for it.
The Commonwealth-only component has risen from 23.1% of GDP at the beginning to 27.6% at the end. However this included a particularly sharp increase in 2000-01 resulting from a major restructuring in Commonwealth-state finances with the introduction of the GST. The subsequent years up to the GFC are a better point of comparison, during which Commonwealth expenditure was 24 – 25% of GDP. Thus, there has been an increase of about 3 percentage points of GDP.
Since 2000-01 Commonwealth expenditure has increased at 6.2% a year in nominal terms and 3.4% a year in real terms compared with nominal GDP at 5.8% and real GDP at 2.7%. In real per capita terms Commonwealth expenditure has increased by 1.9% a year over this period, the same as for aggregate government expenditure.
Focus on the Commonwealth government
Key point: Commonwealth government expenditure has increased from 25% of GDP in 2012-13 to an estimated 27.6% in 2024-25. In nominal terms expenditure has increased by 6% a year over those 12 years and in real terms by 3.3%, compared with 5% and 2.2% for nominal and real GDP respectively. Expenditure growth was moderate until 2018-19, then exploded during the pandemic, declined after the pandemic, and has again grown rapidly in recent years.
The preceding section sets the national scene including state, territory and local governments. The remainder of this report narrows the focus to the Commonwealth government, which dominates the general government figures and is primarily responsible for the national trends discussed above. This is not to understate the importance of sound fiscal management by states and territories, or the well-known serious fiscal problems in a number of them such as Victoria.
State expenditure has in fact grown slightly faster than Commonwealth expenditure, owing particularly to infrastructure spending. However, the financial burden of this has been shared with the Commonwealth through its specific purpose grants to the states such as for public hospitals, schools and infrastructure.
In order to analyse the causes of growth in Commonwealth expenditure, we take 2012-13 as the base year. This is not because it is an historical starting point for expenditure growth, but the level of expenditure then, at 25% of GDP, was representative of the period since 2000 excluding the years of GFC stimulus spending.
The other reason to start from 2012-13 as the base year is that it enables us to quantify the contribution of new spending initiatives such as the NDIS, ‘Gonski’ funding of schools and enhancements of aged care and child care funding that started around that time. Thus, while government spending had grown over the long-term before 2013, our focus on the period since 2013 provides a case study of one important episode in which the growth of government has accelerated.
In this episode we are looking at an increase from around 25% of GDP to 27.6% in 2024-25 – which translates to ‘excess’ expenditure of around $70 billion in 2024-25. This represents an average annual increase of 6%, compared with 5% for nominal GDP. According to the 2025-26 budget the 2024-25 figure will be a peak after which expenditure will drift lower to 27.1% by 2028-29. The credibility of that claim is questionable, but even if it stands up the fact remains that Commonwealth expenditure has risen to a new plateau at least 2 percentage points of GDP higher than before, which is around $55 billion of current annual GDP.
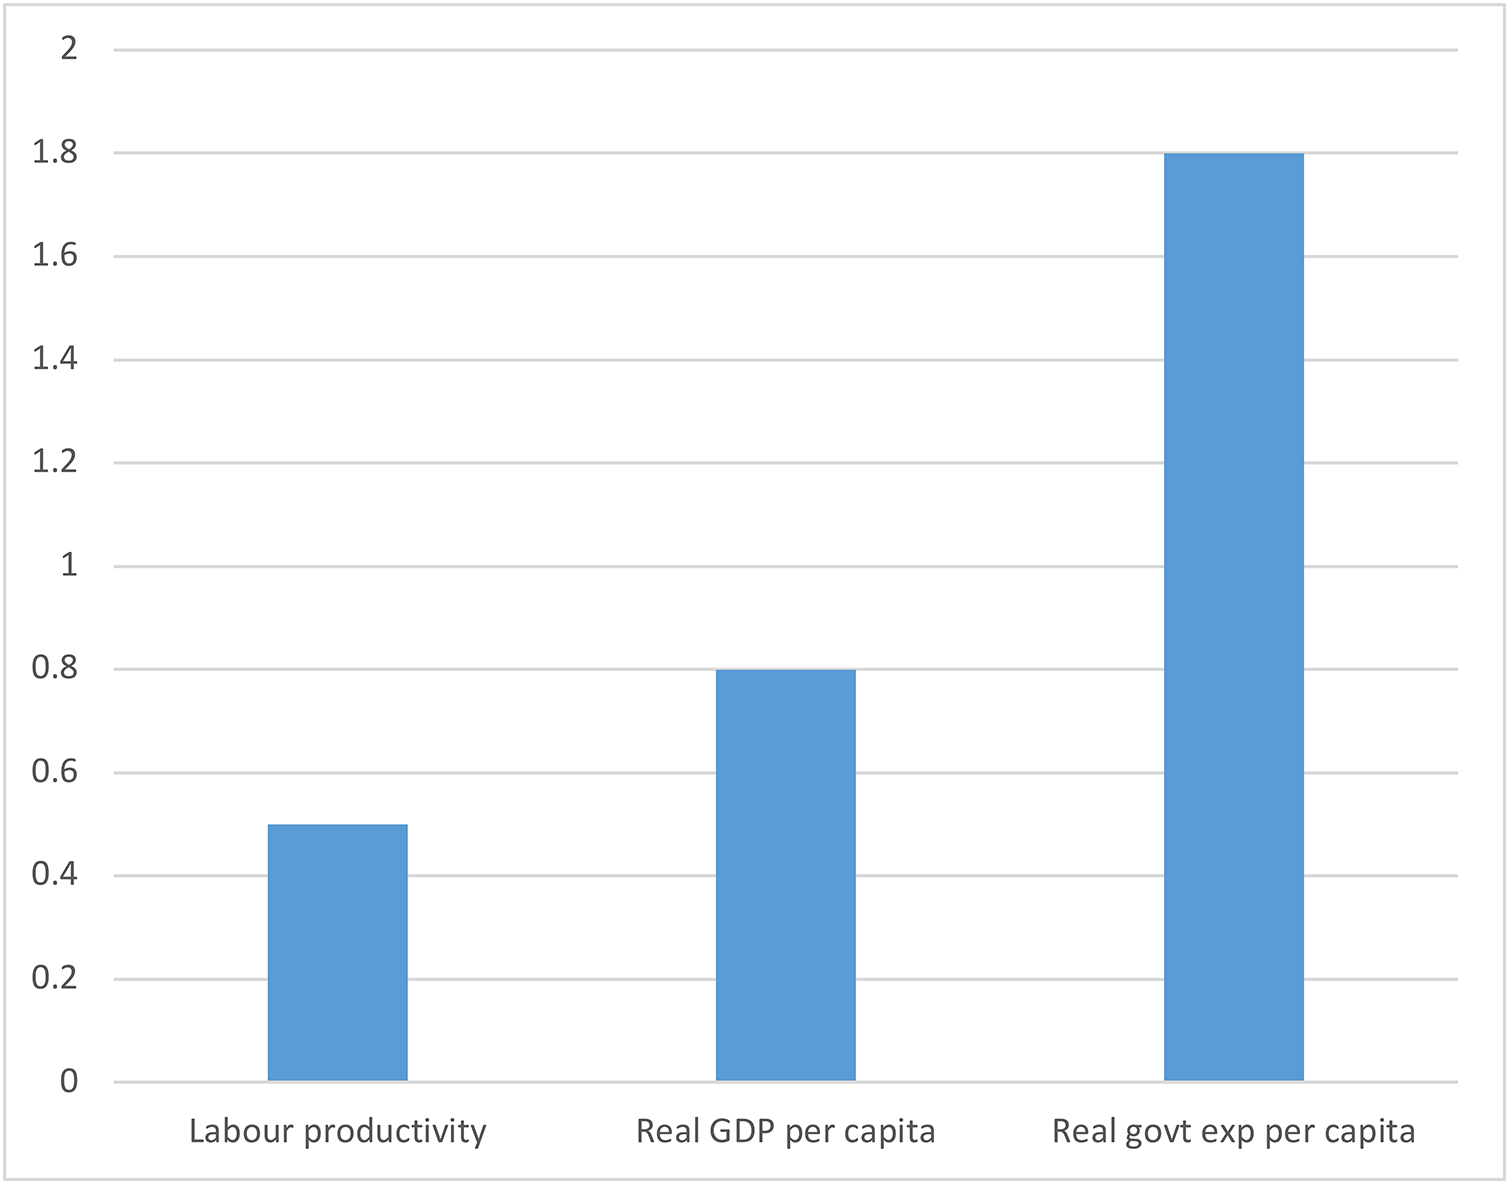
Figure 2 shows average annual growth rates in labour productivity, per capita GDP and per capita Commonwealth government expenditure from 2012-13 to 2024-25. Productivity growth has averaged only 0.5% and per capita GDP 0.8% (slightly faster as the work force has grown a little faster than the population). However government expenditure per capita has grown by 1.8% a year, one full percentage point faster than per capita GDP and 1.3 percentage points faster than productivity. This may not seem much, but over 12 years it cumulates to a very large excess.
Figure 2: Productivity, GDP and C’wealth govt expenditure per capita, annual per cent growth rates 2012-13 to 2024-25 (est)
It must be noted that the figures stated above are accrual-based results and estimates of expenses and as such differ slightly from the cash-payment figures that are more often quoted and which are included in the calculation of the cash budget deficit.
The benefit of the accrual data set is that it contains a much more informative classification of expenditure by programs and functions, thereby enabling us to identify the sources of the growth in spending.
Nevertheless, cash payments also increased from 23.9% of GDP in 2012-13 to 26.2% in 2024-25. In the 2025-26 budget estimates there is a further increase to a peak of 27% in 2025-26, then a gradual decline to 26.4% in 2028-29. So the profile is the same, pointing to an increase of 2-3 percentage points since 2012-13.
Whether we use the accrual or cash measures, the increase since 2012-13 has not been smooth. There was a slight uptrend until the pandemic, then an explosion during the pandemic, after which it briefly dropped back to the pre-pandemic level and then accelerated sharply after 2022-23. As the following sections explain, this pattern obscures the underlying trend of rapid growth in selected areas of spending which has offset slower growth in some other areas.
Figure 3 shows the average real per capita growth rates for three periods: 2012-13 to 2018-19 (restraint), 2019-20 to 2022-23 (pandemic explosion and unwind) and 2023-24 to 2024-25 (resurgence). Whereas real per capita payments grew at an average of 1.1% in the first period, they have averaged 4% or more in both the second and third periods.
Figure 3: Average real payments growth per cent
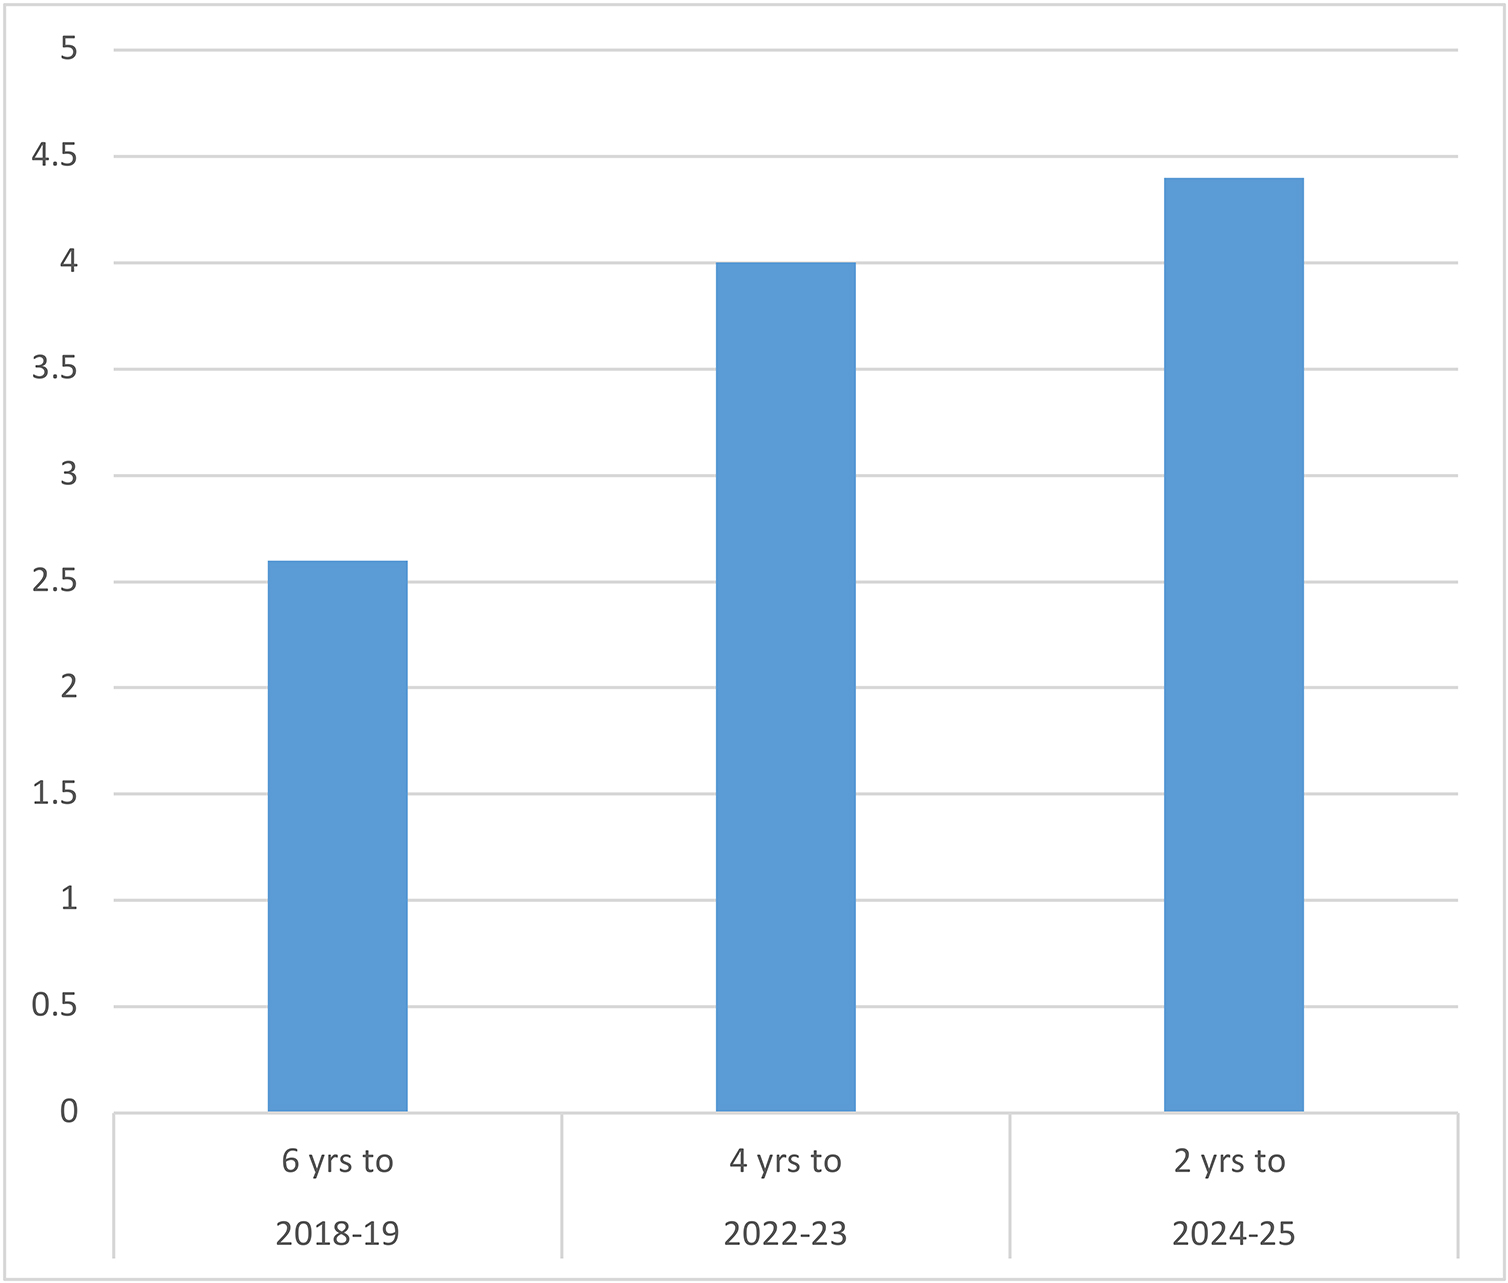
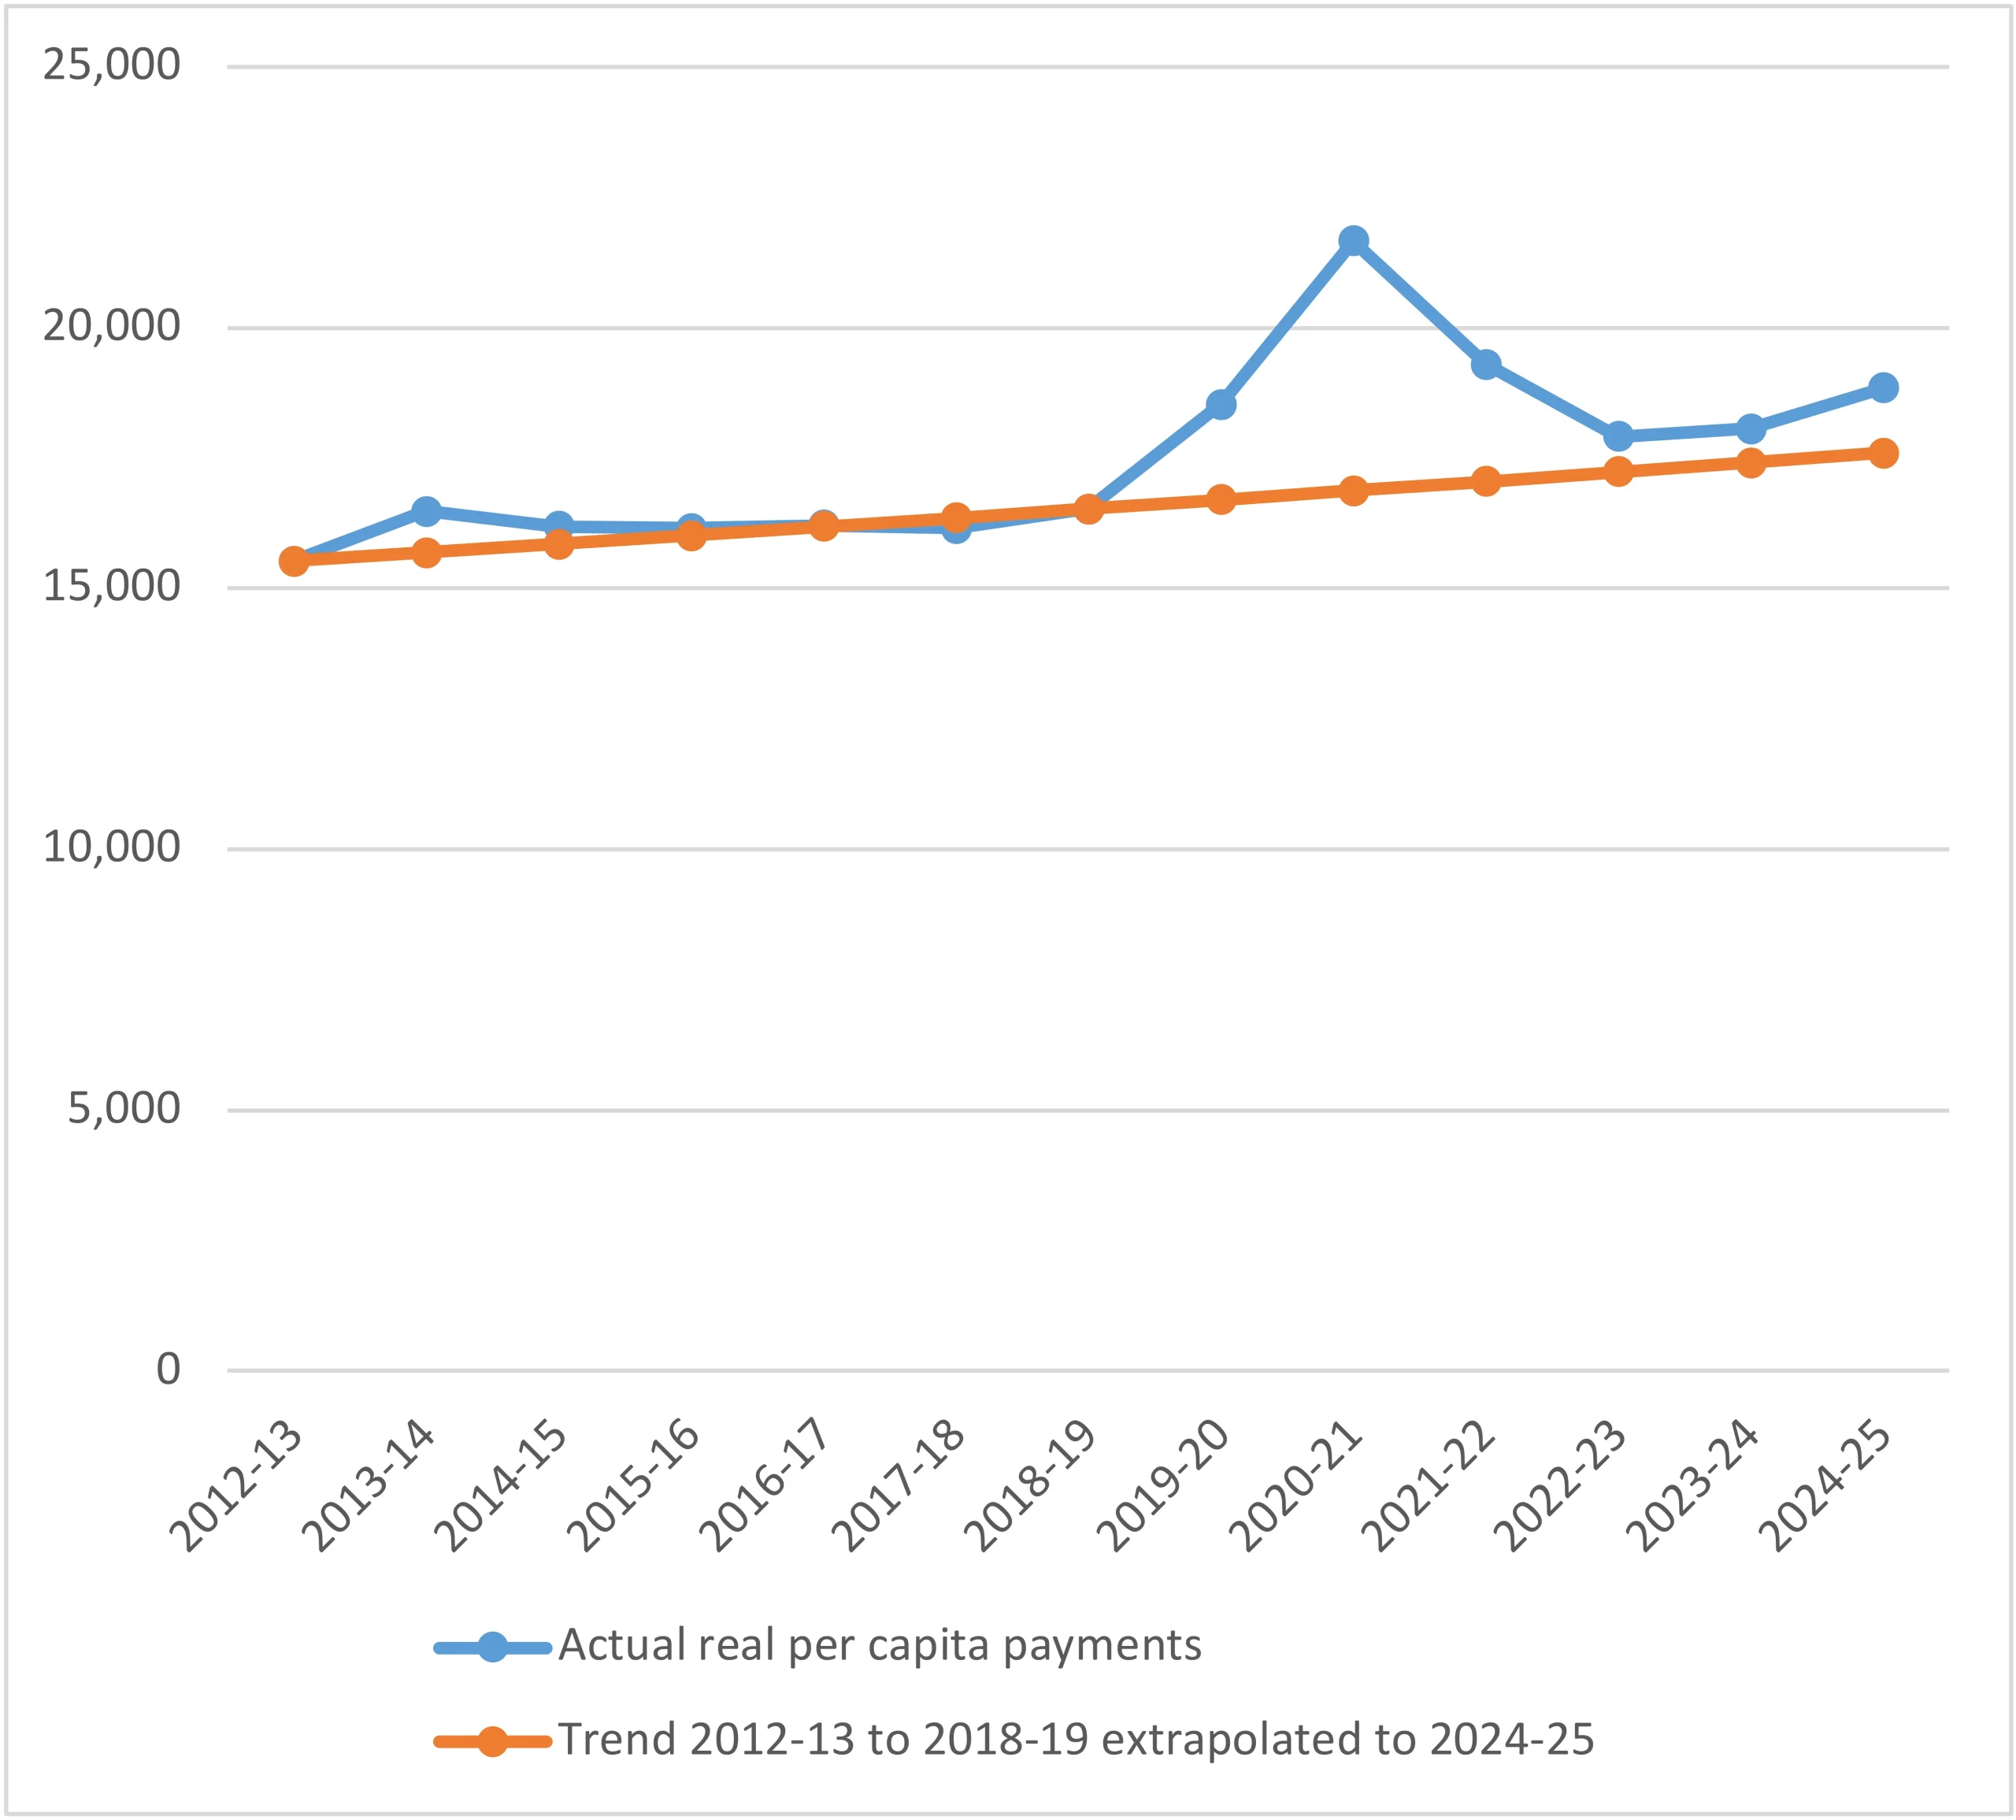
Figure 4 shows the trend growth of real per capita cash payments (as published in the budget papers) from 2012-13 to 2018-19, extrapolates this trend to 2024-25 and compares it with actual payments from 2019-20 to 2024-25. This shows both the explosion of spending in the pandemic, the decline after it, and the resurgence since 2022-23. In nominal terms payments growth averaged 8% and in real terms 4.5% in 2023-24 and 2024-25. In real per capita terms payments in 2024-25 are $1,250 above the extrapolated trend line, which may seem small but in fact translates to an excess of around $50 billion a year in current dollar terms.
Figure 4: Real per capita payments — Actual and trend, 2012-13 to 2024-25
Lifting the lid on fast growing expenditure programs
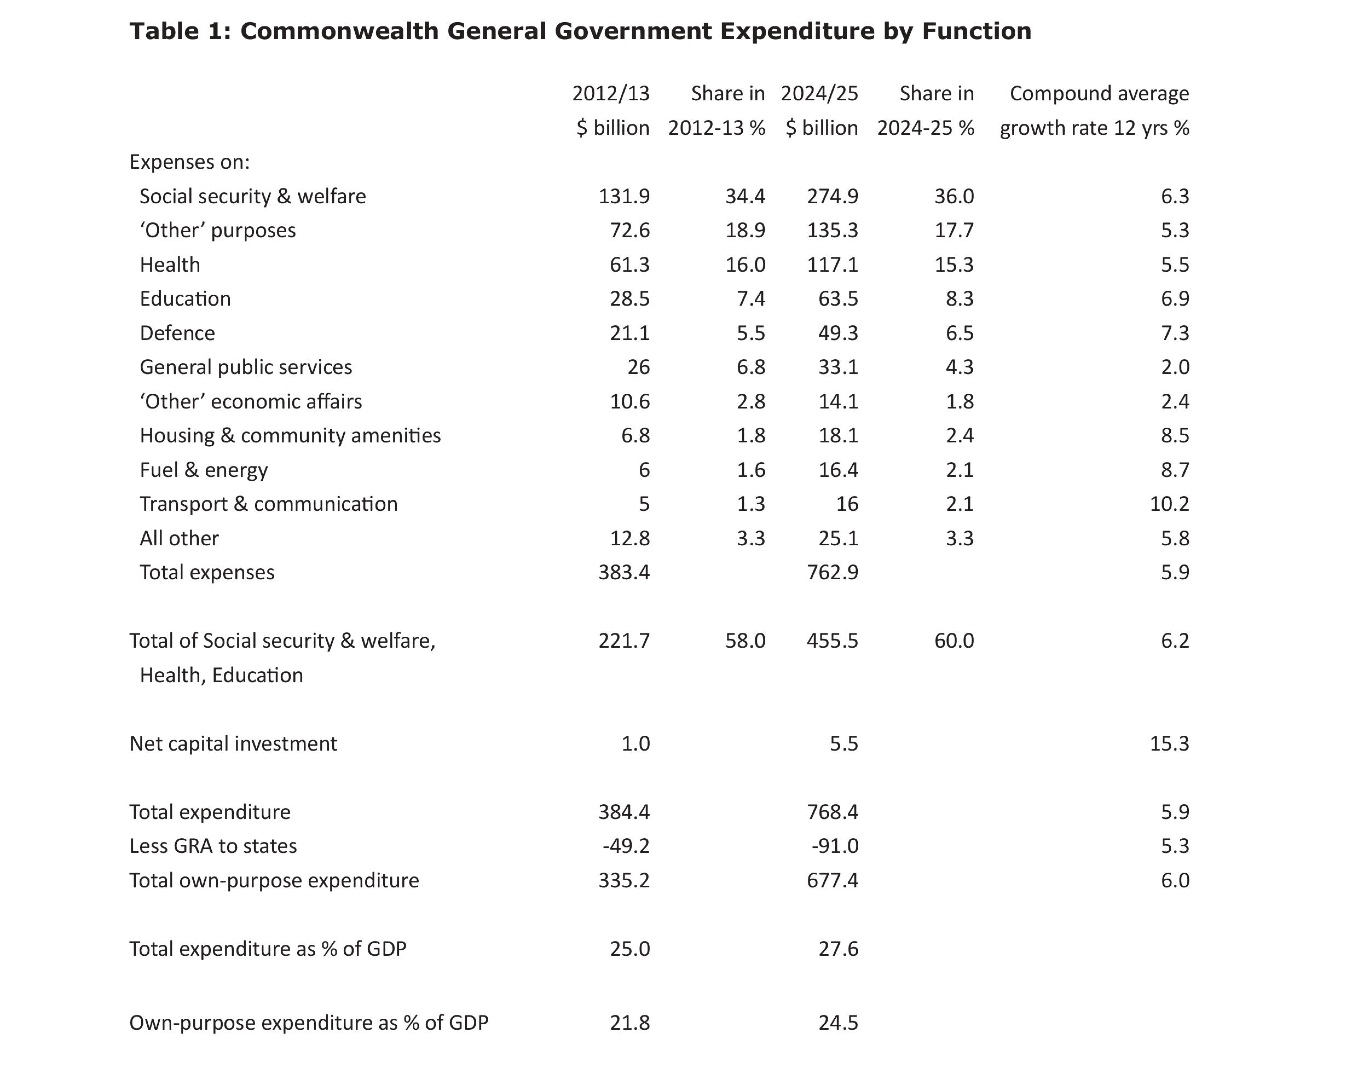
Key point: A list of fast-growing Commonwealth expenditure items which comprised 35% of total expenditure in 2012-13 accounted for 63% of the total increase to 2024-25 and is expected to account for 83% of the increase from here to 2028-29, taking its share to more than 50%. This list includes defence, the NDIS, aged care, school funding, public hospital funding, medical benefits (Medicare), the PBS, child care, road/rail transport and interest on the public debt. That is, the growth of government is being driven largely by social spending, the ‘care’ economy, defence and interest on the public debt.
The Commonwealth budget papers report the composition of expenditure by broad functional categories and the cost of the top 20 programs, which account for around 70% of total expenses in 2025-26.
However, this information does not reveal where the growth of expenditure over time has come from. For this, we start with Table 1 which shows the change in the share of total expenses of each main functional category since the 2012-13 base year discussed above and its average growth rate up to 2024-25. The high growth rates of defence, social security and welfare, health and education are apparent.
However, the functional categories are generally too broad to cast much light on the programs that have caused the growth. Thus, Table 2 delves into the finer detail of sub-functions to identify the fastest growing items of expenditure. Like Table 1, it shows the change in the share of total expenses of each item and its average growth rate up to 2024-25.
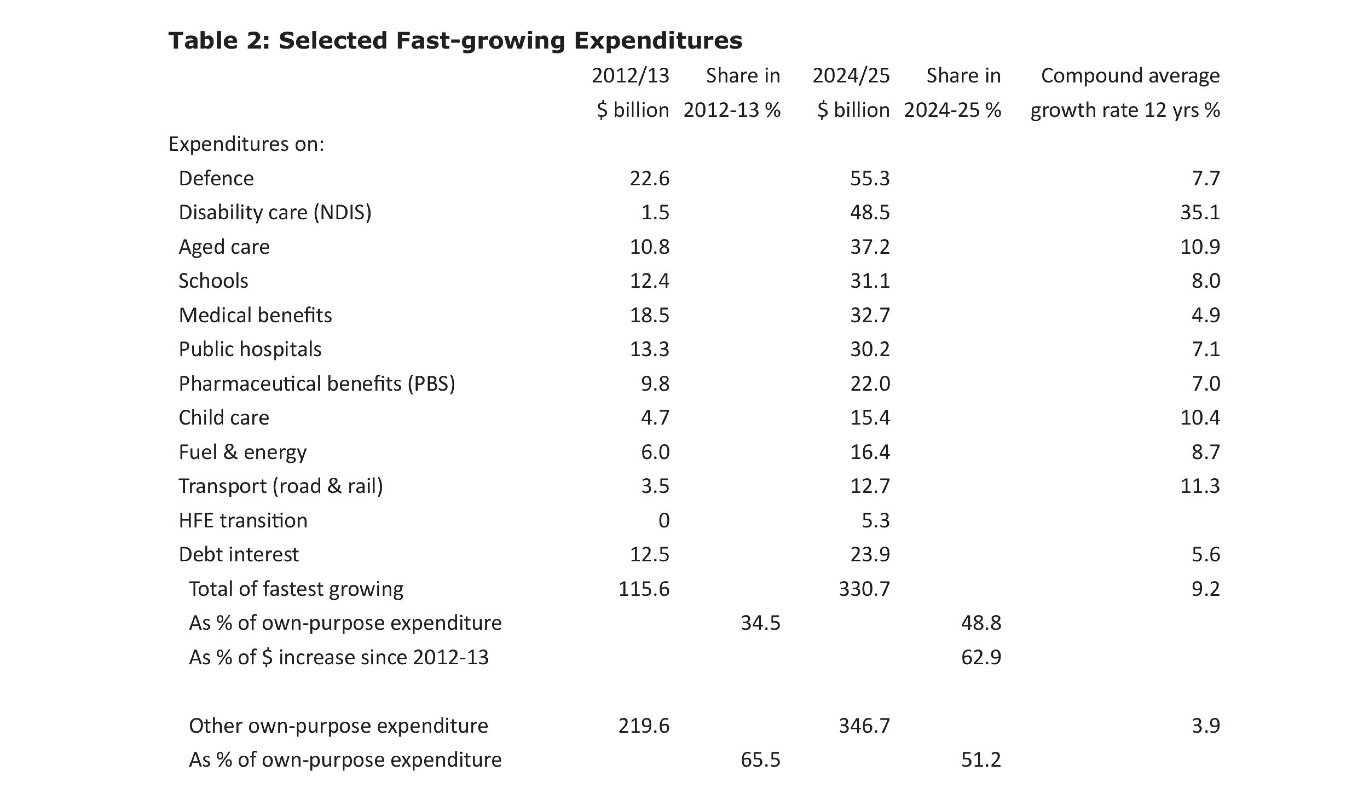
The fastest growing non-interest expense items in the 12 years from 2012-13 were defence, disability care (which was a small Commonwealth payment to states until the NDIS started in 2014), aged care, schools, public hospitals, medical benefits (through Medicare), pharmaceutical benefits (through the PBS), child care, fuel and energy, and road/rail transport (mainly through support to state projects). These, together with interest expense on the public debt, totalled $116 billion or 34.5% of total Commonwealth expenditure excluding the pass-through of GST revenue to the states.
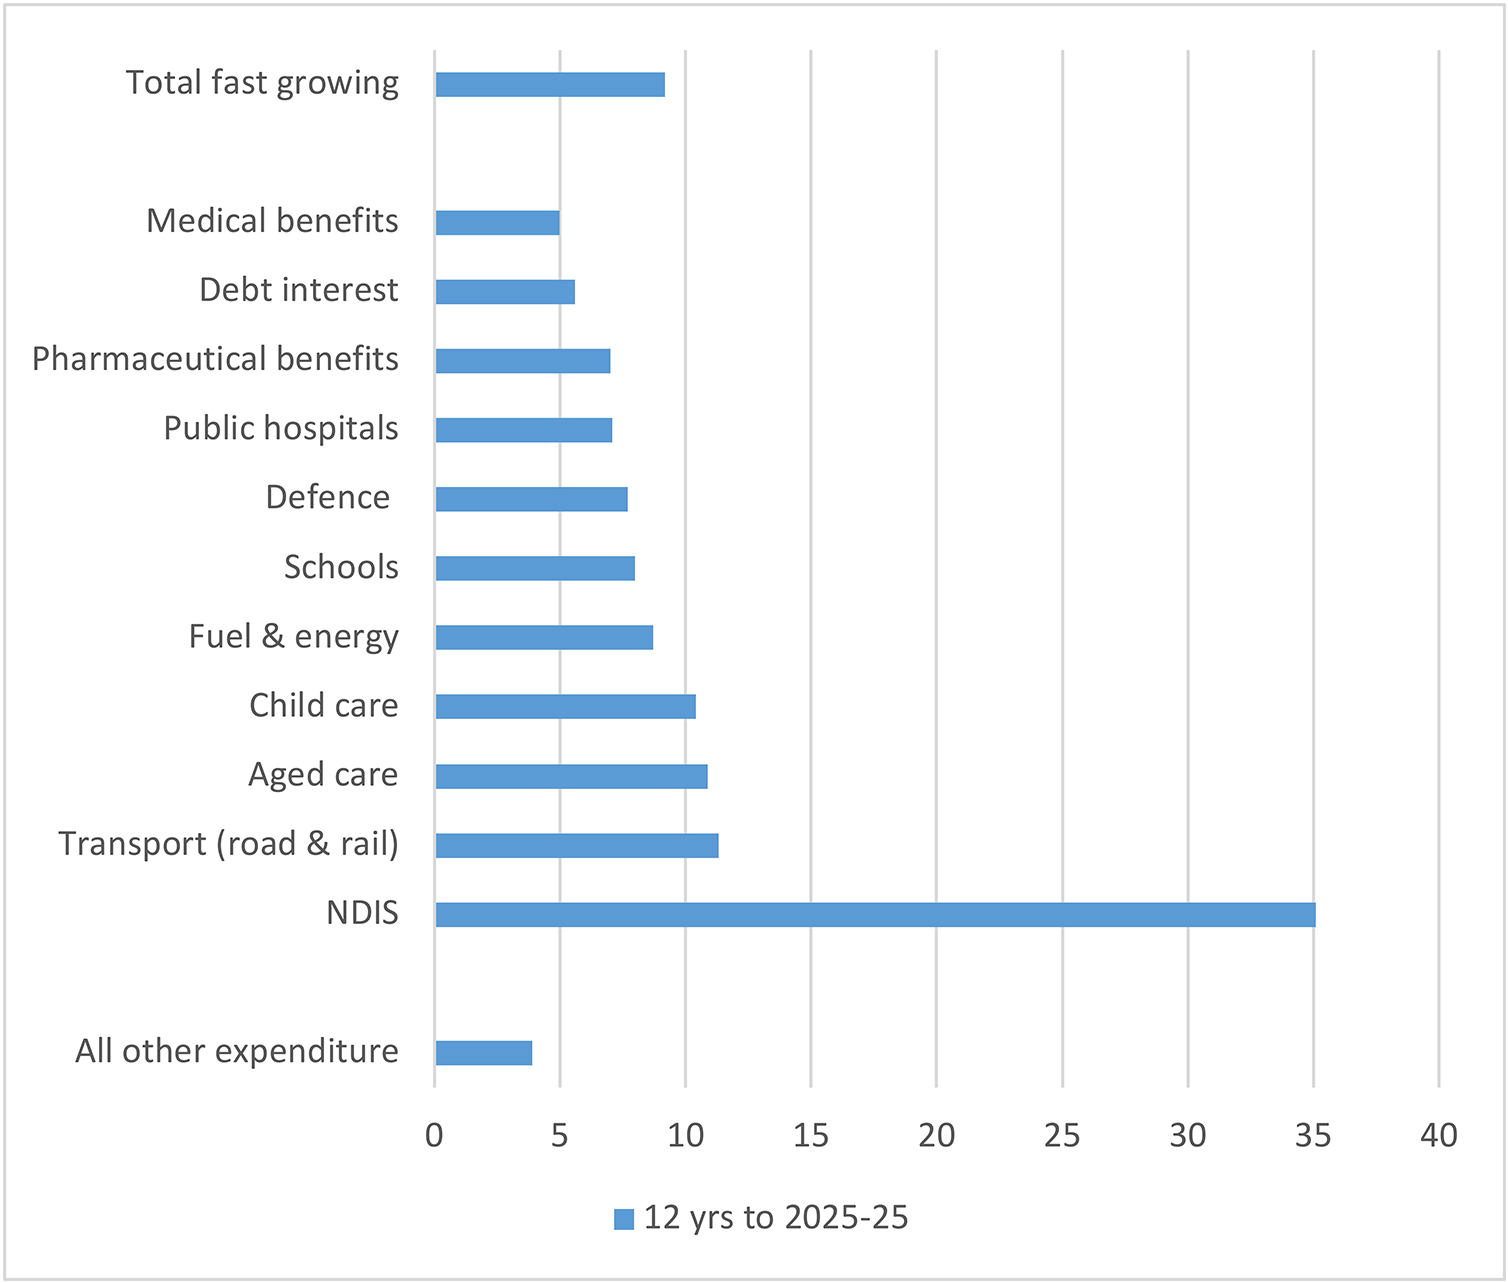
By 2024-25 these items and an entirely new expenditure – the cost of horizontal fiscal equalisation transition arrangements – totalled $331 billion, representing an average annual increase of 9.2%. Each item on this list increased by at least 5% a year for 12 years, and in most cases by much more. In dollar terms their expansion accounted for 63% of the total dollar increase in Commonwealth expenditure, bringing their share in 2024-25 to 48.8%. All other areas of Commonwealth expenditure on average increased by only 3.9% a year over the 12 years from 2012-13 (Figure 5).
Figure 5: Expenditure categories — Average % growth rates
The fast-growing list comprises a mixture of Commonwealth-run programs and services such as defence and the NDIS; grants to the states for specific purposes such as schools, public hospitals and transport projects; grants to non-government schools; and subsidies for aged care, child care, medical services and pharmaceuticals. Notably, the list of fast growing expenses does not include the large transfer payments such as the aged pension, disability pensions, carers’ benefits and family tax benefits, which total $131.4 billion or almost 20% of total Commonwealth expenditure in 2024-25. These costs have been contained while the Commonwealth has made a distinct shift towards social expenditure that delivers or subsidises in-kind services and benefits.
There are some other fast-growing expense items that fall outside the scope of Table 2 – for example, the one-off waiver of 20% of HECS student loans in 2024-25. However, items such as this do not change the broad picture provided by Table 2.
As discussed in more detail below, the accounting for government spending underpinning Table 2 does not include the off-budget expenditure officially labelled as investments in financial assets for policy purposes. These ‘investments’ cover a lot of the measures announced in recent years in industry assistance, housing affordability and the energy transition.
The 2024-25 budget forward estimates to 2028-29 point to the average growth rate of the fast-growing list slowing to 6.3% and all other expenditure to only 1.4%. The fast-growers absorb a strikingly high 83% share of the total $ increase in expenditure and lift their share of total expenditure to more than 50% (Figure 3). However, even this is likely to understate their share as they exclude the contingency reserve, which is included in total expenditure and increases year-by-year to $20.6 billion in 2028-29. In reality, some of this reserve will be allocated to fast-growing items over time.
While some of the items that grew rapidly up to 2024-25 will slow down according to the forward estimates, others will speed up – most notably interest on the public debt, as the debt continues to rise and more of it is refinanced at higher interest rates.
Impact of the Covid-19 pandemic
Key point: Massive government spending and deficits during the pandemic inflated public debt and left a legacy of billions of dollars a year in higher interest expense. It also appears that public opinion and policymaker attitudes have become more tolerant of deficits and debt in the wake of the pandemic experience.
It may seem odd that the fiscal cost of the Covid-19 pandemic – more than $300 billion — is not identified above as a separate cause of government spending growth. One reason for its exclusion is that it was not a single program but rather cut across numerous programs and included reduced revenue as well as increased expenses. Another is that the measures taken in response to the pandemic were, as the government promised at the time, temporary and had largely been terminated by 2022-23.
However, there are two important qualifications to that. One is that the additional borrowing resulting from massive deficits has permanently increased the level of debt and the cost of servicing it. It is reasonable to assume that without the pandemic the budget would have at least remained balanced in those years (as it was in the last pre-pandemic year of 2018-19) if not moved into surplus (as the 2019-20 budget estimated would be the case).
Thus the large deficits in the three years from 2019-20 to 2021-22 – totalling $250 billion – could be attributed to pandemic measures, and even if entirely temporary they caused borrowings and therefore on-going debt service (interest) costs to be greater than they otherwise would have been. This debt service cost – of around $10 billion a year – is a lingering effect of the pandemic fiscal responses.[6]
Against that, it could also be argued that the budget surpluses of 2022-23 and 2023-24 would not have happened or would have been smaller without the economic rebound that followed the pandemic and was in part a consequence of the stimulatory effect of the pandemic fiscal measures. However, those surpluses only amounted to about one in seven dollars of the pandemic era deficits.
The second qualification is that some of the fiscal measures adopted during the pandemic have endured. More generally, the dramatic loosening of fiscal policy – which saw any previous notions of prudence and restraint discarded – arguably made a lasting impression on political and public attitudes and helped set the stage for increases in other categories of spending since the pandemic. It can be argued that before the pandemic concerns about the budget deficit would have acted as a stronger constraint on new spending.
Certainly, there are signs that spending since the pandemic has not returned to its pre-pandemic trend (Figure 4), just as spending was increased in response to the global financial crisis and subsequently did not return to its pre-GFC trend. Indeed, there is a pattern in history of government spending being ratcheted up by major shocks, never to return to where it was before each shock.
How much have departmental running costs contributed?
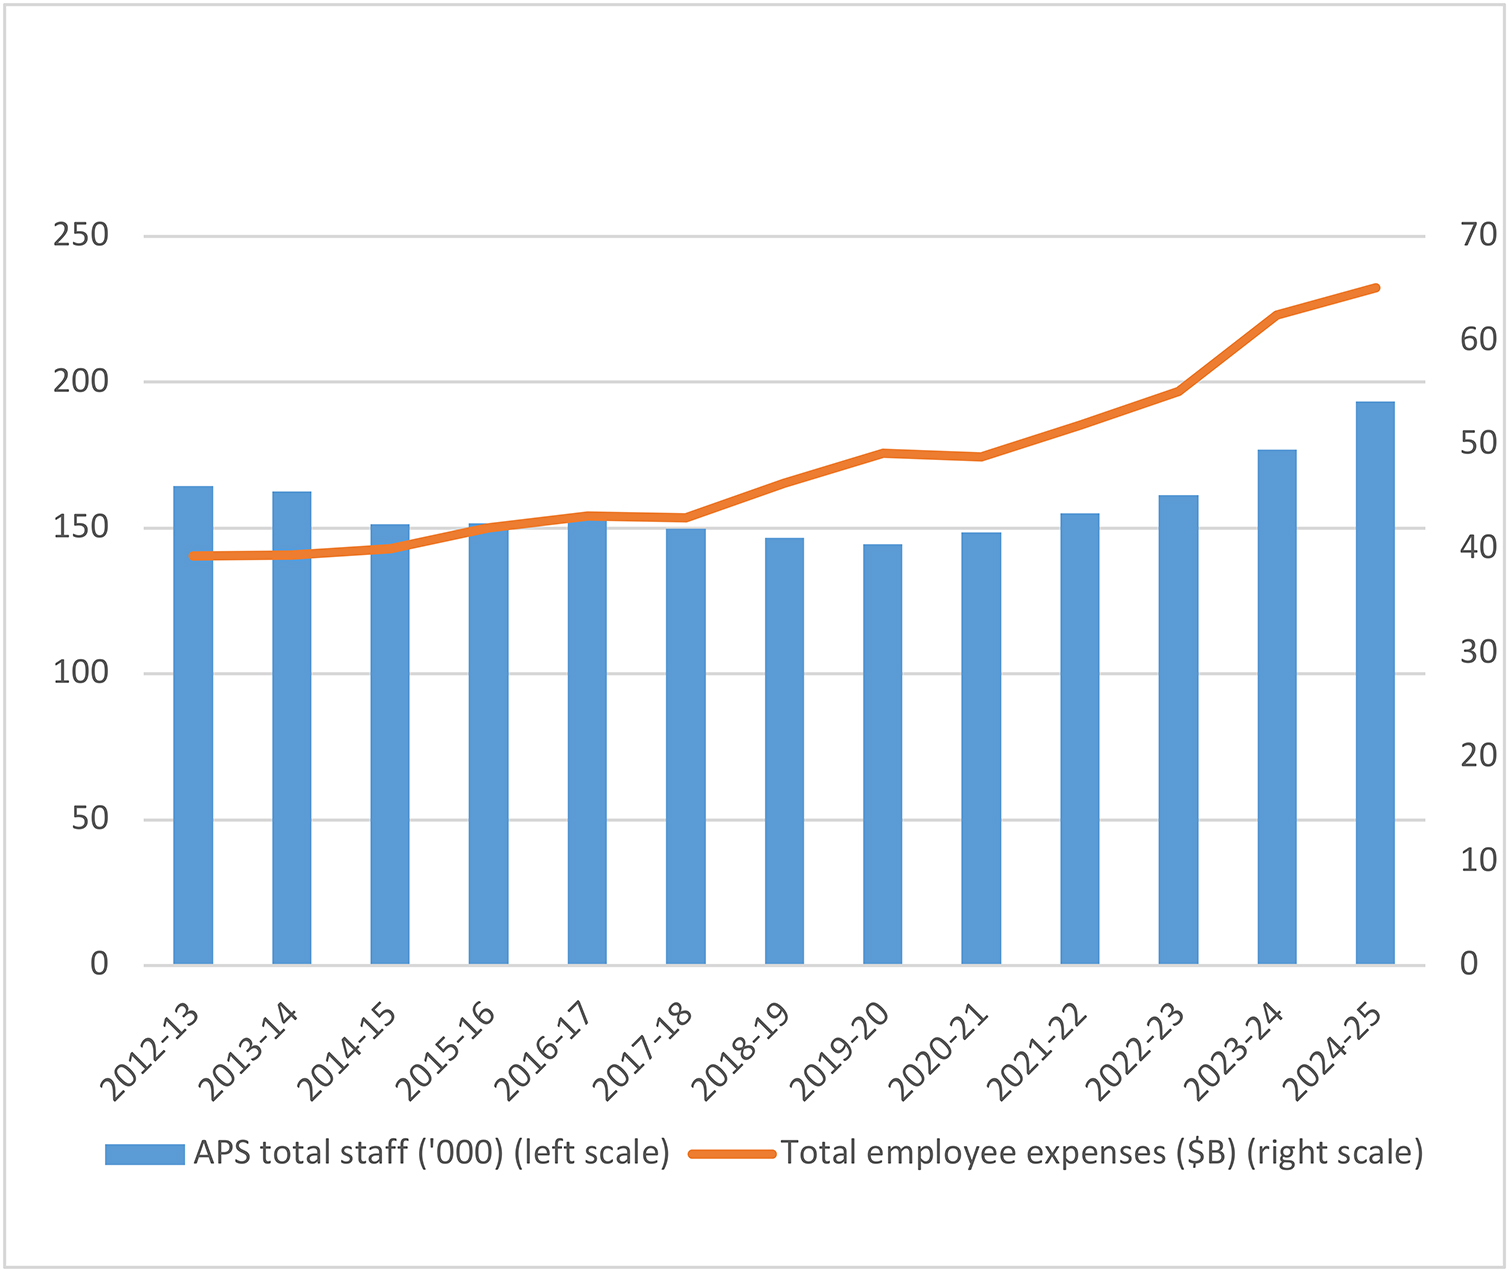
Key point: Over the 12 years since 2012-13, the cost of the public service has not increased rapidly, but this is not true of the last three years, when employee numbers and costs accelerated markedly.
The focus is sometimes on the running costs of government departments, such as when the Opposition proposed during the recent election to reduce public service numbers to increase efficiency and effect budget savings. However, in the functional classifications of expenditure used in the above analysis agency running costs cannot be isolated as they are allocated to functions such as defence, health and so on. To isolate administrative costs it is necessary to dissect total expenditure in a different way using other data which are available.
Figure 6 shows the total number of Australian Public Service (APS) employees at December each year from 2012 to 2024. (This compilation excludes defence force personnel.) On this reckoning, APS staff numbers were well controlled up to the pandemic – they actually shrank by 20,000 in the seven years to December 2019. There was then an increase in the pandemic years, followed by a much larger increase of 38,000 or 7.6% a year in the three years to December 2024. It is this increase – which occurred in the term of the Labor government – that the Opposition latched onto in its proposal to reduce APS numbers.
Figure 6 also shows the Commonwealth’s total employee expenses as reported in the financial statements to include not only wages and salaries but also superannuation and accrued employee costs such as long service leave. (Unlike APS numbers, the expense data include the defence forces.) Commensurate with the profile of APS numbers, employee expenses grew at the moderate annual rate of 3.1% up to 2021-22, but accelerated to 7.8% a year up to 2024-25. These expenses are budgeted to grow at less than 2% a year up to 2028-29.
Figure 6: Australian Public Service numbers and costs 2012-13 to 2024-25
There are administrative costs other than those relating directly to employees, such as consultants and contractors, rental of office space, IT, travel and office supplies. The government maintains that the acceleration in employee expenses since 2021-22 reflects a deliberate policy of shifting from consultants and contractors to employees after years during which the Coalition government ran down APS numbers while spending heavily on consultants. However, data to test this assertion are not readily available. All we can say is that expenses on supplies of goods and services (which would include consultant costs, but also among many other things) provide little support. The cost of such supplies still grew by 4.4% a year in the three years to 2024-25, about the same as the pre-pandemic growth that occurred while APS numbers were declining. As for the future, the budgeted increase in goods and services costs is only 1% a year up to 2028-29.
In total, employee expenses and supply of goods and services have increased by 6% a year since 2021-22 having increased by 4.7% a year in the previous nine years, even including the stepped-up expenses of the pandemic years. In the seven years to 2019-20, they increased by 3.9% a year. This control of administrative expenses was a key ingredient in the Coalition government’s gradual return to a balanced budget before the pandemic, despite the fast-growing expenses listed above. Under the Labor government, in contrast, administrative expense growth has accelerated sharply.
Administrative costs appear to be ripe for tightening. The government will say this is happening, with growth of only 1.4% budgeted for the next four years. However, if steps are being taken to achieve this, it is not clear from the budget what they are. In the recent election campaign the government went further and said that non-employee administrative expenses summed over four years would be reduced by $7 billion from the recent budget estimates.
A much broader view of the effect of government spending growth on the composition of employment is provided by the labour force data classified by industry. Three industry classifications capture direct government employment and activities that are heavily supported by government funding. These are: public administration and safety; education and training; and health care and social assistance.
As illustrated in Figure 7 employment in these industry groups, which represented 26.2% of total employment in February 2013, increased their share to 28.1% in 2019 and 31.3% in February 2025. Over this whole period of 12 years, total employment across all industries increased by 3.1 million. The three industry groups listed above accounted for 1.6 million, or close to 50%.
Figure 7: Public sector and funded employment 2013 – 2025
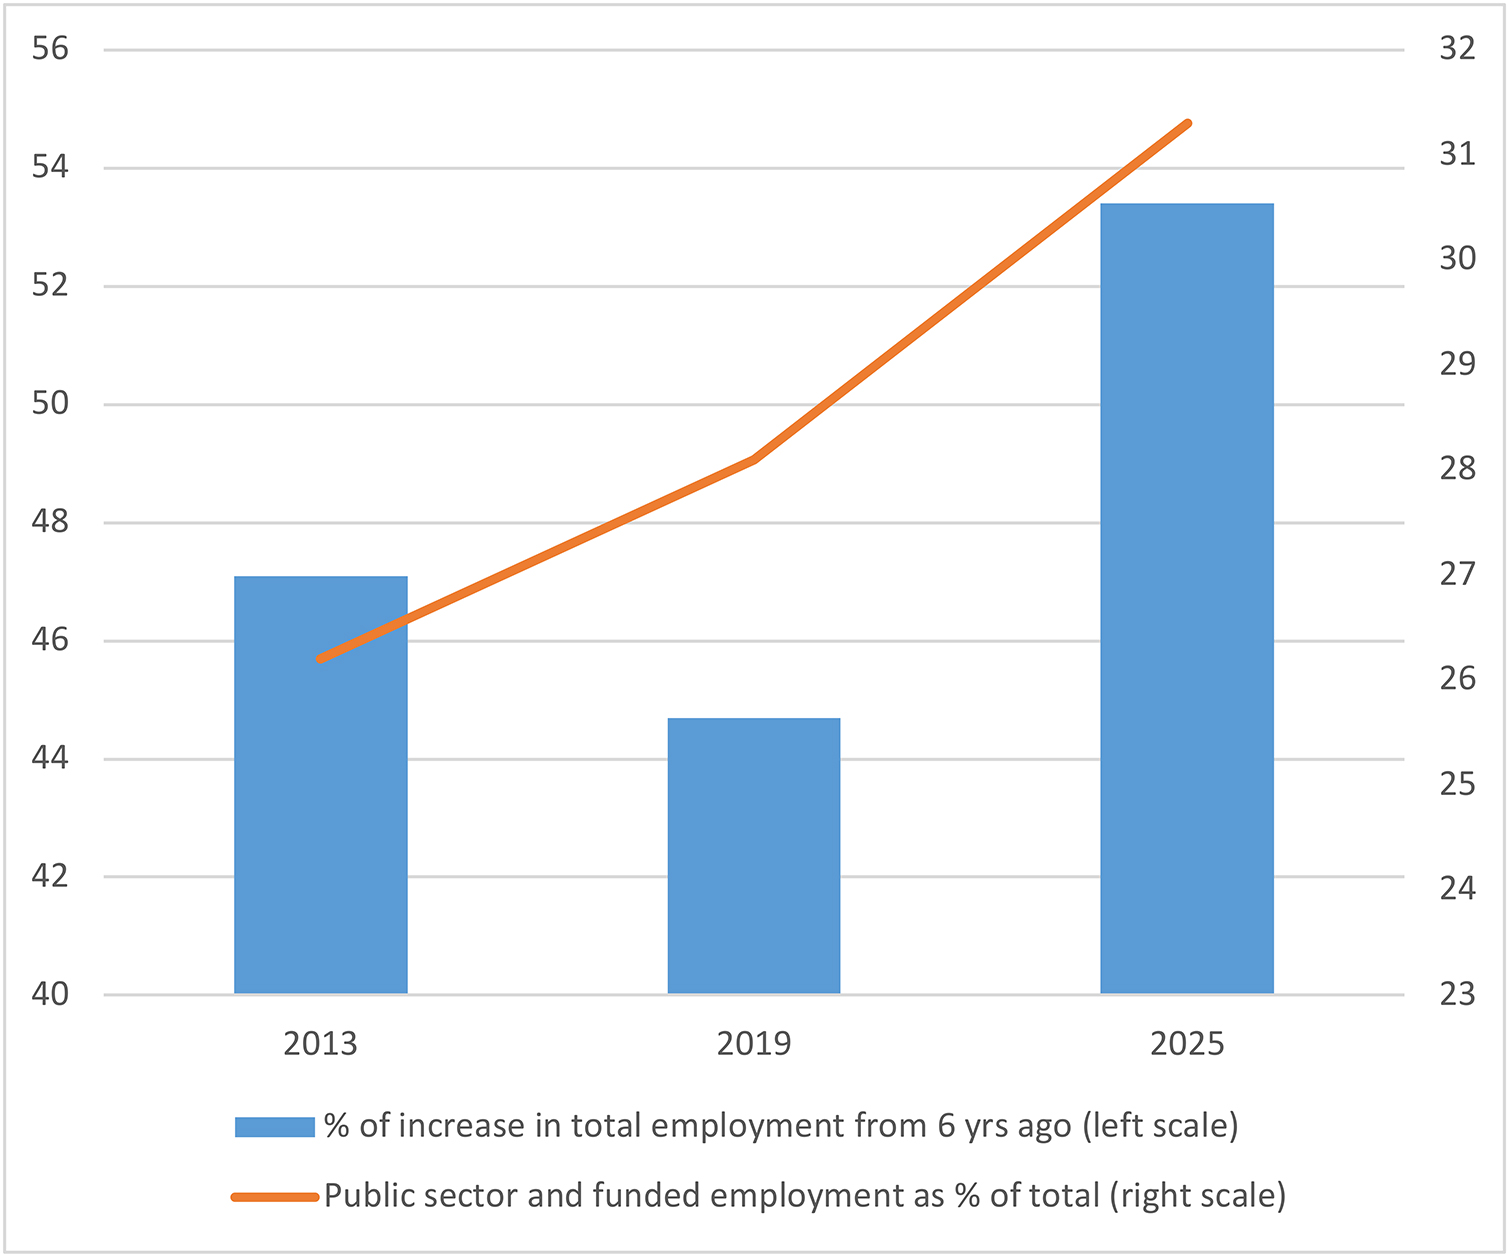
This tells us that the structure of the labour force has shifted towards labour-intensive care and education services. While some of this was to be expected as a consequence of trends such as population ageing, the structural shift has also been strongly encouraged by policies favouring the ‘care economy’ and large wage increases for relevant occupations. This has involved a large financial cost to taxpayers but also a cost to economy-wide productivity growth as labour resources have been diverted to relatively low productivity activities and the more productive sectors of the market economy have faced labour shortages.
Interpreting trends
The data up to 2024-25 are more meaningful than those for later years in that they reflect what actually happened up to 2024-25 – or at least three quarters of the way through it, when the budget was tabled. In contrast, the figures for 2025-26 onwards are estimates based on policies as they stood at the time of the 2024-25 budget.
There are reasons to expect that expenditure will grow faster than estimated in the 2025-26 to 2028-29 period, according to which growth of the fast-growing items will slow markedly. While there are some reasons for this, it also depends on a planned slow-down in NDIS costs to growth of 8% a year from more than 20% in recent years. It is not clear that this will be achieved under current policies.
Meanwhile, the government harbours ambitions to make child care universal and almost free, there are well-known pressures to increase defence spending beyond current plans and to extend Medicare coverage to dental care, pressures for more funding for Medicare bulk-billing and for state-run public hospitals will recur, and the government appears eager to spend more on transport infrastructure.
Outside the list of fast-growing expenses, other Commonwealth expenditure is estimated to grow at the remarkably low annual rate of 1.4% — and that is in nominal terms, not adjusted for inflation. That would provide welcome respite, but there is little indication of how it will be achieved.
For these reasons, the estimated easing of expenditure from 27.6% of GDP in 2024-25 to 27.1% in 2028-29 is unreliable. There is a real risk that without a determined effort by the government to rein in its expenses the share will remain at its historically high current level or rise further in the next few years.
As for where the expenditure-pruning measures might be found, the first place to look is at the list of fast-growing items up to 2024-25. It is always to be expected that the vast and diverse array of Commonwealth program expenses will show a wide range of growth rates, but what we have found as explained above is a set of programs that has grown at high rates consistently over a long period in the context of a rate of growth in aggregate expenditure above growth of GDP over that period.
While some of the rapid growth was unavoidable, there are also examples of waste and ineffectiveness in that growth – for example, in defence equipment procurement, in the NDIS where costs are running at about double the original estimates, and in school funding based on the so-called ‘Gonski’ formula which has failed to yield any improvement in outcomes.
However, we have just been through an election campaign in which the major parties seemed eager to promise more and to eschew any appearance of cuts – even slower growth – in the high profile areas of health, education and child care. The political discourse over fiscal policy and government spending has evolved to the point that any policy change that merely reduces the projected growth rate of an expenditure item (rather than an absolute reduction) is demonised as a ‘cut’ by those opposing it, while any increases are glorified by their proponents as ‘investments’.
The glorification is often accompanied by implausible claims that new spending schemes will ‘pay for themselves’ through such large economic benefits that the requisite tax revenue will be automatically forthcoming. This conveniently obviates the need to propose and justify explicit tax increases to finance the spending, and to explain away the economic costs imposed by such tax increases.
The costs of new schemes is often made to appear modest by phasing them in over a long period, which pushes the full costs out to years beyond the end of the four-year forward estimates period.
Turning to the budget and forward estimates to 2028-29, there is a growth slow-down in the fastest growing items to 6.5% a year (Table 2). Apart from a dramatic projected slow-down in NDIS growth to 8%, there are also pronounced slow-downs in school grants, pharmaceutical benefits, child care, road and rail transport, and HFE transition. Some of these are difficult to comprehend in view of recent government initiatives to spend more – such as on school grants, pharmaceutical benefits and child care.
Going against the slow-down in the above categories is a sharp projected acceleration in debt interest expense, in part because the amount of debt continues to increase but also because debt previously issued at low interest rates will have to be refinanced at higher rates.
As well as the usual detailed forward estimates the 2025-26 budget papers also provide estimated growth rates over the next ten years for the fastest growing major categories of cash payments, which are from highest to lowest: interest expense (9.5%), the NDIS (8%), defence (6.5%), hospitals (5.9%), medical benefits (5.6%), aged care (5.2%) and child care subsidies (5.1%).
Our focus on the high-growth expenditure items does not mean that all other areas of expenditure should be exempt from scrutiny for better efficiency and effectiveness which would enable expenditure savings to be achieved.
Future pressure points – more of the same
An examination of key spending programs highlights the potential for Commonwealth expenditure to step up to even higher levels over the next several years.
Defence
The recent fast growth in defence spending started from an abnormally low level of 1.5% of GDP in 2012-13 and has only brought defence up to 2% of GDP in 2024-25. The forward estimates see it rising further to 2.2% in 2028-29 and the government envisages a further increase to 2.3% in the early 2030s. While those amounts of spending could be made to achieve more ‘bang for the buck’ than has been achieved to date, it is very likely that more spending will also be needed if AUKUS is to progress and the geopolitical setting remains as fraught as it is now or becomes more so. It is not difficult to see defence rising to 3% of GDP in the foreseeable future.
NDIS
The government intends to bring the cost of the NDIS down to a growth rate of 8% a year. This is still a rapid growth rate for a maturing program, but it is not yet clear that even this slow-down will be achieved. The track-record of galloping growth and large cost over-runs does not inspire confidence, but bringing the cost of this scheme under better control is critical to sound fiscal management.
Schools
Absent new spending initiatives, Commonwealth grants for schools would slow from the rapid growth of recent times to something more like inflation plus the (very low) rate of increase in student numbers. However, over the past year the Commonwealth has succumbed to demands from the states for an increase in its share of so-called ‘Gonski’ formula funding from 20% to 25%. The recent budget confirmed that the government has provided only $400 million for this in the forward estimates up to 2028-29, whereas the cost over 10 years is $16.5 billion. Beyond that, if the funding path currently planned continues to fail its objectives as it has to date, there will doubtless be pressure to spend even more.
Health
The government recently allocated more funding for Medicare to lift the incidence of bulk billing, which is reflected in the increased growth rate of medical benefit costs to 5.8% a year up to 2028-29. However, as the targets are unlikely to be achieved – either at all, or not for long – the gap between doctors’ fees and Medicare rebates is likely to return to the health agenda. Meanwhile, there is no fundamental reform of the system to reduce cost growth.
The same cost dynamics are evident in the public hospital system, which is run by the states but receives substantial Commonwealth funding to enable the Medicare promise of ‘free’ public hospital care to be delivered. The Commonwealth-state agreement governing this funding mechanism will be up for renewal during the forward estimates period, and the states can be expected to press for increased Commonwealth grants beyond currently estimated levels.
The pharmaceutical benefits scheme (PBS) is a Commonwealth administered program. It was recently made more generous through a reduction in the maximum user contribution and an expansion of its coverage of pharmaceuticals. It is curious that despite these enhancements the government is expecting that the cost of the PBS will increase modestly in 2025-26 and then be basically flat out to 2028-29. PBS benefits will remain a pressure point, particularly as long as the cost of living is a hot political issue.
Dental care is another pressure point. It has long been an issue that Medicare does not cover dental services. Labor spokesmen have said that the logic of Medicare extends to dental, and covering it is a question of funding, not principle. The Parliamentary Budget Office recently costed this extension for the Greens and found that meaningful coverage would likely cost at least $45 billion in the first three years.[7]
Child care
Child care subsidies have ballooned from $4.7 billion in 2012-13 to $15.4 billion in 2024-25 and are set to increase to $18.4 billion in 2028-29 under current policies. However, even this increase goes nowhere near covering the cost of free (or almost free) universal child care that the government would like to phase in, which the Productivity Commission has estimated would cost at least an extra $5 billion and up to $11 billion a year.[8] Watch this space.
JobSeeker and other benefits
JobSeeker benefits are a flat budget item, but the rate of benefits is a perennial issue. The current government established the Economic Inclusion Advisory Committee which makes recommendations on such matters before each budget. The government has already delivered one increase (above CPI indexation) in 2023 and from its statements would clearly like to do more. The Economic Inclusion Advisory Committee will keep recommending increases in this and other welfare benefits.
Wage costs
The wage costs directly born by the Commonwealth for its own employees have increased rapidly in recent years particularly due to growth in employee numbers (see above). According to the budget this cost growth will moderate. However, the Commonwealth budget is also indirectly affected by wage increases in services delivered by private entities but which it subsidises, such as aged care, child care and private health. There is currently under way a series of gender-based award reviews in these and other areas. There has already been a large award increase for aged care workers, which the Commonwealth has taken the unprecedented step of funding. It has also made an initial allocation for child care workers. There will be further pressure when these award reviews are completed. There has even been a demand from the nurses’ union for the Commonwealth to pay for a potentially large impending increase in private hospital wages.
Transport infrastructure
The Commonwealth has become much more heavily involved in funding infrastructure, usually through off-budget entities such as the NBN and on-budget through grants to the states. The latter is reflected in an increase in funding for road and rail infrastructure from $3.5 billion in 2012-13 to $12.7 billion in 2024-25. This funding is estimated to level off in the next few years as existing projects are completed, but this will depend on the government reducing commitments to new projects as well as on cost blow-outs in existing projects. If recent history is repeated, the Commonwealth’s expenditure in this area will increase further rather than level off.
This all adds up to more of the same – more guns and more butter. Defence, the NDIS, schools, Medicare, public hospitals, the PBS, child care and transport infrastructure: these were the key sources of rapid growth in Commonwealth spending in the past and are likely to remain so for the foreseeable future. There may well be more. The age pension, for example, is the Commonwealth’s biggest single expense item. While its growth rate is currently under reasonable control, there is no way to predict whether political pressures for higher pensions will intensify.
For these reasons, it is unlikely that the Commonwealth’s expenditure will plateau at around 27% of GDP as projected. There will be pressure for it to increase further, which will happen unless policy measures are adopted to prevent it.
‘Off-budget’ government expenditure
Key point: So-called ‘off-budget’ financing is being used to keep $104 billion of cash outlays out of expenditure and the underlying cash deficit over five years.
There has been a trend in recent years towards increased funding of Commonwealth government policies through the use of alternative financing mechanisms outside the core budget. Although this is often referred to as ‘off-budget’ financing, it is in fact accounted for in the budget but outside the widely reported ‘cash payments’ and ‘underlying cash balance’ aggregates. Technically, the alternative financing is labelled ‘net cash flows from investments in financial assets for policy purposes’. It can be positive or negative but in practice has been negative (meaning more cash going out than coming in) and increasingly so every year since 2008-09.
These negative cash flows are a form of government outlays additional to the expenditure aggregates discussed above. They cover activities such as student loans (HECS), loans and investments in the NBN, Snowy Hydro and the Clean Energy Finance Corporation and many others. The official justification for separating them from the core budget is that they are investments that will earn a return above the government’s cost of borrowing. In practice, however, this hurdle is often not satisfied and the outlay is more appropriately considered as an addition to government expenditure. As Gene Tunny has written, “Australian governments are resorting to so-called ‘off-budget’ measures to improve the appearance, but not the reality, of their financial positions.”[9]
These negative cash flows were typically less than 0.5% of GDP up to 2014-15, averaged 0.8% in the next five years (as expenditure on the NBN roll-out peaked), dropped back to less than 0.2% of GDP, then surged to 0.7% in 2024-25 and are expected to remain at that level for the next four years.
The negative net cash flows are not included in the underlying cash deficit but are in the headline cash deficit. Hence, the headline deficit is higher than the underlying deficit by $104 billion in the five years to 2028-09. Whether or not this is a bona fide investment, it adds to the Commonwealth’s borrowing requirement.
How can the leviathan be tamed?
Action to curb government spending does not have to result in absolute spending cuts from year to year – something that has rarely if ever happened to spending in nominal dollar terms although it has occasionally happened in real (inflation-adjusted) terms. Rather, it is normally sufficient for fiscal consolidation to occur that there be credible action to slow the growth rate of spending – and especially below the trend growth rate of the economy.
However, even this minimal aim will not be achieved unless there is a change to expenditure management. Increased spending has become the preferred response to any economic or social problem, while deficit funding of expenditure is accepted to a much greater extent than was the case at least before the pandemic.
It is a moot point whether these conditions have developed because they are what the community wants or because politicians have led the community to expect them. Either way, politicians are at least complicit and must make the case to the public for a different approach and lead the way to its implementation if it is ever to materialise. In the recent election there was no sign of such leadership – to the contrary.
If governments and oppositions are willing to lower the spending trajectory this will enable the budget to be balanced years earlier than the current projection of 2035-36. Some specific policies would include:
- Rolling reviews of major spending programs aimed at reducing projected levels of expenditure while making the programs more effective per dollar spent.
- Minimising the roll-out of new spending measures.
- Adopting fiscal rules limiting the growth rate of spending per capita and requiring any new spending measures to be offset by expenditure savings elsewhere in the budget.
- At least freezing the size of the public service, and preferably reducing it, even if only through attrition.
The aim should be to achieve a structural budget balance by 2029-30, which allows five years of fiscal consolidation. This would be comparable to the five years from 1985-86 to 1989-90, during which Commonwealth budget payments shrank by a cumulative 3% in real terms and the budget went from a deficit of 2.6% of GDP to a surplus of 1.5% and at the same time meaningful tax reform was implemented.
The five years to 1999-2000 were another period of consolidation that saw the budget swing from a deficit of 2.1% of GDP to a surplus of 2% and set the stage for major tax reform in 2000. In those years real spending growth remained positive but at the moderate rate of 2.5% (1.1 percent per capita), which was below GDP growth.
The last time there was any attempt to emulate these fiscal consolidation efforts was in the Abbott government’s 2014 budget, but the onslaught of opposition to those measures ensured that few of them were ever implemented.
The precise targets do not have to be the same now, but the government should adopt them soon on advice from Treasury and Finance having regard to the different starting point and different factors shaping expenditure and revenue trends compared with the 1980s and 1990s.
If the government fails to tame the leviathan, there will be inexorable upward pressure on deficits, debt and taxation.
Conclusion
The size and scope of government in Australia is where it is now as a result of decades of expansion. This report has studied one period – since 2012-13 – to highlight the impact of the pandemic and the disproportionate contribution of a range of social and ‘care economy’ programs, defence and more recently administration.
Government expenditure was at a record level relative to the economy during the pandemic, then retreated, but has increased rapidly again in more recent years. Official projections that this growth will moderate and the size of government return to more normal levels in the years ahead are not convincing when there are many predictable pressures working in the other direction.
This is not to say that all of these pressures are avoidable, but they must be managed within an overall envelope of acceptable size. This requires a concerted effort by government in expenditure reform, which is at least as important as tax reform.
If this reform does not happen, government expenditure will continue to grow too rapidly, deficits, debt and taxes will increase, and Australia’s economic vitality will be drained. The culture of dependency and entitlement that has already taken root will continue to spread and deepen.
APPENDIX A: ACCOUNTING AND STATISTICAL ISSUES
For readers curious about the detail of government accounting, this appendix sets out the statistical basis of the report.
General government sector:
Government finances embrace the general government sector, public non-financial corporations and public financial corporations. These are all relevant to the overall finances of the government sector, but the general government sector dominates, is the primary focus of the government’s budget, and is the focus of this report. In the words of the Commonwealth budget papers, general government “provides public services that are mainly non-market in nature and for the collective consumption of the community, or involve the transfer or redistribution of income”. General government agencies are mostly government departments whereas non-financial corporations are market-based such as the NBN.
Cash or accrual measures:
Commonwealth budget reporting adopted accrual accounting in the late 1990s but has continued to emphasise cash accounting concepts. The accrual-based accounts are a more rigorous framework for assessing expenditures and revenues, are based on the IMF’s accrual government finance statistics framework and Australian and international accounting standards and are the audited accounts of the Commonwealth.
This report places most of its emphasis on accrual measures but also pays some attention to cash measures. One reason for this is that the accrual-based measures of expenditure are better classified by functional and program purpose, which is the focus of this report.
Expenses or payments:
Accrual-based expenditure is labelled ‘expenses’ in the operating statement of the budget accounts and cash-based expenditure is labelled ‘payments’.
One key difference between them is the treatment of capital expenditure, which is included in cash payments but not in accrual expenses, where past capital expenditure is reflected in depreciation expense. Thus, if gross capital expenditure exceeds depreciation expense the accrual expenses measure understates total government expenditure. This has been the case in recent years.
Accordingly, this report uses a hybrid concept of general government expenditure defined as accrual expenses plus net capital investment, which is gross investment less depreciation. This hybrid measure of expenditure is generally a close approximation of cash payments. For example, the hybrid measure for 2025-26 is $794.5 billion whereas cash payments are $777.5 billion, the difference being mainly the accrual item ‘superannuation interest expense’ of $15.2 billion.
GST revenue and distribution:
Although the GST is a tax levied under Commonwealth statute and the revenue is booked in full as Commonwealth tax revenue, by intergovernmental agreement all of this revenue is passed through to the states. Conceptually, therefore, while GST revenue and the matching grants to the states are recorded separately, the grants should have no net effect on the budget balance. In practice there is a net effect resulting from timing differences between the revenue and the payments. For 2024-25 for example, the budget estimates that revenue will be $94.4 billion but the pass-through payments will be $89 billion.
In this report, because of the close connection between the revenue and the payment we exclude the payment from the measure of aggregate Commonwealth expenditure to arrive at a measure of Commonwealth ‘own-purpose’ expenditure.
However, this exclusion does not apply to what the budget calls ‘HFE transition’ payments, which are general purpose payments to the states over and above their GST entitlements. The HFE transition payments result from the agreement reached between the Commonwealth and the states in 2017 to apply a minimum payment to Western Australia. In 2024-25 the HFE transition payment is estimated to be $5.3 billion.
Underlying and headline cash balances:
The underlying cash balance is the measure of budget deficit or surplus the government chooses to highlight as it is claimed to be the best representation of the net economic impact of the budget. It excludes cash transactions relating to what the government’s accounts label ‘flows from investments in financial assets for policy purposes’ – for example, HECS loans to students, Clean Energy Finance Corporations loans, investments in NBN and Snowy Hydro, and many others.
While there is a valid conceptual distinction between the government’s expenses and investments in financial assets, whether all of the allocations classified as investments are legitimate is another matter.
In any case, investments in financial assets add to the government’s borrowing requirement in the same way as expense.
Cost of the NDIS:
Prior to the NDIS being created, disability services were the responsibility of state governments and the Commonwealth made a small tied grant payment to support them. This has changed with the advent of the NDIS, which involved the Commonwealth taking over responsibility for disability services and the states making a financial contribution.
Consistent with the NDIS being a Commonwealth entity, the budget papers report the total cost of the NDIS on the expense side of the Commonwealth accounts. However, the net cost to the Commonwealth is lower than the total cost as the states and territories make a contribution which is recorded on the revenue side of the Commonwealth accounts.
For example, for 2023-24 the cost of the NDIS is reported as $38 billion, but as the states and territories contributed $11.2 billion the net cost to the Commonwealth was $26.8 billion.
Consistent with the Commonwealth budget treatment, this report mainly uses the gross cost of the NDIS when referring to the cost of the NDIS. This is more meaningful when the Commonwealth has responsibility for the entity, the state/territory contribution is fixed by agreement and the Commonwealth bears most of the risk from cost growth.
Hybrid measure of total Commonwealth expenditure:
Bringing together the above, as an example our hybrid measure of total Commonwealth expenditure in 2024-25 using the 2025-26 budget estimated is as follows:
General government accrual expenses = $762.8 billion
Plus net capital investment = $5.5 billion
Minus States’ GST entitlement = $89 billion
Equals total Commonwealth own-purpose expenditure = $677.3 billion.
Data sources:
Commonwealth Budget Papers, Paper No. 1, particularly Statement 5: Expenses and Net Capital Investment, various years from 2013-24 to 2025-26.
Australian Bureau of Statistics, Government Finance Statistics: Annual, various issues from 2003-04 to 2023-24; and Quarterly, March quarter 2025. Also National Income and Expenditure, Consumer Price Index, and Population statistics.
Parliamentary Budget Office, Data Portal, Historical Fiscal Data, 2025-26 Budget update.
Endnotes
[1] John Roskam, Australian Financial Review, 16 May 2025.
[2] Robert Carling and Terrence O’Brien, “Voting for a living: A shift in Australian politics from selling policies to buying votes?”, CIS Policy Paper 9, The Centre for Independent Studies, September 2018.
[3] For a more extended discussion of these issues, see Simon Cowan and others, “Target 30 – Towards Smaller Government and Future Prosperity”, The Centre for Independent Studies, 2013.
[4] Robert Carling, “Government Spending and Inflation”, CIS Policy Paper 58, The Centre for Independent Studies, September 2024.
[5] In practice the project has not been limited to efficiency in the narrow sense of government administration, as it has also upturned program objectives such as in the foreign aid program, but it is the case that the big domestic social programs have been off limits.
[6] Assuming an interest rate of 4 percent on the debt.
[7] Parliamentary Budget Office, Costings, “Putting dental care into Medicare’, Advice provided to Mr Adam Bandt MP, 5 March 2025.
[8] Productivity Commission, Inquiry Report, “A Path to Universal Early Childhood Education and Care”, 18 September 2024.
[9] Gene Tunny, “Gorillas in the Mist: How government obscures its spending”, The Centre for Independent Studies Policy Paper 59, November 2024.