
Interactive Snapshot – Exposing the stealth tax: the bracket creep rip-off
SCROLL DOWN TO ACTIVATE THE GRAPHS
Robert Carling and Michael Potter
- Bracket creep is automatically increasing the tax burden every year and is further increasing the budget’s already excessive reliance on personal income tax.
- It is harming employment, wages, growth, productivity and innovation, as personal tax is one of the least efficient taxes in Australia.
- Bracket creep results in taxpayers paying a rising share of their income in tax as average incomes grow due to inflation and economic growth. It will continue to happen unless the thresholds for income tax brackets are adjusted for average income growth.
- It is a stealth tax: a tax increase that happens automatically with no intervention from the government.
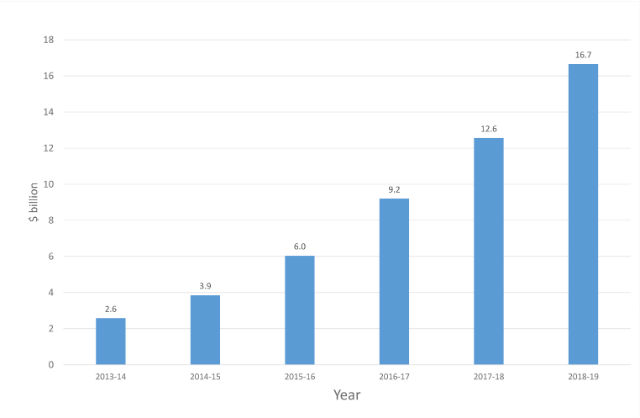
- Even with low inflation, the cumulative impact of bracket creep is substantial. If no action is taken, taxpayers will be paying $16.7 billion more in tax in 2018–19 as a result of bracket creep in the six years since 2012–13 (which is when tax thresholds were last changed).
- In 2018–19, the average Australian taxpayer is forecast to pay $1,180 per year in extra tax, or $23 per week, due to bracket creep. This represents the equivalent of a year’s pay increase on average.
- The forecast impact of bracket creep on low to middle income earners (earning between $27,500 and $83,000 in today’s money) is greater than the average impact.
– According to CIS modelling, taxpayers in the income decile of $37,500 to $46,500 will be paying an extra $1,300 per year in tax due to bracket creep. Their take home pay will be 3.3% lower than if the bracket creep were fixed.
– The greatest impact is estimated to be on a person earning around $37,100 in today’s money, and the smallest impact is on a person earning around $154,200.
- From 2012–13 to 2018–19, 4.3 million taxpayers (or almost one third of taxpayers) are expected to move into higher marginal tax brackets, with 2.5 million facing this change due to bracket creep.
- These higher marginal tax rates create significant disincentives when combined with the withdrawal of welfare payments. The impact will probably be highest on second income earners and is likely to reduce female employment.
- Bracket creep is generating significant extra revenue for the government, but in a way that lacks transparency and makes it easier for the government to avoid making tough decisions to limit spending. The economic costs of bracket creep are higher than other ways of reducing the budget deficit, especially tighter control of government spending.
- To address bracket creep, tax thresholds should be automatically indexed to a measure of average nominal wages growth, or the thresholds set at a fixed percent of average wages.
How much will I lose per year in 2018-19 due to bracket creep?
The interactive graph below shows how much you are expected to lose during 2018-19 due to bracket creep. This is the reduction in your yearly take home pay, or equivalently the increase in tax you will pay in 2018-19. The average loss per taxpayer is about $1,180.
How much will I lose per week in 2018-19 due to bracket creep?
The amount you are expected to lose per week is shown in the interactive graph below. The average loss is about $23 per week.
How much will my tax rate increase due to bracket creep in 2018-19?
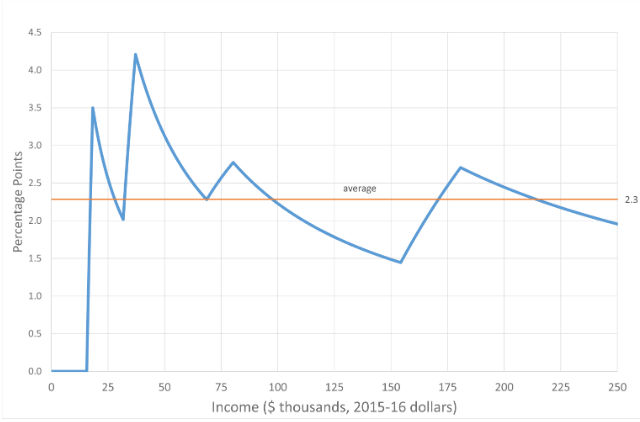
The dollar cost of bracket creep grows with income, as shown in the graphs above. However, the relative impact is different, as shown in the interactive graph below. This shows the percentage point increase in average tax rates due to bracket creep. The average increase is about 2.3 percentage points. In general, the increase in tax rate is greater at low incomes. As a result, bracket creep is broadly regressive, because it hits low income earners harder.
Bracket creep is automatically increasing the tax burden on all income tax payers
Tax as a share of pre-tax income (or the average tax rate) is increasing year-by-year. The last time there were any income tax cuts was 2012–13. By 2018–19, the average tax rate across all taxpayers will have risen by 2.3 percentage points since 2012–13. The average tax increase will be $1,180 per year or $23 per week. In fact, there has been even more bracket creep, because for all but the lowest tax bracket there has been no threshold adjustment since at least 2010. The figure to the right also shows that bracket creep is affecting all taxpayers, even if they don’t move tax brackets.
Bracket creep is eroding take-home pay
Another way of looking at the impact of bracket creep is to calculate the effect on after-tax (take-home) pay.
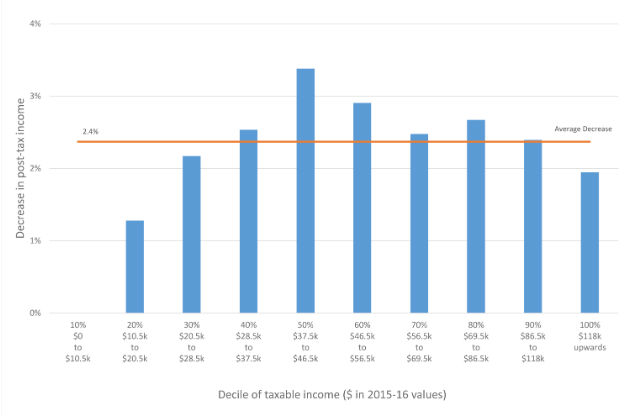
Using 2012–13 as the base year, by 2018–19 take-home pay will be reduced on average by 2.4% because of bracket creep (or $23 per week).
While taxpayers will probably still have higher after-tax income than today, it will be lower than it would be without the impact of bracket creep.
The damage is greater for those on lower incomes
Bracket creep works in a broadly regressive way. The increase in the tax burden and erosion of take-home pay is largest at the lower levels of pre-tax pay. As the figure above (Figure 1 of the main report) shows, the largest percentage reduction in take-home pay is in the $37,500 to $46,500 income range. On average, taxpayers in this range will find their take-home pay 3.3% (or $25 per week) lower than it otherwise would be in 2018–19.
Bracket creep is pushing many taxpayers into higher tax brackets
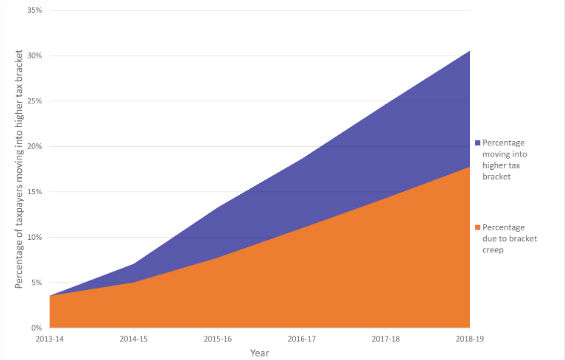
As noted above, all taxpayers are affected by bracket creep, even if they don’t move into higher marginal tax brackets: all taxpayers experience an increase in their average tax rate regardless of their marginal tax rate. However, the economic harm of bracket creep is greater when more people are pushed into higher rate brackets. Over the six years to 2018–19, 4.3 million taxpayers (31% of the total) will move into higher tax brackets, with more than half of those moves due to bracket creep (see figure to right). This particularly exacerbates the disincentives for work in low income households. At higher income levels, this creates incentives for tax minimisation and emigration and discourages innovation, education and investment by unincorporated businesses.
The government is stealthily reaping substantial revenue from bracket creep
The government’s failure to adjust tax scales since 2012–13 is already reaping an extra $6 billion in revenue this year. By 2018–19, that figure will grow to $16.7 billion in that financial year alone (or a cumulative $51 billion since 2012–13). This is shown in the figure to the left. While this is contributing to budget repair, there are much less economically harmful and more transparent ways to reduce the budget deficit, including stronger expenditure restraint. In fact, bracket creep weakens budget discipline.
What needs to be done
- The government can make one simple change that will eliminate bracket creep forever. It should apply the same principle of automatic indexation that governments have eagerly applied to excise duties on petrol and other items.
- Bracket thresholds should be indexed to a measure of average nominal wages growth or set as a fixed percentage of average wages.
- Just indexing to CPI inflation is not enough, because that would still leave growth in average real wages subject to bracket creep.
- Historically governments have preferred to let bracket creep continue for years until it becomes a hot political issue, and then announce discretionary ‘tax cuts’ which merely hand back some of the proceeds of bracket creep. Automatic indexation is better for keeping governments honest and applying stronger budget discipline.
Robert Carling is a Senior Fellow at the Centre for Independent Studies. Robert is researching and writing about fiscal policy, taxation and federalism. In addition to working on TARGET30 papers Robert has recently written reports called Shrink Taxation by Shrinking Government! and States of Debt. Prior to joining the CIS, Robert was Executive Director, Economic and Fiscal at the New South Wales Treasury from 1998 to 2006. Previous position have been with Commonwealth Treasury, the World Bank and the International Monetary Fund.
Michael Potter is a Research Fellow at the Centre for Independent Studies. Michael has worked for the Parliamentary Budget Office, the Federal Departments of Treasury, Environment and Prime Minister & Cabinet (where he advised then Prime Minister John Howard on the introduction of the GST). He has also worked as Policy Manager, Economics at the National Farmers’ Federation, and Director, Economics and Taxation at the Australian Chamber of Commerce and Industry.
Research Report 8 (RR8) • ISSN: 2204-8979 (Printed) 2204-9215 (Online) • ISBN: 978-1-922184-57-3 • Published December 2015
Interactive Snapshot – Exposing the stealth tax: the bracket creep rip-off