Home » Commentary » Opinion » The federal budget is still in a fragile state
· BUSINESS INSIDER

 A dollop of good fiscal fortune — a scarce commodity in Australia’s recent fiscal history — has enabled Treasurer Scott Morrison to boast of a federal budget deficit revised down by several billions of dollars this year and cruising towards balance in 2020-21.
We should not deny the Treasurer a moment of satisfaction, but on close inspection the mid-year economic and fiscal outlook (MYEFO in the jargon) reveals nothing much has changed since the May budget. The revenue gains that take a chunk out of this year’s deficit don’t extend into later years, expenditure remains stuck around 25 per cent of GDP and the deficits and surpluses estimated for 2018-19 to 2020-21 are not much different from those in the budget. At least the fiscal outlook has stabilised and is not getting worse.
How much better it is going to get is still an open question. It is understandable — though still remarkable — how confidently Treasurers speak of forward estimates that peer ahead through four years of fiscal fog. The reality is that the forward estimates are nothing more than the bureaucracy’s best guess at how the budget aggregates will evolve based on the working assumption that tax and expenditure policies remain frozen until 30 June 2021. They speak as if the estimates for each of the four years are equally reliable, whereas the further ahead one looks, the less reliable they become.
The wide margin of error to which forward estimates are subject is illustrated by a little-noticed section of the budget papers showing 70% and 90% confidence intervals around the estimates of the budget deficit. Chart 3.10 from the MYEFO report demonstrates this.
Chart 3.10: Confidence intervals around the underlying cash balance forecasts
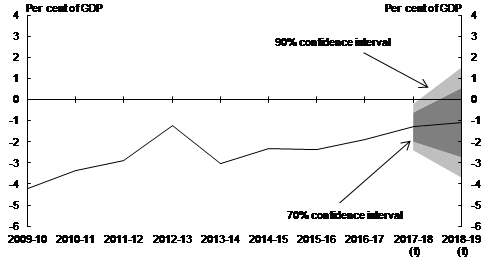
Note the width of the bands and how they widen from this year to next. We are left to imagine how wide they would be if extended to 2020-21. As an actual example, the 2016-17 outcome was a deficit of $33.2 billion, but four years earlier was estimated to be aa surplus of $6.6 billion — a difference of almost $40 billion. The particular circumstances that brought about such a result are unlikely to be repeated, but the point remains that estimates four years ahead should be taken with a grain of salt.
Another little-noticed section of MYEFO shows the extent to which the structural budget deficit is currently larger than the actual deficit. Another way of saying this is that current economic conditions are flattering the budget result to some extent, and in more normal conditions the deficit would be larger. The relevant MYEFO graph is Chart 3.5
Chart 3.5: Structural budget balance estimates
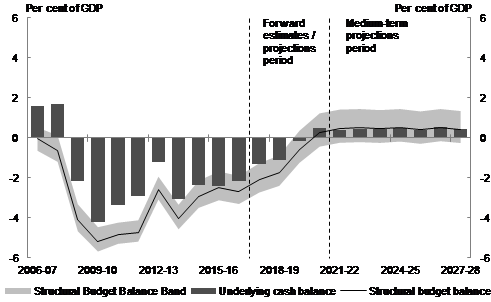
Note: The methodology for producing structural budget balance estimates was detailed in Treasury Working Paper 2013 01 and incorporates the medium term projection methodology detailed in Treasury Working Paper 2014 02.
What all this is telling us is that while progress has been made, there is still a way to go — with many landmines along the way — before anyone can claim victory in restoring the federal budget to robust balance. Let alone surplus.
One striking feature of the budget, which remains very much intact I MYEFO, is the extent to which the attempt to balance the budget relies on growth in tax revenue from explicit tax increases (such as the bank tax and the Medicare levy increase) and automatic revenue growth including personal income tax bracket creep. Receipts are set to rise from 23.3% of GDP in 2016-17 to 25.4% in 2020-21 while payments remain at 25%.
Since the deficit blow-out of 2007 to 2010, we have not seen a strong and sustained curtailment of government expenditure through savings measures as we saw in response to similar deficits in the 1980s and 1990s. This has been due to a combination of inadequate savings being put forward by government and Senate opposition to those that have been put forward. At the same time, the savings that have occurred have been offset by expensive new programs such as the NDIS. If a more concerted savings program had reduced expenditure to, say, 24% of GDP instead of 25%, we would be $18 billion closer to that structurally robust, balanced budget today.
Robert Carling is a Senior Fellow at the Centre for Independent Studies
The federal budget is still in a fragile state