
Introduction
The coronavirus pandemic’s economic fallout includes the fiscal cost as measured by budget deficits and the growth of public debt — as federal and state governments matched their public health restrictions with massive economic support and stimulus. Much attention has since been given to the implications for the state of the economy, inflation and the sustainability of the public finances.
This report provides an update of the public debt situation and outlook based on the latest available official estimates as published in the various governments’ 2023/24 budget mid-year reviews.
In the three peak years of the pandemic’s fiscal impact, the combined cash deficits of federal and state governments totalled $402 billion compared with $13 billion in the last pre-pandemic year of 2018/19. In those three years, the stock of borrowings and loans mushroomed by a little over $400 billion.[1]
This took gross general government debt from 40% of GDP at the end of 2018/19 to a peak of 57.5% at the end of 2020/21. It has gone back down to an estimated 48.5% at the end of 2023/24.
As large as that increase appears, in the 2020 depths of the pandemic gloom this aggregate was expected to reach 80% by 2023/24. Therefore, while on the face of it, debt has increased, it is a massive 31 percentage points of GDP lower than had been feared three years ago.
This is undoubtedly a ‘good news’ story, but one subject to qualifications. A full assessment requires us to look at:
- Where the level of debt has come from and is heading over the longer term;
- How the massive downward revision to the current level of debt came about;
- Measurement technicalities that mean the current level of debt isn’t really as low as it appears;
- The varying situations of different governments within Australia; and
- The implications of interest rates that have risen much further than expected.
This report sets out the latest data and projections for the federal and state governments combined and separately, and for each state government, and discusses the issues of interpretation as listed above.
It adopts the common practice of including the two territory governments as ‘state’ governments for ease of reference.
What is the national debt?
Although the term ‘national debt’ is often used, there is no single definition, and it means different things to different people.
The list of definitional issues includes the following:
- Whose debt? The word ‘national’ could imply everyone’s in the public and private sectors, but there are different criteria for the two sectors and most often ‘national’ means ‘public sector’. But importantly, in a multi-tiered public sector it is not only the debt of the central (federal) government that matters but also that of the states and even local government — though in practice local government debt is immaterial in Australia. In view of the significance of state debt, it must be included in a complete assessment of national debt.
- Is the public sector only the general government sector (comprising the core tax-funded government agencies) or the broader public sector including government trading enterprises (what is clumsily called the ‘non-financial public sector’). In practice, both definitions are used at different times. The trading enterprises are meant to be financially separate from government, but ultimately government as the owner is responsible for their financial viability.
- Is debt gross or net of the financial assets of government? Again, both measures are used at different times, but the ‘net’ measure has the disadvantage that the liquidity of the financial assets included in the calculation of net debt is not always transparent. For this reason, gross measures of debt should be given at least as much attention as the net measures.
- Is debt measured at variable market value (calculated at current bond yields rather than the coupon rates at which they were issued) or face value (which is fixed at the time of issue)? Nowadays, governments follow accounting standards that require market values to be used in their financial accounts, but as discussed below it is not clear that this is the most relevant measure for governments. Even if the main focus is on market value because most of the data are produced on that basis, we should also have regard to face value where it is significantly different (as it is now).
- Is debt only narrowly defined as borrowings by government, or does it include other financial liabilities broadly defined? It is legitimate to focus on borrowings as a particular type of financial liability with unique characteristics, but we should always be mindful that government balance sheets include a broader set of financial liabilities such as unfunded public sector superannuation scheme liabilities.
- Absolute dollar amounts, or relative to a base — such as GDP or revenue — to put the dollar amounts into perspective? While the absolute dollar amounts are the starting point, they need to be put into perspective by relating them to governments’ capacity to service debt. While GDP is most often used as the base, particularly in international comparisons, revenue is a superior measure of the capacity to service debt and is in fact used by credit rating agencies and some state governments.
The following focuses on the public sector, including the federal and state governments —combined and separately. Recognising the range of measures of debt in common usage, in this report we provide an assortment of measures, while preferring non-financial public sector gross debt as a percentage of revenue as the most meaningful measure.
The national debt situation and outlook at the end of 2023
The data on public debt are constantly changing, but we get two key snapshots every year: the estimates based on annual budgets typically handed down in May/June; and the mid-year reviews typically released in November/December. This report is based mainly on the latter.[2] Thus, at the time of writing, data on actual debt are available up to June 2023, while budget estimates for June 2024 and forward estimates up to June 2027 are available from 2023/24 budgets and revised estimates are available from the mid-year budget reviews of most governments.
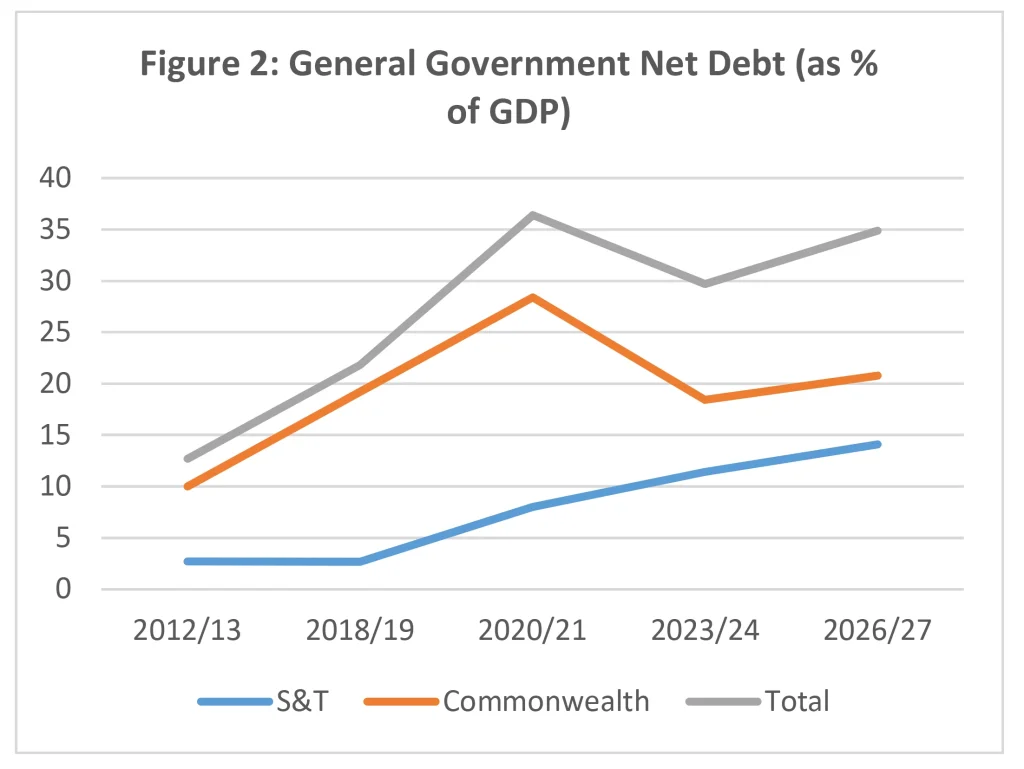
Figures 1 and 2 show gross debt of the general government sector and the broader non-financial public sector as proportions of GDP since 2012/13 and its federal and state components. It is important to observe that the debt burden had been increasing before the impact of the pandemic — indeed, not just since 2012/13, but since 2007/08 when, for example, the broader measure was only 15% of GDP and net debt was negative.
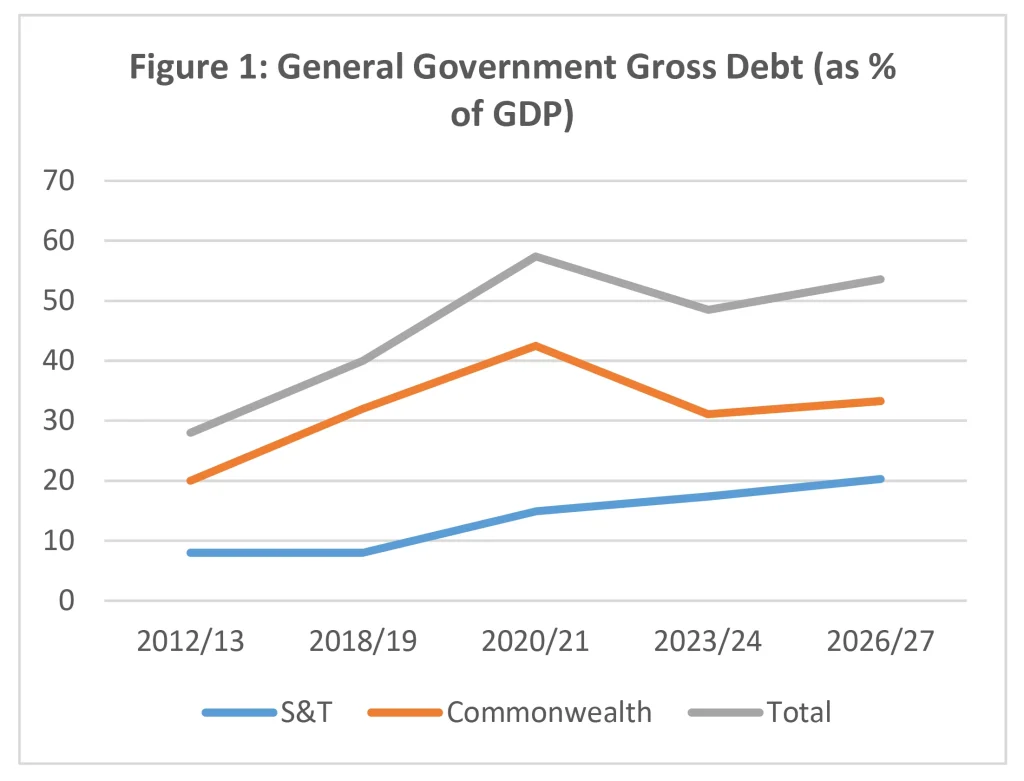
However, if for present purposes we take 2018/19 as the starting point (as it was the last complete fiscal year before the pandemic), the picture is one of the debt burden increasing sharply in the two years to 2020/21 and then declining to 2023/24 before resuming its upward path to 2026/27 albeit gradually.
As shown in Figures 1 and 3, general government gross debt increased from 40.2% of GDP to 57.5% in the two years to 2020/21 and non-financial public sector gross debt from 45.4% to 62.7%. Although debt had been increasing before the pandemic, these increases in two years approximated those of the preceding 10 years. However, these measures of debt then actually fell in the next two years to 2022/23 before edging up again on the latest estimates for 2023/24 and beyond.
However, on all measures and in all of these years, debt is — or will be — substantially lower than was expected when assessments of the economic and fiscal outlook were at their bleakest in 2020. While there is no doubt that the economic and fiscal disruption of the pandemic led to an upsurge in public debt, the impact does not now appear to be on the scale outlined in earlier assessments.
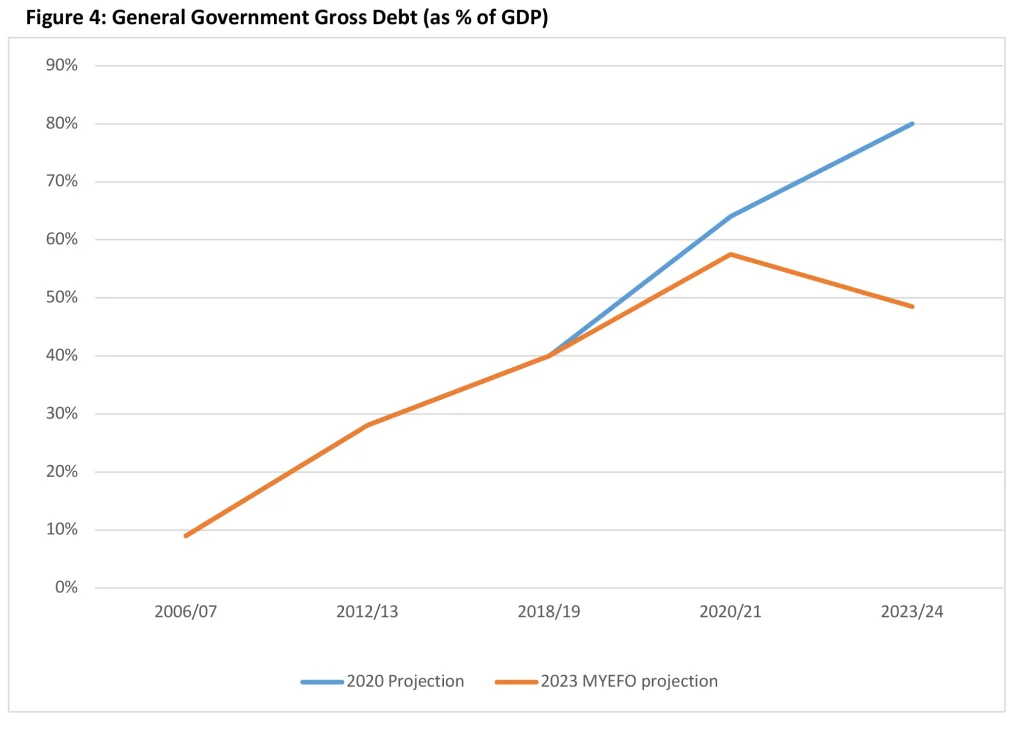
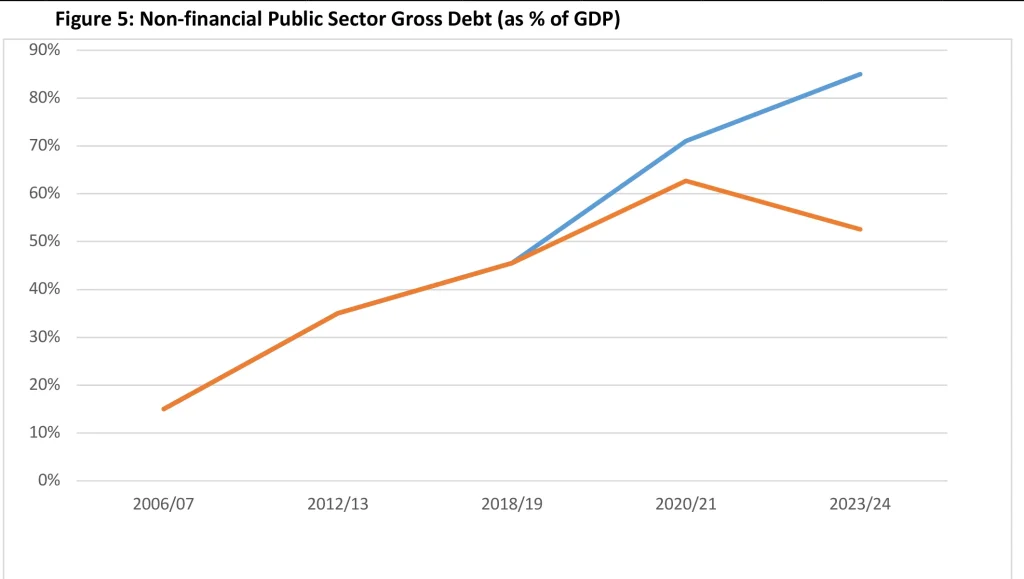
Figures 3 and 4 illustrate this point by comparing general government and non-financial public sector gross debt as currently estimated with the estimates drawn from the mid-year budget reviews as at early 2021, when the forward estimates only stretched to 2023/24.
As can be seen, whereas in early 2021 the general government measure was thought to be headed for 80% of GDP and the broader measure for 85%, the current assessment is that they will be 48.5% and 52.5% respectively in the same year. These are huge downward revisions. So, what has happened to what previous iterations of this report have called the debt ‘iceberg’?[3]
The variables behind these results play out differently at the federal and state levels, but in broad terms they are as follows:
- The post-lockdown economic rebound has been much stronger, both in real (inflation-adjusted) and nominal (inflation-included) terms than most economists expected. This has strongly boosted nominal GDP, which is the denominator in debt/GDP measures of the debt burden. Thus, even if the dollar magnitudes of debt had not been revised down, they would have been revised down as a percentage of GDP.
- As a result of the strong economic rebound and the ‘stronger for longer’ profile of commodity export prices (particularly iron ore and coal), government revenues have been much higher than expected — especially for the federal, Queensland and WA governments. Therefore, deficits and the resulting additions to debt have been much smaller than expected. In fact, those three governments reported surpluses in 2022/23 and may do so again in 2023/24.
- Debt is usually reported in government accounts at market value. The increase in interest rates, while adding to public debt interest costs, has lowered the market value of legacy debt. Thus, whereas holders of public debt have seen the value (price) of their asset decline as market yields have risen, governments as issuers of debt have seen the market value of their liability decline. However, this benefit will not endure if interest rates go back down or as governments have to refinance the debt as it matures. The reality is that whatever has happened to market value, face value has increased by more. This issue is discussed further in Box 1.
- These favourable effects on debt from the economic rebound, strong revenue growth and the effect of higher interest rates on the market value of debt have masked the impact of government spending rising faster than expected. For example, Commonwealth budget payments in the three years to 2023-24 are now estimated to be $202 billion higher than estimated for those years in the 2020-21 budget, offsetting almost half the very large upward revision of tax revenue for the same years. Across all governments, a recent survey of major infrastructure projects found that capital costs, spread over a number of years, have blown out by $90 billion, much of this being at the state [4]
How an accounting technicality has changed the profile of debt
One of the first things Finance 101 students learn is that as bond yields rise (fall), bond prices fall (rise). As it happens, this truism has had major implications for the measurement of public debt at a time of pronounced yield volatility since 2018.
From hovering a little below 3% in 2018, the yield on 10-year Commonwealth bonds (as a prominent example) crashed to below 1% through 2019 and 2020, then spent three years clawing — and at times leaping — its way back to a peak of 5% in late 2023.
Ever since federal and state governments embraced accounting principles similar to those used by companies, they have recorded debt at its mark-to-market value on their balance sheets. This means that when yields drop below the levels at which bonds were issued in the past — as they did in 2019 and 2020 — the market value of debt goes up above the face value (abstracting from other concurrent determinants of the stock of debt). And when yields go back up — as they did in 2021-2023 — the market value goes back down and eventually drops below face value.
This is exactly what has happened over the past five years. State accounts do not provide face-value information, but fortunately the federal accounts do, enabling us to compare in Figure 6 movements in the market value and face value of federal government securities on issue since 2018/19.
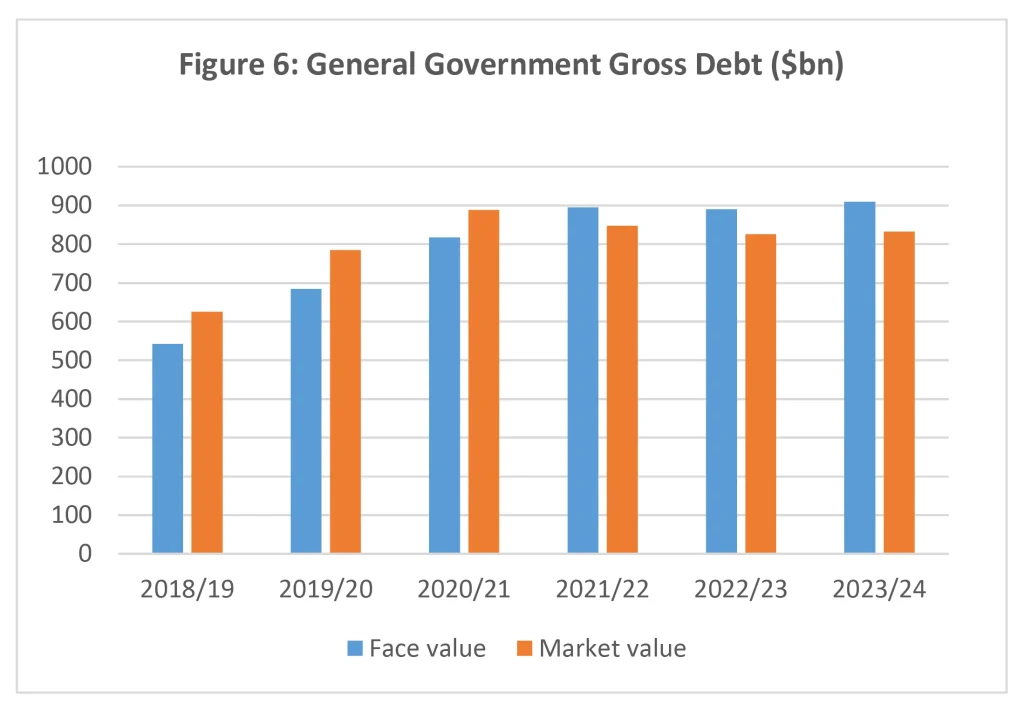
Market value was above face value up to 2020/21 but then dropped more steeply to below face value in the next three years as yields increased. Thus, market value was $100 billion above face value in 2020/21 but $77 billion below face value in 2023/24.
Market values below face value are only relevant to government if there is a real possibility that they will crystallise the gain by repurchasing debt. This has not happened since the late 1980s and is very unlikely in current fiscal circumstances. All outstanding debt is likely to remain on issue until it matures, at which point it will be refinanced. Arguably, market value data are currently understating federal debt by about 3% of GDP. The message for anyone interested in public debt is that the face value should at the very least be used to put the market value data into perspective.
To be fair, the federal budget and mid-year review papers do not hide the discrepancy between market and face value, and draw attention to the face value figures. The same cannot be said of the states, whose financial reporting does not include face value information.
A closer look at federal debt
Federal debt has been increasing since the Global Financial Crisis of 2008/09. It stabilised briefly when the budget was finally balanced in 2018/19 but was then driven up again by the fiscal shock of the coronavirus pandemic.
The largest — but by no means only — element of this was the cost of the JobKeeper scheme. Though very large, these costs turned out to be less than originally expected.
Together with the unexpectedly rapid economic rebound from lockdowns and durability of elevated commodity export prices (particularly iron ore and coal), this led to large downward revisions of budget deficits and even one surplus. Deficits that in 2020 were expected to total $500 billion in the four years from 2019/20 turned out to be $230 billion. The surprise surplus of $22 billion in 2022/23 helped this outcome, but still only offsetting one dollar in eleven of the deficits in the preceding three years. The smaller than expected deficits over the four years were the main contributor to debt rising much less than expected.
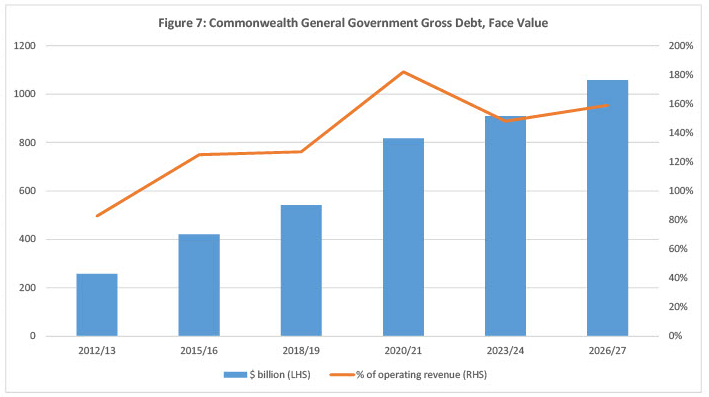
In market value terms, the increase in gross debt was from 32% to 43% of GDP in the two years to 2020/21 before rising bond yields had the effect of cutting market value back to 31% in 2023/24. Remarkably, at this level, gross debt is lower than it was in 2018/19. The same is true of net debt. It is as if the massive pandemic-related fiscal costs never happened. However, the face value of gross federal debt has still increased by $367 billion in the five years to 2023/24, or from 27.8% of GDP to 34.0%, which is far higher than the pre-pandemic level in any year going back at least to 1970.
Moreover, the latest estimates point to debt rising further in the years to 2026/27 — by $149 billion for face value debt and a larger $165 billion for market value debt as the favourable valuation effect gradually unwinds. As a proportion of GDP, both measures of gross debt are estimated to rise, but remain below the 2020/21 peaks.
Federal gross debt at face value and as a proportion of operating revenue are shown in Figure 7 and display a similar pattern over time.
The expected resumption of growth in debt after 2023/24 brings attention back to the underlying drivers of fiscal conditions that were overwhelmed by the large and temporary impacts of the pandemic. The 2023/24 Budget envisaged a return to budget deficits, as the boom in tax revenue came to an end and budget expenditures resumed real growth driven particularly by programs such as the NDIS, aged care, health, childcare, defence equipment and public debt interest. The exact timing of these developments remains uncertain and there are indications that the budget outcome for 2023/24 may be better than estimated. However, a return to deficit seems highly likely even if it is delayed beyond 2023/24.
Projections beyond the 2023/24 Budget estimates suggest that debt as a proportion of GDP will peak in the next few years and then begin a gentle decline. For example, the Parliamentary Budget Office (PBO) projects a decline in gross debt from a peak of around 36.5% of GDP to 31.4% by 2033/34.[5] This is based on the expectation that the budget deficit will gradually close. There are clearly many uncertainties in a 10-year outlook.
The latest Intergenerational Report (IGR) released by the Treasury in August 2023 peers even further into the future, to the early 2060s.[6] Like the PBO, the Treasury expects debt to peak within the next few years and then decline. With its long-range view, the IGR envisages a decline continuing until the late 2040s before debt starts to rise again under the weight of increasing deficits.
Needless to say, these long-range projections are subject to enormous uncertainty — and the past is a guide to how wrong they can turn out to be. For example, the first IGR in 2002 projected that 20 years later net debt would be substantially negative — that is, the financial assets counted in the calculation of net debt would exceed gross debt. That did come to pass a few years later, but then net debt started to rise and continued doing so right up to 2020/21 — by which time it was in fact plus 28.4% of GDP rather than negative. What went wrong was the Global Financial Crisis, the coronavirus pandemic and a great deal of government policy change; real world events that upset the neatness of long-term modelling.
As another telling example, the 2012/13 federal Budget predicted 11 consecutive years of budget surpluses and net debt declining into negative territory by 2020/21. In reality, there were no surpluses and net debt increased from 9% of GDP in 2012/13 to 28.4% in 2020/21. Again, the pandemic was a contributing factor, but the budget went off the rails soon after the 2012/13 Budget was released, and net debt increased year after year even before the pandemic struck.
Given the discouraging track record and the uncertainties ahead, we can only hope the latest projections of debt being on the cusp of a long period of decline prove more accurate, while remaining alert to the many possible events that could derail them. Governments will need to be better at avoiding the temptations of policies that push debt up, while responding to the inevitable adverse exogenous shocks. But will they be better?
Although there is some comfort from the downward revisions of federal debt over recent budgets and mid-year budget reviews and the improved medium and long-term profiles, it is also important to understand how the improvement has come about.
One dimension of the improvement is that tax revenue has boomed and is at much higher levels (in dollar terms but also relative to GDP) than before the pandemic. This has more than offset growth of government spending which — although easing back since the pandemic — continues at higher levels (relative to GDP) than before it. Having tax revenue expand even more than government spending is expanding certainly helps the budget deficit, but it also brings with it bigger government and a higher tax burden, neither of which helps the cause of a vibrant economy underpinned by stronger productivity growth.
Another dimension of the improvement is that it has been assisted by inflation. When debt drops as a percentage of GDP, it is not necessarily because the absolute dollar amount of debt is dropping but because GDP is growing faster than debt. In the two years following 2020/21, nominal GDP increased by an average of more than 10% a year — which is highly unusual — with the GDP deflator (a broad measure of inflation) averaging a peak increase of more than 7% over two years.
It has often been said that the economic burden of the debt run up during the pandemic would be eroded over time by growth and inflation, but the process was not expected to start so soon or be so strong. While the inflation may have helped ease one problem (the debt burden) it has created others; and its continuance is not something governments can welcome or rely upon.
A closer look at state and territory debt
The developments discussed above leading to better than expected outcomes for federal debt have not worked as favourably for the states in aggregate. Some of the key drivers of state finances over the past five years have been the following:
- While the federal government bore the lion’s share of the one-off budgetary costs of the pandemic — which made the states all the more eager to maintain restrictions — the states did bear some of the cost, particularly NSW and Victoria. For example, the cost to NSW over four years was around $28 [7]
- State budgets are less sensitive to the economic cycle and have benefited less from the post-pandemic strengthening of tax revenue. However, QLD and WA as the most mineral-rich states have benefited massively from higher royalties; in the case of QLD, super-charged by a large increase in coal royalty rates.
- Underlying growth of expenditure was strong in some states (particularly VIC and QLD) even before the pandemic and this has continued. As large employers, they are now experiencing the fiscal costs of larger wage increases, which in some cases they have encouraged.
- At the same time, the states carry the lion’s share of infrastructure spending, and some (particularly NSW and VIC) have been on an infrastructure binge for some years and have experienced large cost blow-outs.
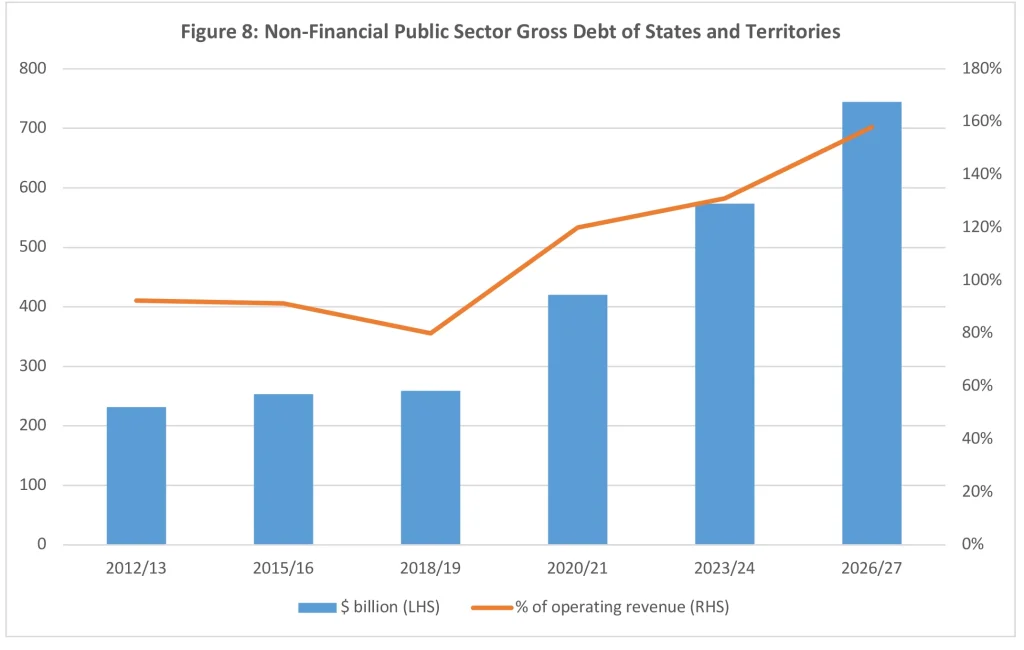
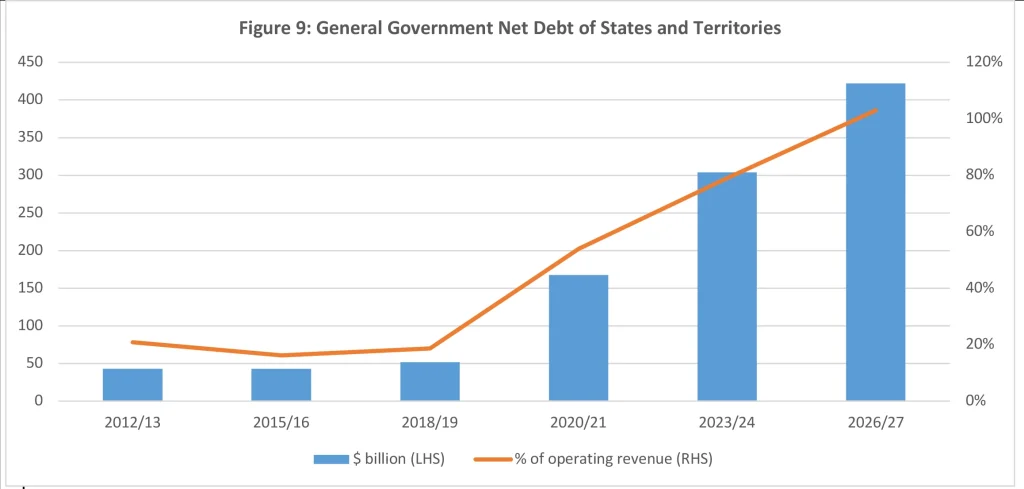
These factors play out differently in each state — as discussed below — but if we focus first on the state aggregates, we see that current estimates for debt at June 2024 are about $70 billion lower than the estimate in early 2021. This still leaves them with about $465 billion of general government gross debt and $575 billion of non-financial public sector gross debt. These represent increases of a little above $300 billion since June 2019. As a proportion of GDP, state general government gross debt has more than doubled to 17.4% and non-financial public sector gross debt has risen from 13.3% to 21.4%
The states and territories account for more than half the increase in total national public debt since before the pandemic. Although the level of federal debt is still much larger, the states’ share of the total has risen from around 30% in 2019 to 40% now and is set to increase further over the next three years. General government gross debt is projected to reach 20% of GDP by 2026/27 and non-financial public sector gross debt 25%.
One important ‘other’ factor has been a ramp-up in major infrastructure projects and blow-outs in the cost of those projects, but there has also been a pick-up in the rate of increase in operating expenses.
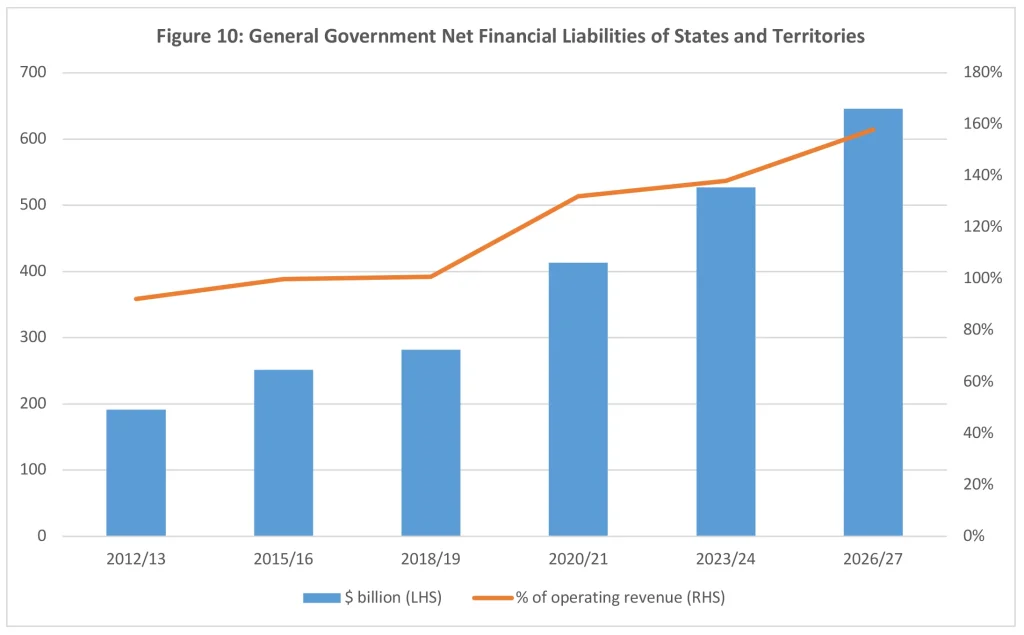
Figures 7–9 show three measures of state debt in dollar terms and as a percentage of revenue. Clearly the increase from 2018/19 to 2023/24 is very large and there has been a substantial weakening of the aggregate state fiscal position from its relative strength up to the middle of the last decade.
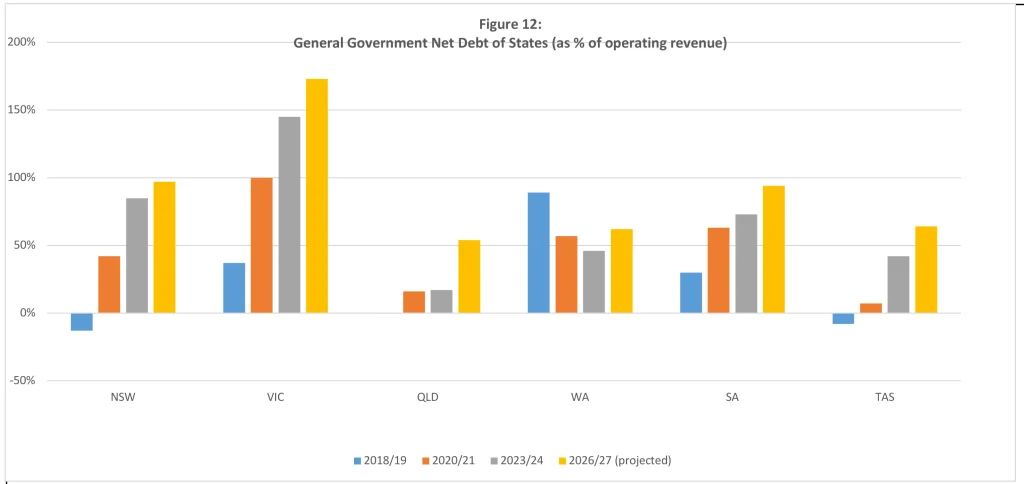
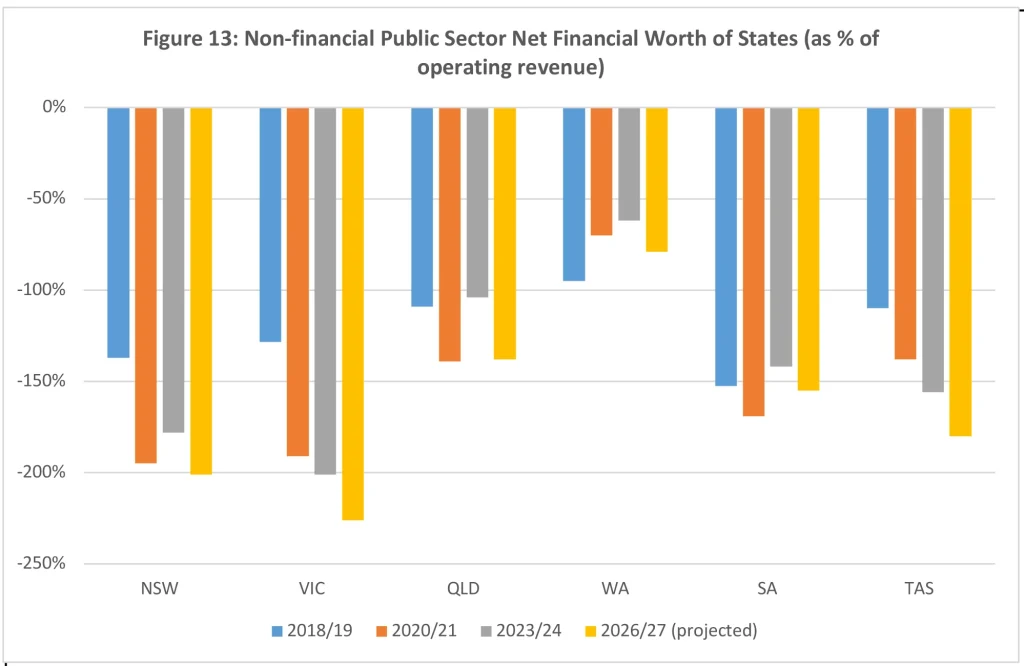
However, these aggregates conceal significant differences among the states. Figures 10–12 show trends in several measures of debt for each state. Although there have been some influences in common among the states, there is more that distinguishes them; each has its own story to be told.
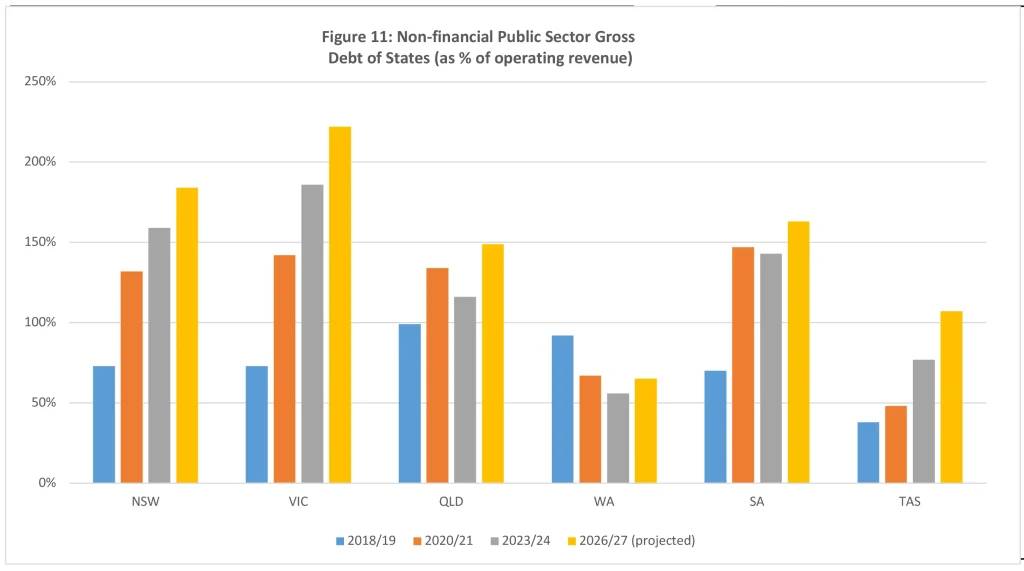
The ranking of states and territories in 2034/24 from highest to lowest according to a broad measure of debt — non-financial public sector gross debt as a percentage of revenue — is as follows with the 2018/19 positions and the 2026/27 projections shown for comparison:
Table 1: Non-Financial Public Sector Gross Debt (as % of Revenue). States and territories
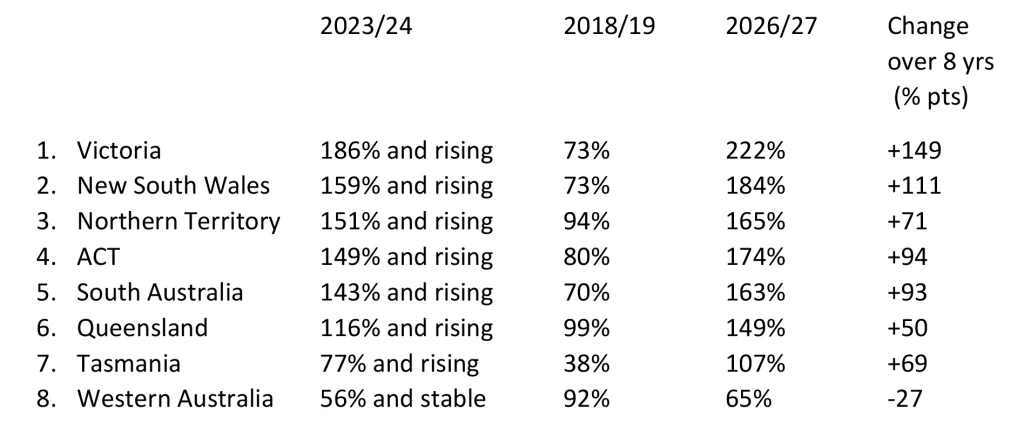
Clearly, while the overall state public sector debt ratio is 130% in 2023/24, there is a wide range from 56% in WA to 186% in VIC. A detailed analysis of the situation in each state is beyond the scope of this paper, but some comments on broad trends follow.
Victoria
Victoria warrants the closest attention because of its position at the top of the debt burden ranking. Victoria’s debt ratios were broadly stable until 2019 but have soared since then and are set to rise further. The result is the largest increase to the highest level of any state or territory. The state’s credit rating has been reduced from triple-A to the lowest level of all the states and territories, although it is still investment grade at double-A.
General government operating expenses were growing strongly even before the pandemic, underpinned by the highest rates of increase in public sector employment and payroll among all the states. One-off outlays during the pandemic pushed expenses to exceptionally high levels. Although some moderation is budgeted in 2023/24 and beyond, expenses will remain above the rapid pre-pandemic growth trend line.
Infrastructure spending was at moderate levels up to 2016/17 but then expanded rapidly. In the five years to 2021/22 it was more than double the level of the previous five years and another 50% increase is planned for the next five years to 2026/27. Projects have been plagued by cost blow-outs.
Strong growth of tax revenue up to 2018/19 helped keep debt contained up to then. After a pause during the pandemic, strong revenue growth has returned in the post-pandemic recovery — further boosted by a series of state tax increases — but still falls well short of inflated expenditure, resulting in non-financial public sector gross debt increasing from $54 billion in 2018/19 to $187 billion in 2023/24 and a projected $246 billion three years later.
New South Wales
The largest state’s finances were well-managed before the pandemic, but have been derailed by the combination of a huge increase in infrastructure spending (with large cost over-runs), large one-off pandemic-related expenses and a pick-up in the underlying growth of operating expenses. The newly elected government’s abandonment of the previous government’s public sector wage growth caps poses an additional risk to future budgets.
The situation is not as dire as in Victoria, but the combination of factors has catapulted NSW from its position as one of the least indebted states to the second highest, and this dubious distinction is expected to be preserved over the next few years. The state’s large and diverse economy strengthens debt servicing capacity, but it has still experienced one credit rating downgrade from triple-A.
The territories
The ACT and the NT are small, and their finances do not attract much attention, but it is of interest to note that they are the third and fourth most heavily-indebted jurisdictions. This distinction is not new for the NT, but it is a recent development for the ACT, which has now been stripped of its long-held triple-A credit rating. Both operating and infrastructure expenditure has been increasing rapidly in the ACT.
Queensland and Western Australia
These two resource-rich states have been the beneficiaries of a surge in revenues in recent years which has put their budgets substantially into surplus and left their debt burdens below average — in WA’s case markedly so. However, there are key differences.
QLD abandoned its tradition of strong fiscal discipline more than a decade ago, as Labor governments ramped up both operating and infrastructure spending. The state lost its long-held triple-A credit rating in 2012. As shown in the ranking above, that legacy was reflected in its debt ratio being the highest of any state in 2018/19. However, the increase since then has been relatively modest despite pandemic-related costs. This owes much to a hefty increase in coal royalty rates as well as abnormally-high coal export prices, which pushed QLD into large surpluses in 2021/22 and 2022/23.
As coal prices recede, the surplus is expected to disappear and the state’s finances will again be driven by fundamentals such as strong underlying growth in expenditure, with debt increasing more rapidly over the next few years.
Expenditure growth has also been strong in WA, but the state has benefited from sustained high iron ore volumes and prices feeding into royalty revenue. Remarkably, total revenue increased by 25% in one year, 2020/21, and has not dropped back. WA would normally see some of the royalty revenue surge offset by losses of GST revenue to other states through horizontal fiscal equalisation arrangements, but it is now protected by the special arrangements put in place by the previous federal government to put a floor under WA’s GST revenue share. A partial return to normality, with a return to overall deficits and some increase in debt, is expected on the assumption that iron ore royalties recede, but even under this scenario WA’s debt burden will remain well below the other states.
South Australia and Tasmania
The smallest two states have been chronic fiscal underperformers. The larger deterioration in other states in recent years has actually improved the ranking of SA and TAS, but this does not alter their underlying weakness. Successive SA governments have been alert to this and have made attempts to turn this situation around while trimming some of the state’s high taxes. Success so far has been limited and the debt burden, while in the middle of the pack, remains a little above average.
TAS’s debt ratios are not especially high but are on a steeply rising trend. Its other financial liabilities, such as unfunded superannuation, are very high resulting in above-average net financial liabilities and negative net financial worth.
As a small economy lacking diversification, TAS is not well-placed to manage adverse shocks and for that reason needs low debt. It is heavily dependent on federal grants and on the willingness of federal governments to maintain those grants at a high level.
The debt interest burden
The sustainability of a given amount of public debt depends on the interest rates at which it has to be serviced. The historically low bond yields of 2019 and 2020 made large increments to the stock of debt appear more prudent than they do at the much higher bond yields of today and in all likelihood of the foreseeable future.
The interest burden (measured by general government gross debt interest as a percentage of revenue) as estimated for this year and 2026/27 is compared with 10 years ago in this table for the federal government and the three largest states:
Table 2: General Government Gross Debt Interest as % of Revenue
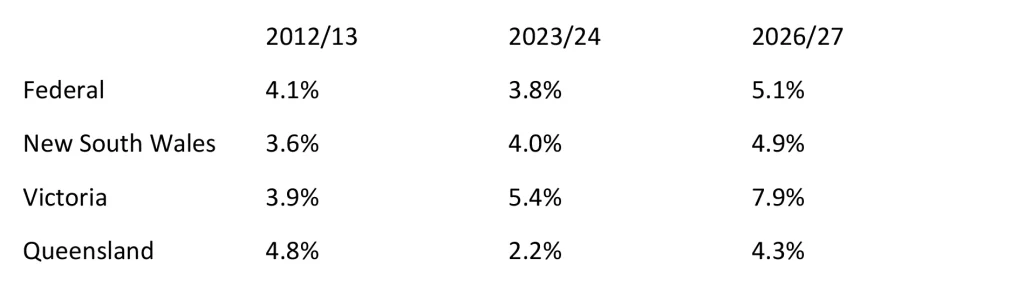
There is no clear-cut dividing line between what is prudent and imprudent, but the level and trend of the figures for Victoria raise concerns.
Those who argue that Australia’s public debt service burden is sustainable will point to higher figures in other jurisdictions. In the US, for example, debt interest is around 15% of revenue. However, no other country’s experience can be directly superimposed on the circumstances of Australia, let alone of one state.
Conclusion
Although deficits and debt nationally have been revised down since the peak gloom of 2020, it remains the fact that public debt has risen substantially since the start of the pandemic — sustaining the upward trend since 2008 — and some further increases are in prospect. The most widely available market-value data understate the more meaningful increase at face value.
The situation varies between the federal government and the states, as well as among the states. The federal government initially had the largest deficits and increase in debt, but these have moderated as a result of a surge in tax revenue.
State debt has continued to increase, driven by ballooning expenditure, and is projected to rise further. Among the states, however, Queensland and Western Australia have benefited from burgeoning mining royalties while NSW and Victoria have seen their debt burdens soar to the highest and second-highest levels respectively and expect further increases.
The main purpose of this report is to update the data rather than to make judgements about fiscal sustainability. Most assessments independent of government appear to be that current levels of debt are sustainable. However, the increase since the pandemic — and the increases before that — have eroded the fiscal buffers available to absorb the impact of any future crises affecting budgets.
Moreover, it is one thing to accept that current debt levels are sustainable, but another to accept that future levels will not spiral to unsustainable levels in the absence of policies to restrain government spending and balance budgets. While forward estimates seek to assure that spending growth will moderate, it is difficult to foresee the changes in political behaviour that will bring about such restraint.
This is the real concern — that there is no fiscal framework or plan in place to stop the continued growth of debt.
Endnotes
1. Sourced from Australian Bureau of Statistics, Government Finance Statistics, Australia, 2021/22, Cat No 5512.0.
2. At the time of completion of this report, mid-year budget reviews were available from all governments except Tasmania and the ACT.
3. Robert Carling, “The Looming Iceberg: Australia’s Post-pandemic Debt Risk”, CIS Policy Paper 35 (January 2021) and “A Sea of Red: Tracking Australia’s Debt Iceberg”, CIS Policy Paper 45 (March 2022).
4. The Australian,”Rising costs threaten government plans: $90 billion infrastructure blowout”, August 14, 2023, p 13.
5. Parliamentary Budget Office, “Beyond the Budget 2023-24: Fiscal outlook and sustainability”, 2023.
6. Intergenerational Report 2023: Australia’s Future to 2063, Australian Government Treasury, August 2023.
7. Tyson Goddard, “The Structural Budget Balance of New South Wales”, TRP 23-26, NSW Treasury, December 2023.
Data Sources
1. Commonwealth of Australia, 2023-24 Mid-Year Economic and Fiscal Outlook. https://budget.gov.au/2023-24/content/myefo/index.htm
2. Government Finance Statistics, Australia, 2021-22, Australian Bureau of Statistics, Cat No 5512.0.
State Budgets
1. NSW Budget 2023-24 Half-Yearly Review. NSW Treasury. https://www.budget.nsw.gov.au/sites/default/files/2023-24/2023-24_Half-Yearly-Budget-Review-Full-Report.pdf
2. Victorian Budget Update 2023-24. Department of Treasury and Finance (Victoria). https://www.dtf.vic.gov.au/sites/default/files/document/2023-24%20Budget%20Update.pdf
3. Queensland Budget Mid-Year Review 2023-24. Queensland Treasury. https://budget.qld.gov.au/files/2023-24_Budget%20Update.pdf
4. South Australia Mid-Year Budget Review 2023-24. Department of Treasury and Finance (South Australia). https://www.statebudget.sa.gov.au/budget-papers/Mid-Year-Budget-Review-2023-24.pdf
5. Western Australia 2023-24 Government Mid-Year Financial Projections Statement. Department of Treasury WA. https://www.wa.gov.au/system/files/2023-24/2023-24-government-mid-year-financial-projections-statements.pdf
6. 2023-24 Tasmanian Budget. Department of Treasury and Finance (Tasmania). https://www.treasury.tas.gov.au/budget-and-financial-management/2023-24-tasmanian-budget.
7. NT Budget 2023-24 Mid-Year Report. Department of Treasury and Finance NT. https://treasury.nt.gov.au/__data/assets/pdf_file/0016/1072420/2023-24-Mid-Year-Report.pdf
8. ACT 2023-24 Budget Outlook. https://www.treasury.act.gov.au/__data/assets/pdf_file/0008/1870136/2021-22-ACT-Budget-Outlook.pdf