
Executive summary
Much of the commentary surrounding the Coalition government’s three-stage Personal Income Tax Plan (PITP) — as originally legislated in 2018 and embellished in 2019 — has focused on the magnitude of the Stage 3 tranche of tax cuts intended to commence on 1 July this year. Some commentators have questioned their affordability, while others point to the large differences in the dollar value of the tax cuts at high incomes compared with those for lower income earners.
However, this commentary typically fails to acknowledge the effective tax increases paid by all taxpayers through bracket creep, which is a constant force; increasing tax rates in Australia’s progressive personal income tax system. Critics of Stage 3 also typically fail to recognise the tax relief that low- and middle-income taxpayers received in Stages 1 and 2 of the PITP or the relativity of the dollar amounts of the Stage 3 tax cuts to the total amounts of tax higher income earners pay.
To assert it is unfair for higher income earners to receive larger tax cuts under Stage 3 than lower income earners, in absolute dollar terms, is to ignore that those on higher incomes have paid far more tax because of bracket creep than low- and middle-income earners.
The neutral benchmark for tax policy comparisons is not unchanged thresholds and marginal rates year after year — which would lead to ever-increasing average tax rates for all — but a tax scale with thresholds indexed annually for inflation.
On this basis, the ‘cost’ (reduction in tax revenue) of the Stage 3 tax cuts over the nine years from 2024-25 was never the $240 billion calculated by the Parliamentary Budget Office for the Australian Greens, but around $39.7 billion or $4.4 billion a year.
The use of an indexed tax scale as a benchmark also puts the distribution of tax cuts into perspective. Sensible judgements cannot be based on any single year’s outcome, but require analysis of the cumulative offsetting impacts of bracket creep and discretionary tax changes at different levels of real taxable income over a series of years.
When this is done using 2017-18 as the benchmark tax policy (the year before implementation of the PITP began) and up to 2024-25, we see that those on taxable incomes of roughly $50,000 to $224,000 (in $2024-25 terms) would have received tax cuts larger than bracket creep over those seven years under the Coalition’s PITP, while those below and above that range would have been undercompensated. The current government’s revision of the PITP lowers the range of over-compensation to around $48,000-$214,000, and mostly reduces the under-compensation below that range and increases under-compensation above it.
However, there is nothing special about 2017-18 as a benchmark against which to measure subsequent tax policy. An arguably more meaningful benchmark is 2010-11, which was the last year of major tax cuts and the last year in which high income earners received significant tax cuts before the three-stage PITP. The striking result is that all taxpayers above around $35,000 in 2024-25 terms would have been under-compensated for bracket creep over the 14 years from 2011-12 to 2024-25 even under the Coalition’s PITP. (Those below $35,000 were mostly over-compensated owing to a very large increase in the tax-free threshold in 2012.) The under-compensation would be largest as a percentage of taxable income at high incomes above about $220,000.
The current government’s revision of Stage 3 increases the degree of under-compensation at high incomes, but makes little difference at low and middle incomes because the redistributed dollar tax cuts are spread thinly; amounting for example to only $15 a week at and above $45,000 and less below $45,000.
The point here is not that 2010-11 or 2017-18 tax policy settings are necessarily the final word on tax policy. Rather, it is that — regardless of the level of one’s taxable income — the tax cuts received by a taxpayer in a single financial year need to be viewed in the context of the additional tax payments they have made as a result of bracket creep.
On this view, the denial of some of the tax relief to higher income earners in the revision of Stage 3 is unwarranted, as that group would have been under-compensated for bracket creep even under the Coalition’s original plan. The assertion that these taxpayers stood to gain $9,000 in 2024-25 — though broadly correct — tells us nothing about their cumulative tax burden, considering the bracket creep they have paid in preceding years.
If the argument against the original Stage 3 tax cuts is that high income earners benefit more in absolute dollar terms than those with lower incomes, this is tantamount to asserting there is some income level above which certain taxpayers should never receive compensation for bracket creep and be subject to increasing average tax rates in perpetuity.
If tax thresholds were indexed to the CPI, the tax liability of high-income earners as well as others would be fixed in real terms until the government legislated a change in tax policy. This would provide transparency for all taxpayers, and avoid the inane recurring debate about whether it is fair that high income earners receive larger dollar tax cuts than low-income earners while ignoring the fact that high earners carry most of the income tax burden.
1. Introduction
The previous Coalition government’s Stage 3 income tax cuts have been mired in controversy ever since they were announced — in their final form — in 2019. The controversy culminated in the current Labor government’s announcement in January 2024 to reconfigure the tax cuts, while largely retaining their overall magnitude, six months before they were finally to be implemented.
While the current government’s action — and the easy passage of the enabling legislation with the opposition’s reluctant support — are likely to put the matter to bed for a time, the tax cuts raise systemic issues that have not been resolved.
The essential issue addressed in this report is income tax bracket creep — how it is measured and how we should evaluate the discretionary tax cuts offered as an offset to bracket creep. This puts the Stage 3 discretionary tax cuts squarely in the framework of ongoing bracket creep. Of particular interest is the distribution of tax cuts by income level; considering the assertion often heard that the larger absolute tax cuts under Stage 3 at higher incomes were inequitable.
We explain the difference between marginal and average income tax rates in section 2, while section 3 outlines how bracket creep automatically lifts average tax rates and most affects those with the lowest taxable incomes — often the youngest taxpayers. Section 4 covers the methodological approach of the paper. Sections 5 and 6 use this method to explore the extent to which the original Stage 3 tax cuts compensate for bracket creep since two reference years: 2017-18, which is the year preceding implementation of the Stage 1 cut; and 2010-11, which was the year in which the last comparable series of major tax cuts was fully implemented.
Section 7 discusses the implications of the Stage 3 tax cuts for progressivity of the personal income tax scale and section 8 then examines how the current government’s reconfiguration of the tax cuts has changed the extent of compensation for bracket creep at different income levels.
Section 9 assesses claims made about the aggregate cost to revenue of the tax cuts, followed by some concluding observations in section 10.
2. Australia’s progressive personal income tax system
Australia has a ‘progressive’ personal income tax system. This means those with higher taxable incomes pay a greater percentage of their income in tax than those with lower incomes. In practice, a series of income thresholds partition each taxpayers’ taxable income for the financial year into ‘tax brackets’ upon which different rates of tax are levied. The system is considered progressive because the brackets between the higher income thresholds incur higher rates of tax than those between the lower income thresholds.
The rates of tax applied within each tax bracket are called ‘marginal rates’ of tax because these are the marginal amounts of tax that would be paid on the marginal dollar earned. For example, under 2023-24 tax policy, a taxpayer with a taxable income of $45,001 would pay an additional 32.5 cents in tax were they to earn an additional dollar of taxable income. This is considerably lower than the 45 cents to be paid on an additional dollar by a taxpayer who had already earned $180,001 that financial year.
Figure 1A presents the amount of tax paid at each level of taxable income up $190,000 under 2023-24 policy.[1] No tax is paid on taxable income under $18,200 — the tax-free threshold. Above this income threshold, taxpayers pay 19 cents on every dollar, so those with taxable incomes in the second tax bracket ($18,200-$45,000) face a marginal tax rate of 19 per cent on taxable income above $18,200. As indicated in the figure, a taxpayer with a taxable income of exactly $45,000 would pay $5,092 = 0.19 × ($45,000-$18,200) in personal income tax. The reason Australia’s tax system is considered progressive is that the slope of the tax schedule is steeper over the higher tax brackets than at lower tax brackets; a direct result of the higher marginal tax rates in these tax brackets.
Figure 1 Australia’s personal income tax policy, 2023-24
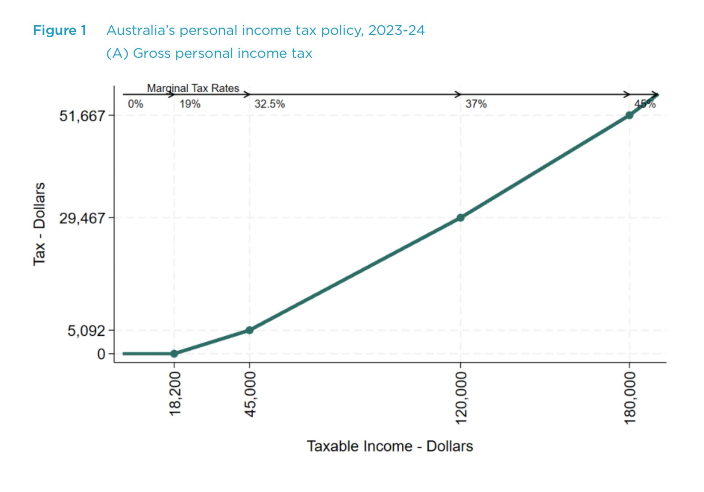
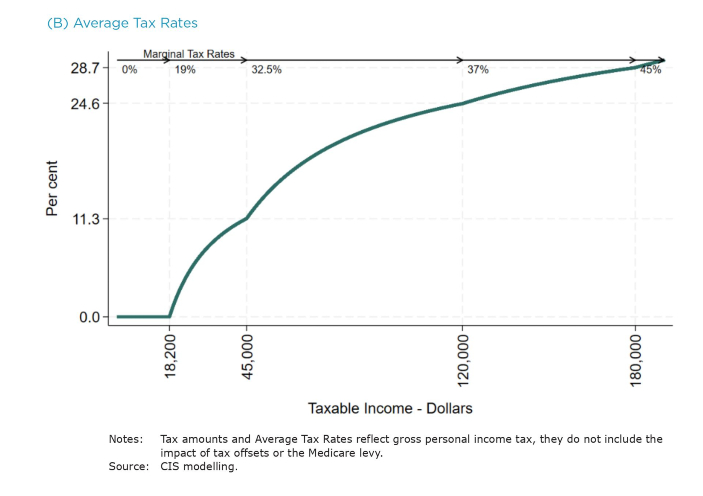
Figure 1B presents the ‘tax rate’ that taxpayers would face at each level of taxable income in 2023-24; that is, the percentage of taxable income that must be paid to the government in personal income tax. Economists often refer to this as the Average Tax Rate (ATR) because the ATR is equal to a weighted average of marginal tax rates. For example, a taxpayer with $45,000 of income would pay a marginal tax rate of zero on 40.4 per cent of their taxable income (= $18,200 ¸ $45,000) and a marginal tax rate of 19 per cent on the other 59.6 per cent. Their ATR is therefore 11.3 per cent = 0.404 × 0 + 0.596 × 0.19. A taxpayer in the top tax bracket with a taxable income of $190,000 would face a top marginal tax rate of 45 cents in the dollar but their ATR, taking into account that most of their income is taxed at lower marginal rates, would be 29.6 per cent. Only those with the highest taxable incomes face ATRs approaching their top marginal tax rate.[2]
3. How does bracket creep increase tax?
3.1 Bracket creep pushes up Average Tax Rates
Tax increases are built into Australia’s personal income tax policy by default. In fact, in any year in which the government does not provide tax cuts, pay increases push up (average) tax rates. It may seem that this is what a progressive tax system is meant to do, but this could not be further from the truth. Progressivity requires that those with a greater capacity to pay tax face higher ATRs. The progressivity of Australia’s tax system can be seen clearly in Figure 1B where the ATR curve slopes upward. Were the ATR a flat (horizontal) line, the tax system would be said to be proportional rather than progressive. In this instance, everyone’s marginal rate would equal their ATR, as there would be a single rate of tax applied to taxable income. This is termed a ‘flat tax’.
Though progressivity requires that those with a greater capacity to pay tax pay higher rates, an increase in taxable income does not necessarily mean a taxpayer’s capacity to pay tax has increased. In those financial years in which there are no tax cuts, the previous year’s tax thresholds are applied to the current year’s taxable incomes. If these incomes have increased only in line with increases in the price of the goods and services these incomes can buy — the rate of inflation — there is no greater capacity to pay tax. If income growth is merely matching that of inflation, taxable incomes have remained the same in ‘real’ — adjusted for inflation — terms despite an increase in ‘nominal’ terms. Despite this, every taxpayer whose (nominal) taxable income has increased will pay more tax — and face a higher tax rate — as they move up the ATR curve in Figure 1B. Bracket creep is essentially tax rate increases imposed on the same level of real taxable income, resulting from the tax thresholds not increasing with inflation.
The effect of bracket creep can be seen in Figure 2A. Dee is a hypothetical full-time worker in her early 20s with gross labour earnings of $61,897 a year and no other taxable income.[3] If prices were to increase by 5 per cent over the course of 2024-25, and her employer was to grant her a 5 per cent pay increase to maintain her real taxable income at the same level as in 2023-24, her (nominal) earnings would increase to $63,444. Importantly, her capacity to pay additional tax has not increased in 2024-25. Despite this, her ATR increases from 17.1 per cent to 17.8 per cent.
Similar percentage increases in nominal taxable income have analogous effects at other levels of taxable income. The same percentage pay increase for Charlie, a part-time worker in his late teens earning $41,600 in 2023-24, increases his ATR from 10.7 per cent to 11.1 per cent. Frank, a full-time worker in his 40s on $94,692, would see his ATR increased from 22.4 to 22.9 per cent.[4]
Figure 2 Bracket creep resulting from nominal income growth if 2023-24 tax thresholds were to remain in place in subsequent years, $2023-24
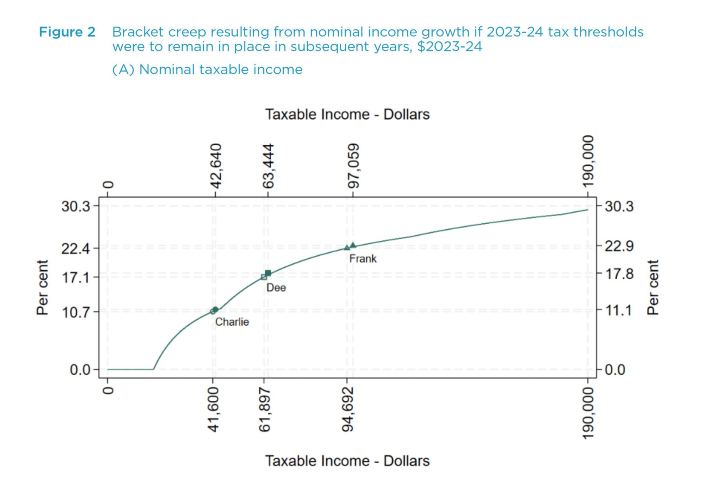

Figure 2A illustrates bracket creep as a movement up an ATR curve presented in terms of nominal taxable income. An alternative, and equivalent, way to view bracket creep is as an upward shift in the ATR curve at each level of real taxable income. This emphasises the fact that if tax thresholds do not increase with inflation, taxpayers will face higher ATRs at each level of real taxable income as a result of nominal income increases. This is shown in Figure 2B which presents the 2023-24 ATRs and the 2024-25 ATRs for each level of (real) taxable income in $2023-24.[5] The increases in the ATRs at each level of (real) taxable income may seem trivial over the course of a single financial year, but they add up over time. For example, if 2023-24 tax thresholds (and marginal rates) were to remain fixed from now until 2032-33, with 2.5 per cent annual growth in taxable incomes, ATRs would continue to shift upward. Dee’s ATR would increase from 17.1 per cent to 20.2 per cent, Charlie’s ATR would increase from 10.7 per cent to 14.2 per cent and Frank’s from 22.4 per cent to 24.4 per cent.
If these tax rate increases still sound trivial, keep in mind that the (real) value of the additional tax payments is increasing every year. Dee’s tax payment in 2023-24 is $10,584 in $2023-24. In 2024-25 it would increase to $10,816 in real terms and $11,043 the next financial year. By 2032-33 Dee would be paying $12,483 in tax. Dee’s annual bracket creep payment is the difference between the actual tax (in real terms) she has to pay in a financial year and what she would had tax thresholds moved in line with inflation to keep her tax payment at $10,584 in real terms. In 2024-25 the additional tax paid is only $233, but this increases to $459 the following year. By 2032-33 Dee would be paying an additional $1,900 in tax via bracket creep.
Cumulative bracket creep is the sum of the additional tax Dee has to pay as a consequence of tax policy remaining fixed at 2023-24 policy settings. Over the period 2024-25 to 2032-33, Dee’s cumulative bracket creep results in her paying a total of $9,811 in additional tax in real terms. That’s an additional $1,090 in tax per year, on average, as a result of bracket creep. On an annual average basis, these payments are far from trivial.
3.2 Bracket creep reduces the progressivity of the tax system and hits young taxpayers hardest
Bracket creep has a proportionately greater impact on the tax paid by younger taxpayers. This is not because they are young per se, but because younger taxpayers tend to be at the beginning of their careers and have lower taxable incomes on average. Take our hypothetical teenage worker Charlie with his part-time job earning $41,600 in 2023-24. Were he to stay at this level of taxable income (in real terms) he would see his ATR increase by 3.5 percentage points by 2032-33 and pay an additional $6,183 in bracket creep over the period 2024-25 to 2032-33, provided his nominal income — and prices — increased by 2.5 per cent every year.[6] This is a larger increase in his ATR than the 2.2 percentage point increase Frank would face, though Frank will have paid somewhat more in cumulative bracket creep than Charlie ($9,811). Over the nine years 2024-25 to 2032-33, these cumulative increases in tax arising from bracket creep amount to an average annual increase of $687 for Charlie compared to Frank’s $1,090. The additional tax paid by Frank is clearly higher in absolute terms, but when we consider these annual amounts relative to their annual incomes, the increase in the burden carried by Charlie is clearly greater than Frank’s.
A progressive tax system is meant to ensure that those with a greater capacity to pay tax pay a higher rate, but there is nothing progressive about the imposition of ever higher tax rates on those whose capacity to pay tax has not increased. This is no less true at high incomes than at low incomes. Somewhat ironically, bracket creep arises as a direct consequence of Australia’s progressive tax system. The higher marginal rates in the higher tax brackets are why the ATR curve slopes upward; ensuring nominal increases in income push tax rates up, as shown in Figure 2A. The abolition of tax thresholds, and a move to a single marginal rate of (flat) tax from zero dollars of taxable income, would solve the problem of bracket creep and move Australia tax system from one that is progressive to one that is proportional.[7]
Of course, fixing the bracket creep problem need not be cast as a choice between progressive income tax and a flat tax. All the government need do is increase existing tax thresholds in line with price increases. If tax thresholds were indexed to movements in the Consumer Price Index (CPI), pay increases that match inflation would cease to push up tax rates.[8]
4 Modelling methodology
Much of the commentary on the Personal Income Tax Plan (PITP), as originally legislated in June 2018, has focused on the magnitude of the Stage 3 tranche of tax cuts intended to commence on July 1 this year. Some commentators have questioned their sustainability, others point to the large differences in the dollar value of the tax cuts accruing to high income earners compared to lower income earners.[9]
This commentary typically fails to acknowledge the amounts of bracket creep paid by higher income taxpayers since the beginning of the PITP, that low- and middle-income taxpayers received tax relief in the early years of PITP, or the relativity of the dollar amounts of the Stage 3 tax cuts to the total amount of tax higher income earners are required to pay.
This report provides the appropriate context for Stage 3 tax cuts as they were originally conceived. It presents hypothetical estimates of the cumulative tax paid over the period 2017-18 to 2024-25 across different levels of (real) taxable income. These estimates take into account the additional tax paid as a result of bracket creep and the tax cuts over the period that were — at least in theory — meant to offset. These estimates of cumulative tax are formed by comparing the tax paid at each level of (real) taxable income to that which would have been paid had the government indexed the income thresholds, and tax offset rates, that govern the personal income tax system to movements in the CPI. These estimates reflect gross income tax, the Low Income Tax Offset (LITO) and the Low and Middle Income Tax Offset (LMITO) in the years this offset was in place. Nominal taxable income is assumed to increase with CPI since the benchmark year under the assumption that the rate of inflation for the 2023-24 financial year will be 4.2 percent, and 3.2 percent the following financial year.[10]
In terms of the ATR schedules presented in Figure 2B, the ATR curves that arise from the indexation of tax policy are the same in every financial year. The actual policy that applies in each financial year creates ATR curves that may sit above or below the benchmark ATR curve, depending on the tax policy of the time. Provided CPI growth is positive, in the years following the benchmark year a lack of tax cuts would be reflected in ATR curves that sit above the benchmark ATR curve. In years in which there are tax cuts, the ATR curve will lie below that of the previous year. Whether it lies below the benchmark ATR curve will depend on the specifics of the design of the tax cuts.
Taking the sum of the difference between the tax paid under actual policy, and tax paid under indexed policy in each year, provides an estimate of the cumulative effect of tax policy since the benchmark tax year. Depending on how the tax cuts of the period were designed, this amount can vary significantly across (real) taxable incomes. At a given level of (real) taxable income, if this cumulative amount is positive it could be said that those at this level of taxable have been overcompensated for bracket creep since the benchmark year. If this amount is negative, they are said to have been undercompensated.
There are two important aspects of this calculation to bear in mind. The first is that tax cuts are necessary, but not sufficient, to provide compensation for bracket creep. A change in tax policy that pushes ATRs down can be said to be a tax cut relative to the previous financial year. However, for tax cuts to compensate for bracket creep accumulated in previous years, they must produce an ATR curve that falls below the benchmark ATR curve. Modest tax cuts might negate bracket creep that would otherwise have arisen in that financial year, but they do not necessarily compensate for bracket creep accumulated in earlier years. The longer bracket creep is left to accumulate, the larger eventual tax cuts must be to provide compensation.
The second is that the assertion that a tax cut ‘compensates for bracket creep’ is meaningless in the absence of a specified time frame. A modest tax cut could be said to at least partially offset bracket creep that would otherwise have occurred in its absence. Larger tax cuts are more likely to offset bracket creep accumulated in previous years. In the absence of an estimate of cumulative bracket creep since some specified benchmark year, it is unclear how much compensation a tax cut provides.
5. Would the original Personal Income Tax Plan have compensated for bracket creep since 2017-18?
5.1 Average tax rates since 2017-18
This section places the (original) third Stage of the PITP legislated in 2019 in the context of the broader plan and the accumulation of bracket creep over the period 2017-18 to 2024-25. Figure 3A presents the ATRs paid at different levels of real taxable income in the financial year prior to the introduction of the first stage of the PITP in 2018-19, and in the early years of the plan. All ATRs and taxable incomes are presented in real terms; that is, in $2024-25.
The figure shows how the introduction of the LMITO in 2018-19 pushed the ATR paid by the median wage earner down from 19.6 to 18.3 per cent.[11] Despite those with (real) taxable incomes above $156,300 ($2024-25) not receiving any benefit from the introduction of LMITO, they did receive a very modest benefit from a small (nominal) increase in the third tax threshold from $87,000 to $90,000.
With no tax cuts in 2019-20, bracket creep pushed up ATRs prior to the bringing forward of the Stage 2 tax cuts to 2020-21 which were able to prevent ATRs reaching their 2017-18 levels for all but those with (real) taxable incomes above $141,700.
Following an additional two years of bracket creep, and the end of the LMITO in 2022-23, ATRs were increased above their 2017-18 levels for all taxpayers but those with (real) taxable incomes between $120,400 and $198,400.[12] The increase in ATRs over this period was quite pronounced. Though the end of LMITO was an important factor, the bracket creep resulting from 4.8 per cent inflation — more than double that of the year before — would have pushed up the ATRs of those whose nominal incomes increased accordingly.
Figure 3 Average tax rates between 2017-18 and 2024-25 by (real) taxable income, $2024-25
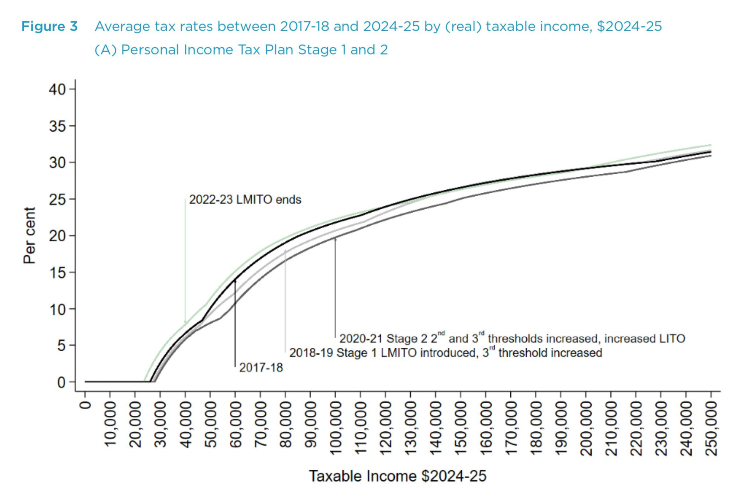
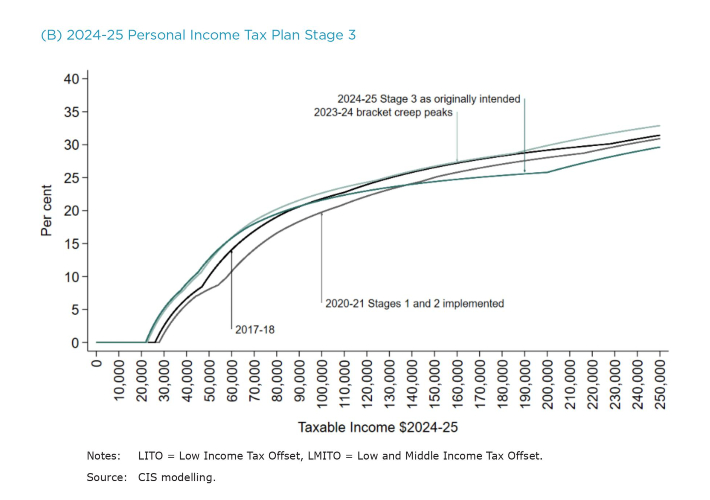
Figure 3B shows the peak in ATRs in 2023-24 prior to those that would have resulted were Stage 3 of the PITP implemented as legislated in 2018. The figure suggests significant bracket creep following the (early) implementation of Stage 2 in 2020-21, with ATRs for the median wage earner[13] increasing from 17.2 per cent to 20.7 per cent off the back of 6.5 per cent inflation that financial year. Of course, the ATRs for low- and middle-income earners would also have been impacted by the ending of the LMITO from 2022-23. For those at the bottom of the pre-Stage 3 top tax bracket of $180,000, ATRs increased from 27 per cent to 28.4 per cent.
The introduction of the Stage 3 tax cuts, as originally envisioned, would have reduced the median wage earner’s ATR to 19.9 per cent the following year and have provided significant tax relief for higher income earners. Those with a (real) taxable income of $180,000 would see their ATR fall to 25.3 per cent.
5.2 Discretionary tax policy 2018-19 to 2024-25
Figure 3 provides an indication of how ATRs would have evolved over the course of the implementation of the PITP, as originally conceived. In each financial year there are potentially two forces pulling on the ATRs at each level of real taxable income. One is the upward pull of bracket creep as nominal income increases move taxpayers to the right along the (nominal) ATR curve, thereby pushing up their real tax rates at each level of real income. These tax increases are effectively ‘baked in’ to personal income tax policy each year as a result of tax thresholds not moving in line with growth in nominal incomes. This force is automatic, pushing tax rates up every year unless the government makes a deliberate move to cut taxes.
The other force pulling on real tax rates is discretionary change in tax policy. These are the tax cuts that typically push ATRs down, though we will see shortly discretionary tax increases are not unheard of.[14] In the ATR schedules presented in Figure 3, we see the effect of both of these forces working simultaneously. That is, we observe the net effect of both nominal income growth and tax policy on the ATRs to be paid in each financial year.
Figure 4 presents the real dollar value of discretionary tax changes since 2017-18, at each level of real taxable income, in $2024-25 with the tax changes stacked atop one another in chronological order from the horizontal axis. These discretionary tax changes are defined as the tax that would be paid if the previous financial year’s tax policy were applied to each year’s (nominal) taxable income less the actual tax paid in the current financial year, presented in $2024-25. One advantage of this measure of discretionary tax policy is that both components are equal in financial years where the parameters of the tax system remain unchanged, providing a value of zero at every level of taxable income and are thereby omitted from the figure. In financial years where there are tax increases, this measure provides the change in tax from the previous year, less that part of the increase in tax that would have resulted from bracket creep in the absence of the policy change. In years where the government provides tax cuts, the measure provides the change in tax from the previous year, with the addition of the bracket creep that would have otherwise resulted.[15]
Figure 4 Discretionary changes in personal income tax policy since 2017-18 by (real) taxable income, $2024-25
Insofar as personal income tax policy is legislated in terms of nominal tax thresholds, the default tax policy is one of (real) tax increases every financial year. When the government legislates tax cuts, one could argue it has made a conscious decision to neutralise the bracket creep that would otherwise have occurred and — one hopes — provide tax relief to offset bracket creep incurred in previous years. This definition of discretionary tax cuts adds this ‘neutralised bracket creep’ to the year-on-year tax reduction in years when taxes are cut. In years where tax increases are a result of policy change, rather than the bracket creep that would occur by default, this definition takes out that part of the year-on-year tax increase that was going to occur anyway as a result of bracket creep.[16]
In contrast to the ATRs in Figure 3, Figure 4 provides a more intuitive graphical presentation of tax policy that is not obscured by the impact of increases in nominal income over the years. In Figure 4, we can clearly see how the main beneficiaries of the Stage 1 tax cuts were primarily those on low and middle incomes. Higher income earners received negligible tax relief from the modest increase in the penultimate tax bracket. In (real) dollar terms, the primary beneficiaries of the Stage 2 tax cuts where those with middle to high incomes. The (nominal) $420 increase in the rate of LMITO in 2021-22, and its conclusion in 2022-23, impacted only low- and middle- income earners eligible for the tax offset.
Figure 4 is also useful in understanding the objections to the original design of the Stage 3 tax cuts voiced by its opponents. When presented in (real) dollar terms, the Stage 3 tax cuts provide a greater benefit to higher income earners than to lower income earners. However, these protests omit two important pieces of context, the first of which is presented in Figure 5.
5.2 Bracket creep: Default tax policy 2018-19 to 2024-25
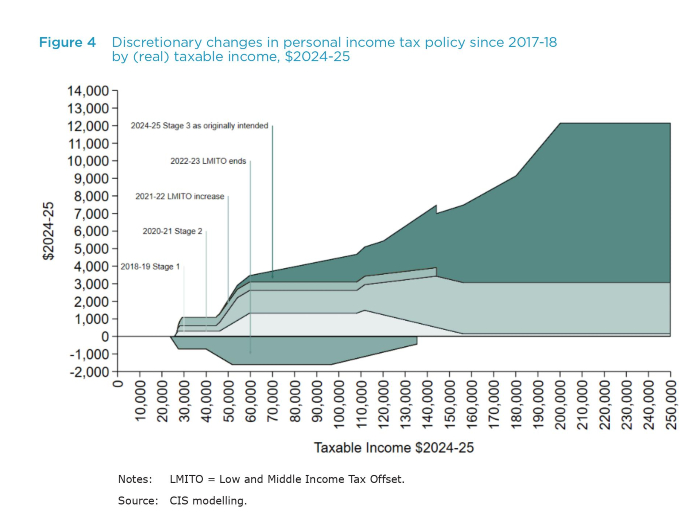
It is important to note that Figure 4 covers seven financial years in which we observe five policy changes — one of which is a tax increase. While the four tax cuts in Figure 4 (especially Stage 2 and Stage 3) may look generous, they need to be considered in the context of the bracket creep they are required to salve, presented in Figure 5. The magnitude of the bracket creep in any given year is proportional to the (assumed) increases in nominal income which are particularly large in 2021-22 and 2022-23 when inflation was running at 4.8 and 6.5 per cent respectively.[17] As observed in Figure 4, there was a modest tax cut in 2021-22 that would have offset some of that year’s bracket creep for those on low and middle incomes, but there was no tax relief provided in 2022-23. To assert it is unfair for higher income earners to receive larger tax cuts under Stage 3 than lower income earners, in absolute terms, is to dismiss that those on higher incomes have paid far more tax as a result of bracket creep since 2017-18 than low- and middle- income earners.
Figure 5 Bracket creep since 2017-18 by (real) taxable income, $2024-25
What Figure 5 contributes to our understanding of income tax policy, as it has unfolded in recent years, is that nominal income increases would — left unchecked — lead to perpetual tax increases in real terms. What Figure 4 contributes to our understanding of the recent history of personal income tax policy is that tax cuts are far less frequent than bracket creep. If they are to offset the bracket creep of the intervening years, they must be greater than the bracket creep of any given year if they are to provide genuine tax relief. The assertion that the (original) Stage 3 tax cuts would ‘give’ high income earners $9,000, with no mention of the additional tax paid by those individuals as a result of bracket creep, presents an inaccurate picture of how Australia’s personal income tax system actually works.
5.3 The Personal Income Tax Plan taken as a whole
Figure 6 provides an indication of the extent to which bracket creep and discretionary changes in tax policy have combined to determine how much tax has been paid since 2017-18, at different levels of (real) taxable income. The area above the horizontal axis is the sum of tax paid under actual policy, less what would have been paid had ATRs been maintained at their 2017-18 levels in real terms in those years when the former was less than the latter. It can be thought of the gains made by taxpayers when actual policy ensured lower tax payments than would have been payable under the policy benchmark — in this instance 2017-18 policy had tax thresholds moved in line with inflation. The darker green area above the horizontal axis provides the sum of the benefit of tax cuts provided between 2018-19 and 2023-24 which take into account the conclusion of LMITO in 2022-23. The lighter green presents the net benefit of 2024-25 Stage 3 tax cuts as originally envisaged.
The area below the horizontal axis is the sum of the losses that have resulted over the years when ATRs were higher than if income tax had been maintained at 2017-18 levels in real terms. The grey area presents this for the years 2018-19 to 2023-24 and the light green area presents this loss for the 2024-25 financial year under the original Stage 3 design. It may seem peculiar that the Stage 3 tax cuts would result in a loss in 2024-25 for those with (real) taxable incomes between $21,900 and $92,000. This is a result of the Stage 3 tax cut being insufficient to compensate for 2024-25 bracket creep over this range of taxable income.
Figure 6 The cumulative impact of discretionary tax policy and bracket creep since 2017-18 by (real) taxable income, $2024-25
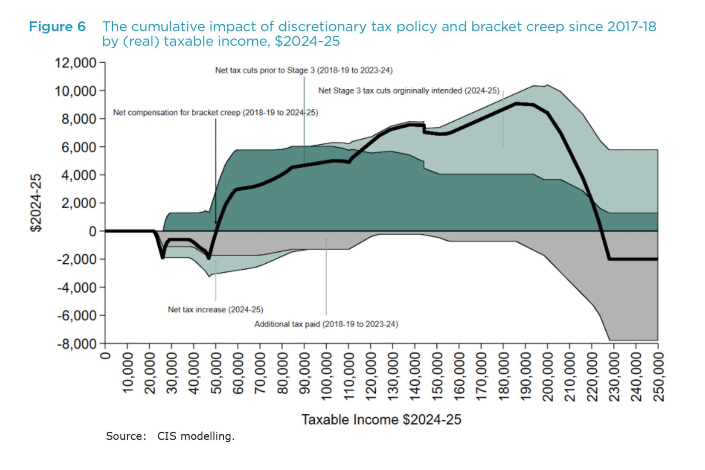
Turning to the grey area below the horizontal axis, it is clear in Figure 6 that the tax increases paid by those in the middle of the taxable income distribution through bracket creep over the period 2018-19 to 2023-24 have been comparatively modest next to the amount of compensation they received from the PITP prior to Stage 3. This has not been the case for higher income earners.
The black line in Figure 6 gives an indication of taxpayers’ net position over the period 2018-19 to 2024-25, were the Stage 3 tax cuts to have been implemented as originally intended. This is the sum of the net benefit received in those financial years in which personal income tax was, in real terms, less than that paid in 2017-18 less the sum of net losses incurred in those years in which actual tax paid was higher. It is essentially the top of the ‘net benefits’ in the graph (the dark green and light green areas above the horizontal axis) less the ‘net losses’ (the grey area and the light green area between $21,900 and $92,000) below the horizontal axis.
The black line demonstrates the extent to which those with taxable income above $224,400 would have been worse off since 2017-18, even if the Stage 3 tax cuts were to go ahead as originally intended. It is clear in the figure that those who have recently been slated for smaller tax cuts in 2024-25 are not those who have been overcompensated for bracket creep since the beginning of the PITP. These taxpayers were already going to be taxed more as a result of bracket creep and the tax policy of this period. The government’s ‘revision’ to the Stage 3 tax cuts announced in January 2024 will impose an even greater tax burden on these taxpayers.
Of course, it is not only those on high incomes who have been undercompensated by tax reform over the period 2018-19 to 2023-24. Those with taxable incomes between $21,900 and $50,300 have also been left worse off since 2017-18, through a combination of bracket creep and the conclusion of LMITO in 2022-23.
In summary, the assertion that those with taxable incomes in the top tax bracket have been overcompensated for bracket creep by the PITP (as originally legislated) is difficult to reconcile with Figure 6. Despite the larger absolute value of the Stage 3 tax cuts that were to flow to higher income earners, to assert they have received more compensation than low- and middle-income earners over the course of the PITP is almost certainly incorrect.
6. Does the Personal Income Tax Plan compensate high income earners for bracket creep since the last time they received tax relief?
6.1 Average tax rates since 2010-11
Having established how bracket creep and the discretionary tax policy of the original PITP was intended to shape the cumulative amount of net tax paid since its inception, the analysis in this section takes a longer-term perspective of personal income tax policy.
Much of the criticism of the third stage of the PITP has centred around the policy’s impact on the progressivity of the personal income tax system, as seen in Figure 3B. What many of those critics neglect to mention is that for a lot of the high-income earners who stood to benefit from the original Stage 3 design, the last government to announce tax cuts specifically targeted at these levels of income was the Howard government in 2007. Of course, they would need to wait until 2008-09 to receive them from the Rudd government after Labor committed to them in opposition and subsequently kept this promise in government.[18] The next two financial years would see two increases in the second tax threshold, and reductions in the penultimate marginal tax rates, also announced by the Howard government and delivered by the Rudd government.[19] With this context in mind, 2010-11 marks the last year that those with (nominal) taxable incomes above $180,000 had received any tax relief prior to the modest tax cuts of 2016-17. These taxpayers would need to wait a further three years to receive any significant tax relief in the form of the second Stage of the PITP.
In the previous section, the financial year prior to the beginning of the PITP was used as the benchmark tax system to place the originally intended Stage 3 component of the plan within the broader context of the PITP, and the bracket creep built into Australia’s personal income tax policy. This section takes 2010-11 as the benchmark tax system in order to place the magnitude of the Stage 3 tax cuts in the context of the bracket creep paid by higher income earners since the last time they received meaningful tax relief, prior to the second stage of the PITP.
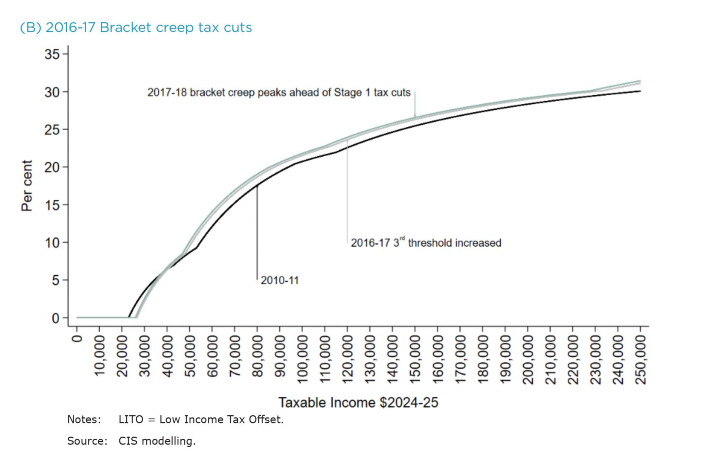
Figure 7 presents selected ATRs since 2010-11 against the ATRs that would be in place were they fixed at their 2010-11 levels in real terms. Figure 7A shows the significant increase in the first effective tax threshold resulting from a (nominal) increase in the first (gross) tax threshold from $6,000 to $18,200 accompanied by increases in marginal tax rates between the first and third thresholds introduced in 2012-13 as part of the Clean Energy Future package.[20] In real terms, the first effective tax threshold increased from $22,400 to $28,200 that financial year (in $2024-25).[21]
Despite a change of government in the first half of the 2013-14 financial year, there was no tax relief for the next three years pushing ATRs up prior to the Turnbull government’s 2016-17 ‘bracket creep’ tax cuts.[22] The ATRs resulting from these 2016-17 tax cuts are presented in Figure 7B along with the peak in ATRs ahead of the first stage of the PITP. The evolution of ATRs post-2017-18 has previously been provided in Figure 3 and need not be reproduced here.
Figure 7 Average tax rates between 2010-11 and 2024-25 by (real) taxable income, $2024-25

6.2 Discretionary tax policy and bracket creep 2010-11 to 2024-25
Figure 8 presents the same discretionary tax policy changes as Figure 4, with the addition of the 2012-13 and 2016-17 tax changes. As in Figure 4, the 2024-25 tax cuts assume Stage 3 were implemented as originally legislated. The figure emphasises the paucity of discretionary tax changes from 2010-11 prior to the introduction of the first stage of the PITP. In the seven financial years from 2011-12 to 2017-18 there were a mere two tax threshold increases (2012-13 and 2016-17) one of which was accompanied by two marginal rate increases (2012-13).
Figure 8 Discretionary changes in personal income tax policy since 2010-11 by (real) taxable income, $2024-25
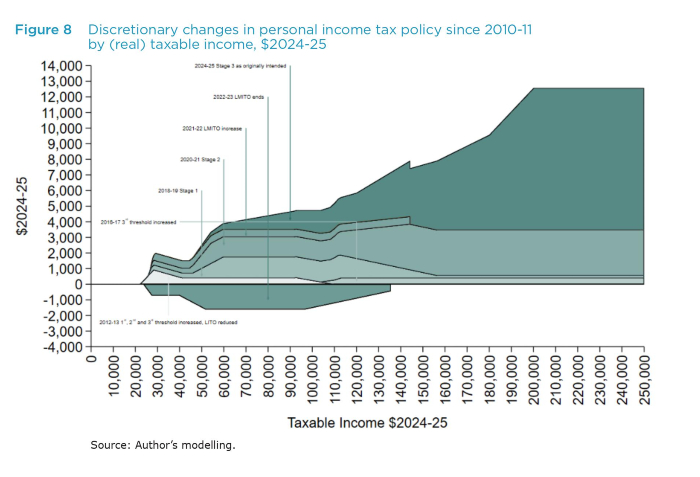
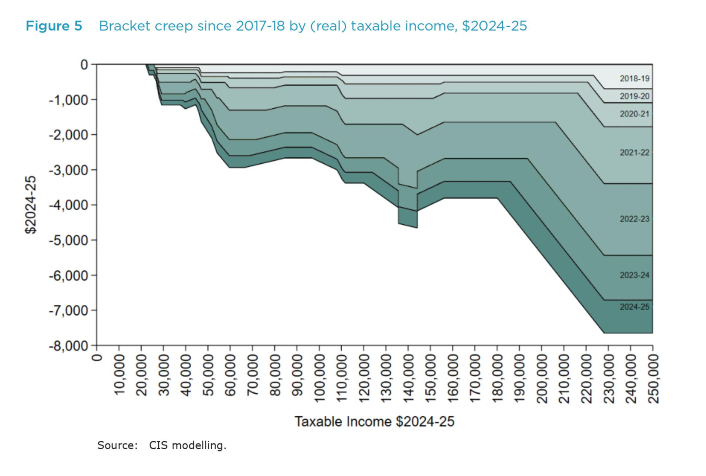
Figure 9 places the discretionary tax changes of Figure 8 in the context of the fourteen years of bracket creep they would need to offset to ensure the tax burden over the period 2011-12 to 2024-25 was the same as in 2010-11. As one might expect, when compared to Figure 4 and Figure 5, the addition of two fairly modest years of tax cuts next to an additional five years of bracket creep suggest many taxpayers are likely to have been more highly taxed over the period.
6.3 Net compensation for bracket creep since 2010-11
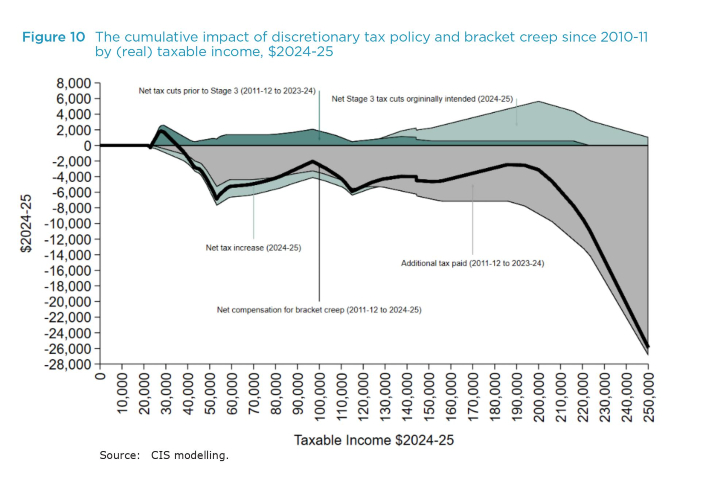
Figure 10 presents estimates of the net compensation for bracket creep, similar to those of Figure 6, but instead presents the net impact of cumulative tax cuts and bracket creep incurred compared to a 2010-11 tax policy benchmark. Incorporating the two additional tax cuts of the 2011-12 to 2017-18 period (in 2012-13 and 2016-17), and the intervening years of bracket creep, suggests all but the lowest levels of taxable income have been undercompensated for bracket creep over the period. This is especially true of those with taxable incomes above $210,000.
Figure 9 Bracket creep since 2010-11 by (real) taxable income, $2024-25
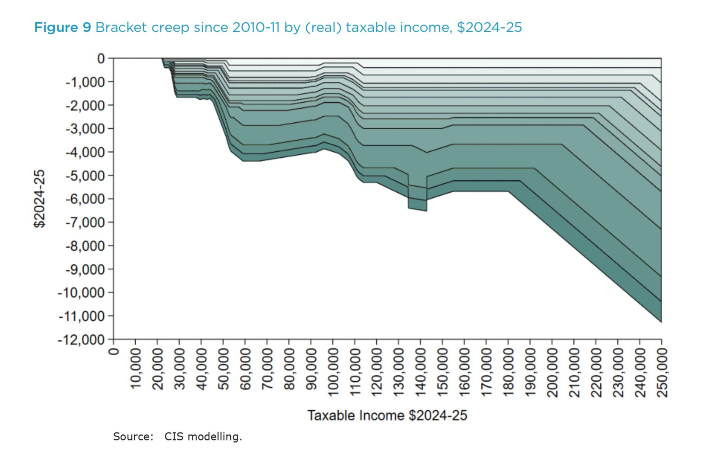
Those who benefited from tax policy over this period are those with taxable incomes between $23,400 and $35,200. The greatest benefit appears to have gone to those at a (real) taxable income of $27,800 who received $1,800 more in tax cuts than they paid in bracket creep had their nominal taxable income moved with inflation since 2010-11. Those with real incomes above $35,200 received less in tax cuts than they paid in bracket creep. Even if those at $180,000 had received their Stage 3 tax cuts, as intended, they would still have paid an additional $2,800 in additional tax than they received in tax cuts compared to what they would had tax policy remained fixed in 2010-11 in real terms.
Figure 10 The cumulative impact of discretionary tax policy and bracket creep since 2010-11 by (real) taxable income, $2024-25
7. Progressivity of tax cuts versus progressivity of bracket creep compensation
7.1 Average annual impact of tax policy in (real) dollar terms
Figure 11 presents the simulated compensation curves shown in Figure 6 and Figure 10, divided by the number of financial years of tax policy under consideration. More specifically, the curve labelled 2017-18 presents the cumulative impact of bracket creep on tax paid since the beginning of the PITP in Figure 6, divided by the seven years following the 2017-18 benchmark. The curve labelled 2010-11 presents the cumulative impact of tax policy since 2010-11 in Figure 10, divided by the number of financial years since the last of the Howard government tax cuts (delivered by the Rudd government) in 2010-11. Both simulations present the impact of tax policy up to the 2024-25 financial year, assuming the Stage 3 tax cuts were implemented in 2024-25 as originally legislated.
Presenting the cumulative impact of tax policy as annual averages enables a comparison of the cumulative impact of tax policy, measured against two alternative tax benchmarks, that accounts for the different time horizons under consideration. Another advantage of presenting annual averages is that it is more natural to think of economic variables like net tax and taxable income as annual flows rather than cumulative dollar amounts over multiple years. As with all previous figures, Figure 11 provides dollar values in (real) $2024-25.
Figure 11 Average annual net compensation for bracket creep by (real) taxable income, $2024-25
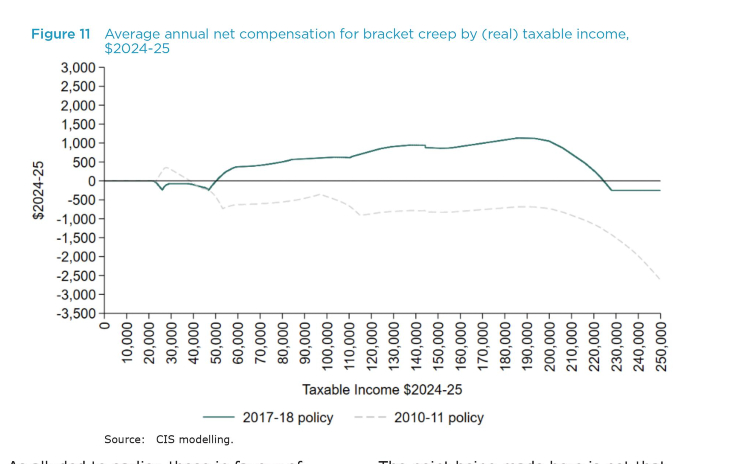
As alluded to earlier, those in favour of higher income taxes have cast the original Stage 3 tax cuts — taken in isolation from the rest of the PITP — as ‘$9,000 gifts’ for ‘society’s wealthiest’.[23] However, when the cumulative impact of each stage of the PITP is compared with personal tax policy as it existed just prior to its introduction, it is not the highest income earners who have benefited the most in absolute terms. Those with taxable incomes above $224,400 would still have paid more in tax, on average over the period 2018-19 to 2024-25, than they would had 2017-18 policy been indexed to CPI — even if they were to receive the full Stage 3 tax cuts legislated in 2019. In contrast, those with taxable incomes in the range $50,300–$224,400 will have received average cumulative tax cuts of up to $1,100 a year over this period, relative to the indexation scenario.
When compared to the tax policy of 2010-11, the paucity of tax cuts in the years leading up to the PITP will have left those with taxable incomes above $38,500 paying more tax, on average. Those with taxable incomes above $200,000 — supposedly the primary beneficiaries of the Turnbull and Morrison governments’ alleged largesse — will still have paid at least an additional $700 in cumulative tax, on average, since 2010-11.
The point being made here is not that 2010-11 or 2017-18 tax policy settings are necessarily the final word on tax policy. Perspectives on the ideal tax policy benchmark are shaped by subjective views on what role government should play in society, how much tax revenue that role requires and how the resultant tax burden should be distributed. For some, efficiency considerations are paramount; for others, tax policy should place a greater emphasis on ameliorating inequality in disposables incomes.
The point made here is that, regardless of the size of one’s taxable income, the tax cuts received by a taxpayer in a single financial year need to be viewed in the context of the additional tax payments they have made in those years in which there were none — additional tax payments arising from bracket creep for which the government never sought explicit consent. Those who have earned $200,000 in taxable income (in real terms) since 2010-11 would have paid more tax, on average, over the course of 2012-11 to 2024-25 even if they were to receive their full (original) Stage 3 tax cut. The assertion these taxpayers stood to benefit from a $9,000 tax cut in 2024-25 — though broadly correct — tells us nothing of their cumulative tax burden, considering the bracket creep they will have paid in the preceding years.
7.2 Average annual impact of tax policy as a percentage of (real) taxable income
Writing of the PITP in 2019, the Grattan Institute suggested that while Australia’s personal income tax system would remain progressive following its introduction “…it will be less progressive, particularly if Stage 3 of the plan is implemented. Tax as a proportion of income will rise for low and middle-income earners but fall for high-income earners.”[24] This is consistent with a comparison of the ATRs for 2024-25 in Figure 3B with those of 2017-18. When compared to personal income tax policy as it existed just prior to the first stage of the PITP, the original design of Stage 3 would have produced ATRs that were higher for those with taxable incomes below $92,000 and lower for those above.[25] The question is: does this matter? Or more specifically, assuming the progressivity of Australia’s personal tax system is something to which the PITP ought to have preserved, does a departure from previous levels of progressivity in one financial year matter?[26]
Figure 12 Average annual net compensation for bracket creep by (real) taxable income as a percentage of taxable income, $2024-25
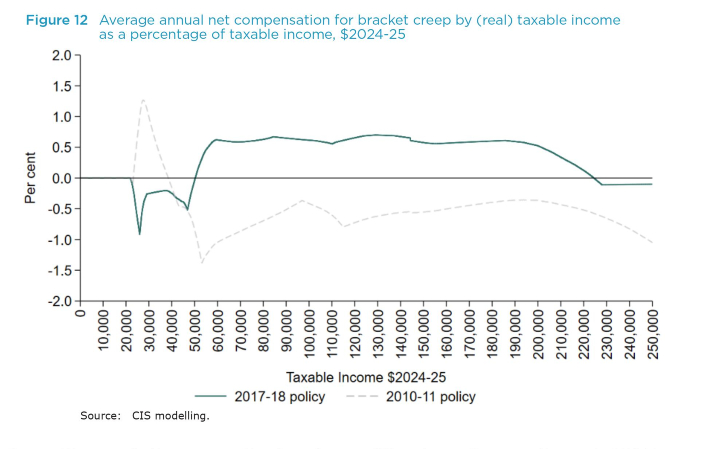
Figure 12 presents the same estimates of the average annual impact of tax policy in Figure 11 as a percentage of (real) taxable income. For all the commentary surrounding the progressivity of the original Stage 3 tax cuts, the PITP’s impact on average annual cumulative tax paid, as a percentage of income, since 2017-18 is within ±1 per cent. Despite the reduction in progressivity arising from the third stage of the PITP, the package — taken as a whole — was broadly progressive among those with taxable incomes above $59,300, while the PITP appears to have increased the cumulative tax paid by those with taxable incomes between $21,900 and $50,300. The following section will show this has nothing to do with the third Stage of the PITP.
When tax policy over the period 2011-12 to 2024-25 is compared to the tax policy settings in place in 2010-11, the progressivity of cumulative tax paid is more complex, though not obviously regressive.
Returning to the question put at the beginning of this subsection, a tax cut that reduces the progressivity of the tax system in a single year will not necessarily have any noticeable impact on the progressivity of cumulative tax paid in the years before and after. This will ultimately be determined by the frequency and magnitude of discretionary tax cuts and the nominal growth in taxable incomes that drives bracket creep in the years when there are no cuts. The supposed tax cuts for ‘the wealthiest in society’ seem poised to have had a negligible impact on the progressivity of tax policy over the period 2017-18 to 2024-25 when the PITP is considered in its entirety.
Thus far, the analysis of the PITP presented in this report has been backward looking from the vantage point of 2024-25. Were Stage 3 to proceed in the form it was originally intended, it would undoubtedly have had an impact on the progressivity of the tax system in subsequent years. However, whatever gains taxpayers receive from discretionary tax cuts are ultimately eroded by bracket creep, as evidenced by Figure 3 and Figure 7. Figure 8 emphasises how infrequent tax cuts are compared to the default of annual increases from bracket creep. Of the 13 years shown in Figure 8, there are just six tax cuts; of which only two could claim to be significant. Of the six, high income earners were effectively excluded from two by design.[27]
If the argument against the original Stage 3 tax cuts is that high income earners benefit more than lower income earners, this is tantamount to asserting there is some level of taxable income above which certain taxpayers should never receive compensation for bracket creep and they should be subject to increasing tax rates in perpetuity. Much of the punditry surrounding the original design of the Stage 3 tax cuts, and the government’s proposed revisions, has questioned why high-income earners should receive greater tax cuts than lower income earners. The more important question is: why is a reduction in the progressivity of the tax system necessary for high income earners to be compensated for bracket creep in the first place? If tax thresholds were indexed to CPI, the tax liability of all taxpayers with a given (real) taxable income would be the same every year until such time the government legislated a change in tax policy. This would provide transparency for all taxpayers and avoid an inane recurring debate about whether it is fair that high income earners receive larger tax cuts than low-income earners, in absolute terms, while ignoring that high income earners carry most of the tax burden.[28]
8. What do the government’s changes to Stage 3 mean for cumulative tax paid?
8.1 Cumulative tax paid since 2017-18
The Prime Minister’s January announcement that the third stage of the PITP — due to begin on July 1, 2024 — would be redesigned ended months of speculation about the tax cuts that Labor had committed to in opposition in the lead up to the 2022 election.[29] Under questioning in a Senate estimates committee, it was revealed the Treasurer had asked the Secretary to the Treasury to consider further cost-of-living measures on the 11th of December 2023.[30] According to the testimony of the Deputy Secretary for Revenue, the Treasury Secretary “…was interested and had mentioned to us around roughly the same time that he would like the department to think about whether adjusting the personal income tax rates and thresholds could provide broad-based relief to all taxpayers in a way that didn’t add [to] inflation.”[31] Treasury submitted their research to the Treasurer on the 20th of January 2024, the recommendations of which were adopted by cabinet three days later and passed by the Senate on the 27th of February.
The Treasury advice released to the public asserts the government’s revised Stage 3 is “broadly revenue neutral” over the forward estimates and will reduce personal income tax revenue by $1.3 billion over the period 2023-24 to 2027-28. However, in the absence of any further tax relief, the redesign will increase tax receipts by around $28 billion over the period 2023-24 to 2034-35.[32] Though approximately revenue neutral over the forward estimates, the revised Stage 3 shifts the 2024-25 burden of taxation; providing greater tax cuts for those with taxable incomes below $146,486 and lower tax cuts for those above compared to the original Stage 3 design.[33]
Figure 13 presents the same estimates of the cumulative tax paid as in Figure 6 and Figure 10, next to those of cumulative tax paid under two alternative tax policy counterfactuals in (real $2024-25) dollar terms. As in Figure 6 and Figure 10,Figure 13 provides the impact of tax policy under the assumption that the Stage 3 tax cuts would be implemented as legislated in 2019, comparing this to the government’s changes announced in January. The figure also presents cumulative tax paid were the Stage 3 tax cuts to be abolished in their entirety as advocated by the Australian Greens, essentially maintaining 2023-24 policy in 2024-25.
Figure 13A presents these estimates of average annual cumulative tax under each policy counterfactual, compared to 2017-18 policy with tax thresholds subsequently indexed to CPI. As indicated earlier, were Stage 3 to go ahead as originally legislated, those with taxable incomes in the $50,200–$224,400 range would have paid up to $1,100 less in cumulative tax on average since 2017-18. Under the government’s revised Stage 3 those in the $48,500–$214,000 range (and also $34,000–$39,700) will pay up to $1,000 less in cumulative tax on average over the period. While the new policy settings will reduce the maximum cumulative tax reduction during the period,[34] the policy change pushes the range of incomes over which cumulative tax reductions occur towards lower levels of taxable income.
Figure 13 Average annual net compensation for bracket creep by (real) taxable income under different 2024-25 policy settings, $2024-25
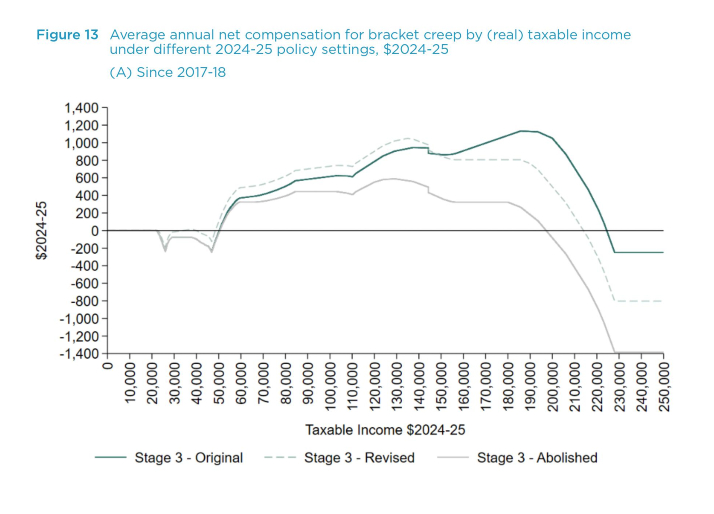
The estimates of average annual cumulative tax under each version of Stage 3 intersect at $148,300. Those with taxable incomes below this amount will pay less in cumulative tax over the period 2017-18 to 2024-25 than they would under the original Stage 3 design; those with incomes above will pay more. The taxable income range $50,300–$148,300 would already have been provided compensation for bracket creep under the original design of the Stage 3 tax cuts. Following the re-design, the average annual reduction in cumulative tax over this income range could be up to an additional $116 a year over the period.
Within the range of taxable incomes where the original design of Stage 3 would have provided compensation for bracket creep, and who will see their 2024-25 tax cut reduced by the redesign ($148,300–$224,400), the average annual cumulative increase in tax will be up to $552 since 2017-18.
For the lowest levels of taxable income ($21,900–$50,300), those found to be under-compensated for bracket creep since 2017-18 in Figure 11, it is clear in Figure 13 that this was not the result of the original design of the Stage 3 tax cuts. The average annual cumulative tax at these income levels would be little different were the Stage 3 tax cuts delivered as intended, compared to their wholesale abolition. The redesign of Stage 3 at least goes some way to ensuring those in the income range $34,000–$39,700 approximately break even over the period.
It was shown in Figure 11 that those with taxable incomes above $224,400 had been under-compensated for bracket creep since 2017-18 (as had those with taxable incomes in the range $21,900–$50,300). Figure 13A demonstrates the extent to which a tax increase arising from the abolition of the (original) Stage 3 tax cuts would increase the range of taxable incomes over which under-compensation would occur to incomes above $197,200. This under-compensation could be as high as $1,400, over the period, up from $250 under the original design of Stage 3. The redesign of Stage 3 increases the range of income over which under-compensation occurs, though not to the same extent as a repeal of (original) Stage 3. Under the redesign of Stage 3, those with taxable incomes above $214,000 will be under-compensated by as much as $800 on average since 2017-18.
While there may well be a strong case for providing low- and middle-income earners with additional tax relief in light of increases in the cost of living,[35] the notion that low- and middle-income earners require additional compensation for bracket creep is difficult to reconcile with Figure 13.[36] This is not to say the government should not provide additional tax relief to those with taxable incomes less than $146,486 (in $2023-24); only that the rationale for this must be something other than the argument that the PITP failed to compensate this group. If the Stage 3 tax cuts were to be redesigned with a view to returning bracket creep since 2017-18, it is not those with taxable incomes above $214,000 who should be facing smaller tax cuts than they were promised by the previous government and by the current government prior to January this year.
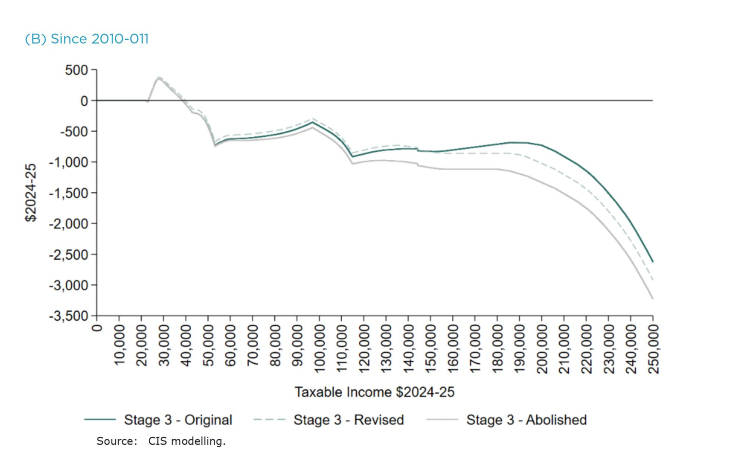
8.2 Cumulative tax paid since 2010-11
Figure 13B presents simulated estimates for the same policy counterfactual as Figure 13B, compared to 2010-11 tax policy with tax thresholds indexed to CPI. As in Figure 11, all but the lowest levels of taxable income are under-compensated for bracket creep relative to a 2010-11 tax policy benchmark. Unsurprisingly, the extent of this under-compensation would be higher were the Stage 3 tax cuts to be repealed than were they to go ahead as originally intended.
Far from being overcompensated for bracket creep since 2010-11, those with taxable incomes at what was to be the new top tax threshold of $200,000 will have paid an additional $700 a year, on average, compared to the 2010-11 tax policy having been indexed to CPI. Under the redesign, this under-compensation increases to $1,000, though less than $1,300 of under-compensation that would result from the abolition of (the original) Stage 3.
9. Were the original Stage 3 tax cuts really going to cost $324 billion?
9.1 Personal income tax revenue under different tax policy settings 2020-21 to 2032-33
A popular line of attack against the original design of the Stage 3 tax cuts has been their ‘cost to the budget’. Those who have made such claims typically cite a costing of the Stage 3 component of the PITP prepared by the Parliamentary Budget Office (PBO) in July 2022 on the request of the leader of the Australian Greens, Adam Bandt MP. The modelling presented in the PBO costing suggests the reduction in personal income tax revenue arising from the Stage 3 tax cuts would be $17.7 billion in 2024-25 and, in nominal terms, increase to $36.9 billion by 2032-33. Summing these annual revenue reductions over the nine years of the costing adds up to a total reduction in (nominal) personal income tax revenue of $240 billion.[37] An updated costing provided by the PBO in January 2024 puts the ‘cost’ of the Stage 3 tax cuts at $323.6 billion over the period 2024-25 to 2033-34 in nominal terms.[38]
While often framed as a ‘cost to the budget’ the revenue reductions reported by the PBO are in fact estimates of taxable income that would remain in the hands of taxpayers were the Stage 3 tax cuts to go ahead as originally legislated. Rather than a ‘cost to the budget’ these tax cuts could legitimately be cast as a reduction in costs imposed upon taxpayers by the Australian government. Semantics aside, there arises the question of whether the benchmark to which the ‘cost’ of the Stage 3 tax cuts was measured bears any relevance to the reality of personal income tax policy in Australia. In this section, we argue it does not.
The 2022 costing conducted at the Green’s behest estimates the tax revenue foregone from the introduction of the Stage 3 tax cuts, assuming personal income tax policy remains as it presently exists in 2023-24 over the course of the next nine years. Were it not for the increase in LMITO in 2021-22, and its subsequent conclusion in 2022-23, this is to assume that personal income tax policy would remain unchanged since the Stage 2 tax cuts of 2020-21. This amounts to a period of tax policy inertia spanning a full 12 years where the Australian government is assumed to allow bracket creep to continuously push up the tax rates imposed upon voting Australians.[39] Recent political history would suggest this is implausible. At no point in the past quarter of a century has bracket creep been left to run for more than three years, let alone the 12 assumed in the costing the Australian Greens requested of the PBO. The mere fact the government’s redesign of Stage 3 includes an — albeit modest — overall tax cut of $1.3 billion exposes this assumption as fanciful.[40]
This section presents an alternative costing of the Stage 3 tax cuts measured against a more relevant tax policy benchmark. This costing demonstrates the extent to which the estimates of the tax revenue foregone under the original third stage of the PITP, cited by proponents of its abolition, are dramatically inflated. The modelling compares the tax revenue reductions arising from the Stage 3 tax cuts to the tax policy in place in the year prior to the beginning of the PITP in 2017-18. This is to assume that the path of tax policy from 2024-25 will, on average, maintain the personal income tax take at 2017-18 levels (in real terms), effectively rolling back the PITP. This is a far more plausible tax policy counterfactual than one where Stage 3 is abolished in 2024-25 and bracket creep is left to run for almost a decade.
Figure 14A presents simulated estimates of total tax revenue over the period 2020-21 to 2032-33 under a number of different tax policy counterfactuals in $2020-21.[41] The figure also presents the total amount of net tax reported by the ATO in the 2020-21 edition of TaxStats, less Medicare levy. The method used to produce the simulated estimates incorporates gross personal income tax, LITO and LMITO in those years in which this tax offset was in place (2018-19 to 2021-22).[42] The simulated estimate of total personal income tax revenue for 2020-21 amounts to $221.6 billion only slightly more than the $218 billion reported by the ATO for that year.[43]
From 2024-25, the simulated estimates in Figure 14 suggest the abolition of the Stage 3 tax cuts would see total tax revenue[44] climb from $300.5 billion in 2024-25 to $399.2 billion by 2032-33 (black line). Were Stage 3 to go ahead as originally legislated, total tax revenue is estimated to fall by $7 billion in 2024-25, $20.4 billion less than if 2023-24 tax policy were to continue in 2024-25 (dark green line). Were Stage 3 to go ahead as originally intended, total tax revenue would increase to $370.3 billion by 2032-33.
Figure 14 Simulated (net) personal income tax revenue under alternative prospective tax policy settings, 2020-21 to 2032-33
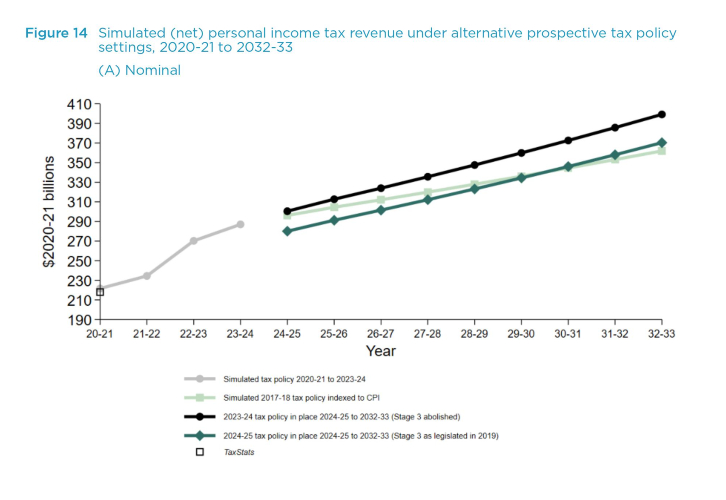
Before turning to the question of the total ‘cost’ of the Stage 3 tax cuts, it is worth noting that if the personal income tax policy parameters were indexed to CPI at their 2017-18 values, total tax revenue would increase from $296.2 billion in 2024-25 to $361.9 billion in 2032-33 (light green line). This illustrates how a more realistic tax policy benchmark, one where the current — and future — governments were able to roll back the PITP while delivering tax relief that maintains the tax take at pre-PITP levels, implies far lower total personal income tax revenue than the abolition of Stage 3 followed by almost a decade of bracket creep. In fact, this more plausible benchmark implies less (nominal) total tax revenue from 2030-31 compared to the Stage 3 tax cuts as these are ultimately eroded by bracket creep in that year.[45]
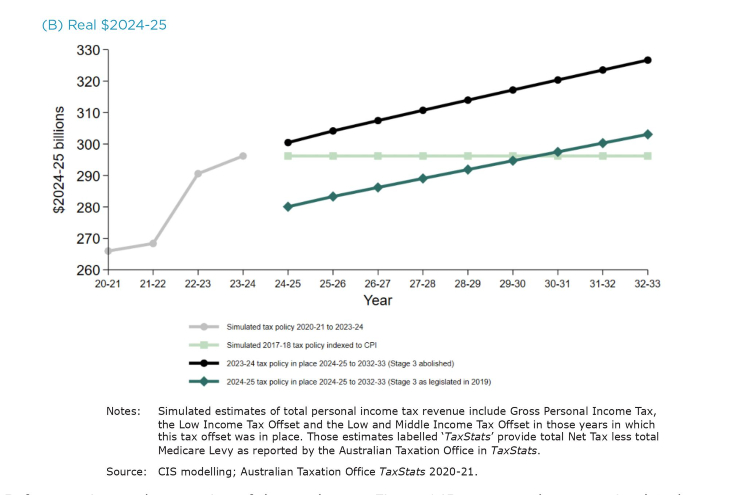
Figure 14B presents the same simulated estimates as Figure 14A in real terms ($2024-25). This figure emphasises how indexation of tax parameters from their 2017-18 levels would maintain total personal income tax revenue at $292.2 billion, in real terms.[46] The figure also emphasises how the assumption of unmitigated bracket creep over the course of nine years implies that the ‘cost’ of the Stage 3 tax cuts is around $20 billion in each year. When measured against a more plausible tax policy benchmark, the (real) ‘cost’ of the original Stage 3 tax cuts is closer to $16.1 billion in the first year but would contribute an additional $1.3 billion to tax revenue in 2030-31 — and more in the years thereafter. By 2032-33 the (original) Stage 3 counterfactual provides an additional $6.9 billion in tax revenue.
9.2 More plausible estimates of total income tax revenue foregone as a result of the original Stage 3 tax cuts
The 2022 PBO costing used by the Greens to argue that the Stage 3 tax cuts ‘cost a fortune’ put the total (nominal) reduction in revenue arising from the Stage 3 tax cuts at $240 billion over the nine-year period spanning 2024-25 to 2032-33.[47] The more recent costing puts the (nominal) revenue reduction over the period 2024-25 to 2033-34 at $323.6 billion over ten years.[48] The total revenue increase from the abolition of the Stage 3 tax cuts implied by the simulations in Figure 14 are $220.7 billion in nominal terms.
The objective of the costing presented in Figure 14 is not to replicate the PBO’s work, nor is it to criticise the methodology used by the PBO. Considering the differences in the ATO data used in these costings, different assumptions regarding the future trajectory of inflation and the different nominal values in which they are presented, the PBO’s estimates of the revenue reduction resulting from the Stage 3 tax cuts (as originally legislated) appear entirely plausible. There is nothing in our modelling to suggest the PBO’s costing should not be taken at face value. Provided, of course, that one believes current — and future — Australian governments will allow bracket creep to push up tax rates for more than 10 years. With this in mind, the difference between the $220.7 billion total revenue reduction over nine years implied by Figure 14A and the PBO’s 2022 costing are not as great as may first appear.
It is not the PBO’s costings that are at issue. It is the advocates for higher personal income taxes who presents these hundreds of billions of dollars of ‘costings’ as tax revenue that could be spent on their preferred social policies. Estimates presented as if they were tax revenue that would magically materialise following the abolition of Stage 3.[49] Such arguments are the stuff of fantasy peddled by those who are either unaware of — or find it ideologically convenient to omit — the reality of personal income tax policy of recent decades.
The costing presented in Figure 14B suggests a more plausible estimate of the (real) reduction in personal income tax revenue over the nine-year period from 2024-25 to 2032-33 would be closer to $39.7 billion, in real terms. This amounts to an annual average of just $4.4 billion. To place this in perspective, the Australian government intends to spend an additional $12.4 billion (in real terms) on social security and welfare next financial year. Much of this increase in expenditure is the result of expenditure on social security payments with means-tests and payment rates that are automatically indexed and inoculated from the impact of inflation.[50] This is in stark contrast to the treatment of taxpayers.
10. Conclusion
This report has emphasised the strength of income tax bracket creep — often correctly labelled a ‘stealth tax’ — in automatically lifting tax rates for all taxpayers in the absence of offsetting discretionary tax cuts.
It has argued that the neutral benchmark of tax policy evaluation is not unchanged thresholds year after year, but a tax scale with thresholds indexed annually for inflation. It is only tax cuts relative to this benchmark that are bona fide reductions in the tax burden. Moreover, sensible judgements cannot be based on any single year’s results but require analysis of the cumulative offsetting impacts of bracket creep and discretionary tax changes at different real income levels over a series of years.
Applying this test and using 2017-18 as the base year (the last year before the three-stage tax cuts of the PITP began), the Coalition government’s Stage 3 tax cuts would have delivered tax reductions greater than cumulative bracket creep in the seven years to 2024-25 for those on taxable incomes of roughly $50,000 to $224,000 (in 2024-25 terms). In annual average terms, this over-compensation would have been only around 0.5 per cent of taxable income for most taxpayers. Those above and below that range would have been undercompensated for bracket creep.
If we assess personal income tax policy against a 2010-11 policy benchmark — the last year of major tax cuts and the last in which high income earners received significant tax cuts before 2020 — most of the over-compensation disappears and all taxpayers above around $35,000 in 2024-25 terms would have been undercompensated for bracket creep over the 14 years to 2024-25. In annual average terms the under-compensation would be highest at 1-1.5 per cent of taxable income at middle incomes and at high incomes above about $230,000.
The changes wrought by the current government’s reconfiguration of the Stage 3 tax cuts increases the degree of under-compensation at higher incomes but has little effect at lower incomes because the additional tax cuts at those levels are very thinly spread.
This reveals that, were offsetting bracket creep the only objective, the previous government’s Stage 3 plans already failed to do so at high incomes. Furthermore, there was no justification for the current government’s reconfiguration to deny some of the planned tax cuts for those taxpayers simply on the grounds that they were set to pay $9,000 year less in tax in 2024-25 under Stage 3. This amount in isolation tells us nothing about their cumulative tax burden, considering the bracket creep they had paid in preceding years.
The lesson for future tax policy is that if tax thresholds were indexed to the CPI annually, relatively small downward adjustments to tax would be made once each year thereby avoiding the accumulation of tax revenue to fund larger but illusory discretionary ‘tax cuts’ every three to five years — or longer. Discretionary tax cuts in a world of indexed thresholds would be genuine, and if those in power at the time wished to change the distribution inherent in the indexed scale, they will have no choice but to be transparent regarding their intent.
If indexation is not adopted in future — and there is presently no sign that it will be — there should be a better understanding that under the current practice of discretionary tax cuts every several years, larger absolute dollar tax cuts at higher incomes are necessary unless average tax rates are to increase inexorably above a certain income level. Over time, that ‘certain’ level will become lower in real terms, capturing an increasing number of taxpayers, with all that implies for the effect of the tax system on incentive and aspiration.
Appendix
The costings of the Stage 3 tax cuts in section 9 are based on data from Table 3A of the 2020-21 edition of the ATO’s TaxStats publication. This table provides the total amount of taxable income with income groups nested in taxable status, gender and age group of taxpayers. In addition to taxable income, this table provides data on a range of measures relevant to personal income tax including the total amount of net tax paid, Medicare levy and various tax offsets.
The costing considers three policy counterfactuals assuming no further tax cuts subsequent to the 2024-25 tax year. These include:
- Tax policy as legislated in 2019, Stage 3 tax cuts provided in 2024-25 in the form originally intended;
- 2023-24 policy in place until at least 2032-33 (effectively abolishing Stage 3);
- 2017-18 policy, with income thresholds and tax offsets rates subsequently indexed to CPI.
The ATRs associated with each of these policy counterfactuals are simulated for each dollar of taxable income, in nominal terms, assuming that nominal taxable income grows by 2.8 per cent in 2025-26 and at the mid-point of the RBA’s inflation target range of 2.5 per cent per annum from 2026-27 to 2032-33. These (nominal) simulated estimates of net tax are discounted back to $2020-21 dollars and converted into ATRs.
The taxable income categories from the TaxStats table are then merged onto these ATR estimates. The average of the simulated ATRs is then calculated within each income group. The average ATR within each group is then multiplied by the total amount of taxable income within the income group to form an estimate of the total amount of tax paid by that group. Summing total tax revenue over each group provides an estimates of total personal income tax revenue for each policy counterfactual. This process is then repeated for the tax years 2024-25 to 2032-33.
This approach forms an estimate of the total tax paid by each income group under the policy counterfactual that essentially assumes the ATR within the income group is uniform. In light of the upward sloping nature of the ATR curves presented in Figure 1 and Figure 2, this assumption is clearly more problematic at lower levels of taxable income that at higher levels of taxable income. Fortunately, the income groups in the TaxStats table are quite narrow at the lower levels of taxable income where ATRs increase most abruptly with taxable income. They are therefore reasonably well approximated by the step function formed by averaging over the simulated ATRs within the income groups.
Despite the approximation error inherent to the method, the aggregate estimate of total personal income tax revenue for 2020-21 is quite close to that reported in TaxStats for that year. Total net tax less Medicare levy in the TaxStats table sums to $218 billion which is 3.6 billion lower than the $221.6 billion obtained by applying this approach to ATRs formed from a simulation of 2020-21 policy taking into account gross tax, LITO and LMITO. As can be seen in Figure 14A, the simulated estimate lies slightly above the TaxStats aggregate representing a percentage error of just 1.7 per cent.
The ATO’s Confidentialised Unit Record Files (CURFs) provide an alternative source of data with which to apply this method. The ATO CURFs provide a two per cent random sample of personal income tax records beginning in 2002-23 up until 2020-21. The ATO CURF data provides (appropriately confidentialised) dollar amounts of taxable income for those taxpayers sampled which has the advantage of allowing simulated ATRs to be applied to individual dollars of taxable income. This would negate the need to average simulated ATRs within income groups. However, the CURFs do not contain data on net tax and so the simulated estimates cannot be compared to the actual net tax paid by each income group in 2020-21. In addition, the sparse sampling of taxpayers with high taxable incomes results in an underestimate of total taxable income across a range of taxable incomes – even when appropriately weighted. Using the ATO CURFs to simulate net tax amounts would therefore require a re-weighting of the CURF data to ensure the aggregate estimates of taxable income are consistent with (a selected) TaxStats table relevant to the same financial year as the CURF. This approach will be pursued in future research.
References
ABS, 2023. Employee earnings – August, Canberra: Australian Bureau of Statistics.
ACOSS, 2024. Scrap stage three tax cuts to fund low-income cost of living relief. [Online]
Available at: https://www.acoss.org.au/media_release/scrap-stage-three-tax-cuts/
[Accessed 7 February 2024].
ATO, 2023. Taxation statistics 2020-21 Reference material. [Online]
Available at: https://www.ato.gov.au/about-ato/research-and-statistics/in-detail/taxation-statistics/taxation-statistics-2020-21/reference-material
[Accessed 13 February 2024].
Butler, J., 2022. Stage-three tax cuts: richest 1% of Australians will save as much as poorest 65% combined, analysis shows. [Online]
Available at: https://www.theguardian.com/australia-news/2022/aug/29/stage-three-tax-cuts-richest-1-of-australians-will-save-as-much-as-poorest-65-combined-analysis-shows
[Accessed 6 February 2024].
Carling, R. & Potter, M., 2015. Exposing the stealth tax: the bracket creep rip-off, Sydney: Centre for Independent Studies.
Chipman, L., 2004. The Very Idea of a Flat Tax, Sydney: Centre for Independent Studies.
Coates, B. & Moloney, J., 2024. Middle Australia wins from the government’s tax plan, but the budget is the biggest loser. [Online]
Available at: https://theconversation.com/middle-australia-wins-from-the-governments-tax-plan-but-the-budget-is-the-biggest-loser-222383
[Accessed 12 February 2024].
Costello, P. & Minchin, N., 2007. Mid-Year Economic and Fiscal Outlook, Canberra: Treasury.
Cowan, S. & Carling, R., 2024. Labor has gone a long way towards shredding its credibility. [Online]
Available at: https://www.canberratimes.com.au/story/8499327/labors-credibility-shredded-stage-three-tax-cuts-backflip-by-pm/
[Accessed 6 February 2024].
Davidson, S., 2004. Who Pays the Lion’s Share of PersonalIncome Tax?, Sydney: Centre for Independent Studies.
Hawkins, P., 2021. Budget Review 2021–22 Index: Extension of the Low and Middle Income Tax Offset (LMITO). [Online]
Available at: https://www.aph.gov.au/About_Parliament/Parliamentary_Departments/Parliamentary_Library/pubs/rp/BudgetReview202122/ExtensionLowAndMiddleIncomeTaxOffset
[Accessed 7 February 2024].
Janda, M., 2024. Are Labor’s stage 3 tax cut changes good economic policy, good politics, or both?. [Online]
Available at: https://www.abc.net.au/news/2024-01-26/are-labor-stage-3-tax-cut-changes-good-economic-policy/103390620
[Accessed 12 February 2024].
Kwan, B., 2024. PM announces changes to stage three tax cuts. [Online]
Available at: https://www.sbs.com.au/news/podcast-episode/pm-announces-changes-to-stage-three-tax-cuts/zvlpxv8et
[Accessed 9 February 2024].
Morrison, S., 2016. Tax relief for average full-time wage earners introduced to Parliament. [Online]
Available at: https://ministers.treasury.gov.au/ministers/scott-morrison-2015/media-releases/tax-relief-average-full-time-wage-earners-introduced
[Accessed 7 February 2024].
PBO, 2022. Stage 3 tax cuts distributional analysis, Canberra: Parliamentary Budget Office.
PBO, 2024. Distributional analysis of the Stage 3 tax cuts, Canberra: Parliamentary Budget Office.
Phillips, B., 2022. That $243 billion ‘saving’ from axing the Stage 3 tax cut is more mirage than reality. [Online]
Available at: https://theconversation.com/that-243-billion-saving-from-axing-the-stage-3-tax-cut-is-more-mirage-than-reality-190350
[Accessed 6 February 2024].
Phillips, B., 2024. Stage 3 stacks up: the rejigged tax cuts help fight bracket creep and boost middle and upper-middle households. [Online]
Available at: https://theconversation.com/stage-3-stacks-up-the-rejigged-tax-cuts-help-fight-bracket-creep-and-boost-middle-and-upper-middle-households-221851
[Accessed 9 February 2024].
Phillips, B., Gray, M. & Joseph, C., 2023. Budget 2023 Distributional Analysis, Canberra: ANU Centre for Social Research and Methods.
Phillips, B., Gray, M. & Webster, R., 2020. Modelling Coalition Personal Income Tax Policies 2017 to 2029, Canberra: ANU Centre for Social Research and Methods.
Pocock, B., 2022. First Speech – Barbarra Pocock. [Online]
Available at: https://greens.org.au/news/speech/first-speech-barbara-pocock
[Accessed 3 February 2024].
Ransley, E., 2024. Public servants reveal changes to stage 3 tax cuts Treasury department’s idea, not government’s. [Online]
Available at: https://www.news.com.au/finance/money/tax/public-servants-reveal-changes-to-stage-3-tax-cuts-treasury-departments-idea-not-governments/news-story/f924fee9639ec012479fe871fe2da3f4
[Accessed 9 February 2024].
RBA, 2024. Statement on Monetary Policy – February 2024, Sydney: Reserve Bank of Australia.
Swan, W., 2012. Budget speech 2012-13, Canberra: Treasury.
Taylor, M., 2015. Tax Misconceptions in High Places. Policy, 31(1), pp. 35-42.
Tilley, P., 2023. 3-stage tax cuts versus bracket creep, Canberra: Tax and Transfer Policy Institute.
Treasury, 2023. 2023-24 Budget Paper No. 1 Budget Strategy and Outlook, Canberra: Treasury.
Treasury, 2024. Advice on amending tax cuts to deliver broader cost-of-living relief, Canberra: Treasury.
Wood, D., Griffiths, K. & Cowgill, M., 2019. Budget blues: why the Stage 3 income tax cuts should wait, Melbourne: Grattan Institute.
Endotes
[1] This refers to gross tax, that is tax payable prior to the deduction of non-refundable tax offsets like the Low Income Tax Offset (LITO) and does not include Medicare levy or the Medicare levy surcharge (where applicable). See ATO (2023) for further details.
[2] The distinction between marginal tax rates and ATRs has sometimes confused even those who have sat on the Treasury benches, see Taylor (2015).
[3] The hypothetical annual 2023-24 taxable incomes in this section are sourced from Table 2 of ABS (2023). This publication provides estimates of median weekly employee earnings across age groups from the ABS Characteristics of Employment survey conducted in August 2023 as a supplement to the monthly Labour Force Survey. Dee’s 2023-24 taxable income is that median for those aged 20 to 24 multiplied by 52. Charlie and Franks taxable incomes are defined analogously using estimates of the median for those aged 15 to 19 and 35 to 44 respectively.
[4] These very simple hypotheticals quite clearly do not represent how those with these levels of taxable income would be impacted under actual 2024-25 personal income tax policy which will include the, now revised, Stage 3 tax cuts. These hypotheticals assume 2023-24 policy remains in place in 2024-25 and beyond, and only considers gross tax.
[5] This curve is formed by applying the 2023-24 personal income tax rates and thresholds to taxable incomes that are 5 per cent higher to form a simulated estimate of (nominal) gross tax. These simulated estimates are then discounted back to $2023-24 dollars to form an estimate of gross tax in real terms. The ATR curve for 2024-25 is then these (higher) estimates of gross tax, in real terms, divided by real taxable income in $2023-24.
[6] Note that taxpayer’s nominal incomes need not literally ‘creep’ into a higher tax bracket for their ATRs to be increased, though nominal income growth would ultimately move Charlie into the $45,000 to $120,000 tax bracket in 2027-28.
[7] The merits of flat personal income taxes have been explored in earlier CIS research. See Chipman (2004) and Davidson (2004).
[8] Nominal growth in incomes, in excess of increases in CPI, would continue to push up tax rates but this would at least reflect an increase in capacity to pay tax. See Carling & Potter (2015) for an argument in favour of tax threshold indexation to average nominal wage growth.
[9] For example, ACOSS (2024) and Pocock (2022).
[10] These are the forecasted rates of inflation reported by the Reserve Bank of Australia in their February 2024 Statement on Monetary Policy (RBA, 2024). The assumption that taxable income grew at the same rate as inflation over the time periods considered in the modelling is a conservative one. A comparison of the percentiles of taxable income reported in Table 16A of the 2020-21 edition of the ATO’s TaxStats, with those in Table 16A in the 2017-18 edition, suggests each percentile grew by more than inflation over this period. A comparison of the 2020-21 table with Table 14 in the 2010-11 edition points to a similar conclusion.
[11] According to the August 2023 release of ABS Employee Earnings, median weekly earnings among full-time employees was $1,600 (ABS, 2023). These simulated ATRs apply to a median wage earner with no taxable income other than wages.
[12] As explained in Hawkins (2021), the LMITO was originally intended to end after the 2020-21 tax year but was retained for an additional year. The Stage 2 cuts, initially meant to begin in 2022-23, were brought forward to 2020-21. As a result, lower income earners received additional tax reductions in 2020-21 and 2021-22 than was originally intended.
[13] Median wage earner in this context refers to someone with 2024-25 taxable income, equal to median earnings in August 2023, who had a level of nominal income in 2020-21 that was equivalent when converted to $2024-25. The increase in their ATR assumes their nominal taxable income matched growth in the CPI.
[14] Income tax increases typically come in the form of temporary levies like the 2011-12 Flood levy on those with taxable incomes above $50,000 and the Budget Repair levy of 2014-15 to 2016-17 on those with taxable incomes above $180,000. The Medicare levy has also been increased from time to time, most recently it was increased from 1.5 per cent to 2 per cent by the Gillard government in 2014-15.
[15] It should be emphasised that Figure 4 is intended to summarise one of the two forces that determine how the tax system impacts the total amount of tax paid in real terms. The sum of the components of the figure does not represent cumulative tax cuts received over the period. Figure 4merely shows how the discretionary tax policy of the period will have shifted the ATRs at different levels of (real) taxable income in the years in which they were implemented. The vertical sum of its components does not provide the total benefit of the tax cuts provided since 2017-18. The total amount of tax actually paid over the period incorporate the cumulative impact of each of these tax cuts set against the cumulative impact of bracket creep they were (ideally) intended to offset. For example, the benefit provided by the Stage 1 tax cuts, as presented in Figure 4, will have been partially offset by the bracket creep of that financial year but more so by the bracket creep of 2019-20 that was not accompanied by a tax cut. While the Stage 3 tax cuts, as originally intended, were to provide significant tax relief in 2024-25 this tax cut would only reduce ATRs in the final year of the period under consideration in the figure.
[16] Were one to present year-on-year changes in tax paid, for only those years in which tax policy parameters were the subject of policy change, one would produce a graph that would bear some similarity to Figure 4. The difference would be the tax cuts that appear above the horizontal axis would be thinner as they would not include the bracket creep that would otherwise have occurred. Another difference would be the tax increase that appear below the horizontal axis would be thicker as these would include the bracket creep component that would have occurred regardless of the tax increase.
[17] The vertical sum of the components of Figure 5 is not total bracket creep paid over the period 2017-18 to 2024-25. Figure 5 presents the impact of nominal income increases on ATRs at different levels of (real) taxable income. It is more accurately thought of as the bracket creep for each financial year that would need to be offset by a tax cut to keep tax paid at the same level as the previous year. This amount will have been shaped by previous year’s tax policy and nominal income growth up to that point in time.
[18] The last time the top tax threshold was increased, from $150,000 to its current level of $180,000, was 2008-09. Though implemented by the Rudd government this reform had been announced by the Howard government in the 2007-08 Mid-Year Economic and Fiscal Outlook (Costello & Minchin, 2007). This financial year also saw increases in the second and third tax thresholds.
[19] Prime Minister Kevin Rudd was removed from office by his own party shortly before the beginning of the 2010-11 financial year.
[20] To quote from the then Treasurer’s budget night speech ‘…families and pensioners are receiving further assistance through higher payments and tax cuts to help transition to a clean energy future.’ Swan (2012, p. 4).
[21] These amounts are in real $2024-25. In terms of nominal dollars in these financial years, the first effective tax threshold (taking into account LITO) increased from $16,000 to $20,500.
[22] See Morrison (2016) for the political framing of these 2016-17 tax cuts.
[23] For example ACOSS (2024) and Pocock (2022).
[24] See Wood, Griffiths & Cowgill (2019, p. 17). These authors also suggest that ‘…if the Stage 3 cuts pass, the income tax system in 2024-25 will be less progressive than it has been at any point since the 1950s.’ (Wood, et al., 2019, p. 3).
[25] This is a slightly higher level of taxable income compared to that presented in Tilley (2023). The difference appears to be mostly driven by the omission of Medicare levy in the modelling presented here, and to a lesser extent differences in assumptions about the path of CPI growth.
[26] A government could structure a suite of tax cuts that were regressive relative to a benchmark year to compensate high income earners before subsequently returning ATRs to where they were in the benchmark year.
[27] The 2012-13 tax cuts were of negligible benefit to those with taxable incomes above approximately $109,000 ($2024-25). The provision of tax relief via tax offsets like the LMITO is a means of excluding high income earners from a tax cut, the 2018-19 introduction of LMITO provided no benefit to those with taxable incomes above $156,000 though these levels of taxable income would have received a modest benefit from an increase in the third tax threshold. Only those with taxable incomes below $144,000 benefited from the 2021-22 increase in the rates of LMITO.
[28] According to the 2020-21 edition of the ATO’s TaxStats the 5.3 per cent of taxpayers with taxable incomes above $180,000 contributed 35.4 per cent of total net tax in that financial year.
[29] Kwan (2024).
[30] Ransley (2024).
[31] Diane Brown quoted in Ransley (2024).
[32] Treasury (2024).
[33] See Phillips (2024) and Chart 7 on p. 7 of Treasury (2024).
[34] This is not to say the average cumulative tax reduction will necessarily be smaller. The Treasury modelling that indicates the revised Stage 3 package will reduce total personal income tax over the forward estimates would suggest there will be tax reductions on average.
[35] The political case for this is self-evident as there are more taxpayers with taxable incomes below $146,486 than above. See p. 9 of Treasury (2024) for an economic argument pertaining to labour supply incentives, points echoed by some of those quoted in Janda (2024).
[36] Wood, Griffiths & Cowgill (2019) argue the original Stage 3 tax cuts overcompensate high income earners. Their modelling, conducted prior to the changes in the original PITP precipitated by the Covid 19 pandemic, suggests that were Stage 3 to be implemented as intended (and bracket creep left to run up to 2029-30) all but the top 15 per cent of taxpayers would face higher tax rates than in 2017-18. In contrast to the analysis presented in Figure 4 and Figure 8 to Figure 11, this does not take into account bracket creep incurred prior to the introduction of (original) Stage 3 tax cuts. See also Coates & Moloney (2024) for prospective modelling with a specific focus on the Stage 3 redesign announced in January.
[37] See Parliamentary Budget Office (2022).
[38] See Parliamentary Budget Office (2024).
[39] This point has previously been made by others. See Phillips, Gray & Webster (2020), Phillips (2022), Phillips, Gray & Joseph (2023) and Cowan & Carling (2024).
[40] Treasury (2024).
[41] As indicated in the appendix, this costing presented in this report is based on data from the ATO pertaining to the 2020-21 financial year. The nominal values of the simulated estimates that form the costing are therefore more in line with the nominal values presented in the earlier PBO costing conducted in July 2022.
[42] The appendix outlines the methodology used to produce the simulated estimates of total revenue in Figure 14.
[43] The 2020-21 edition of TaxStats is the most recent data available at the time of writing. The difference between the simulated estimate for 2020-21 and the official estimate amounts to a percentage error of just 1.7 per cent.
[44] Defined here as total net tax less total Medicare levy receipts.
[45] These simulated estimates of total net tax, were the original Stage 3 tax cuts to go ahead, are $3.5 billion dollars more (in nominal terms) in 2030-31 compared to the indexation scenario. Phillips, Gray & Webster (2020) use a different costing methodology and index tax thresholds to nominal wage increases. Their approach suggests a comparison of the original Stage 3 tax cuts to a 2017-18 policy counterfactual indexed to wages would result in more personal income tax revenue from 2029-30.
[46] The costing assumes the number of taxpayers remains fixed over time. In reality, were tax parameters to be indexed to CPI, total tax revenue would continue to increase as population growth increases the number of taxpayers. The same would be true were growth in taxable income, per taxpayer, to exceed growth in CPI.
[47] Adam Bandt MP, quoted in Butler (2022).
[48] Were it not for the addition of the 2033-34 financial year in the January 2024 costing, it would show a total revenue reduction of $279.2 billion over the nine-year period 2024-25 to 2032-33.
[49] See for instance Adam Bandt MP, quoted in Butler (2022).
[50] See Treasury (2023).