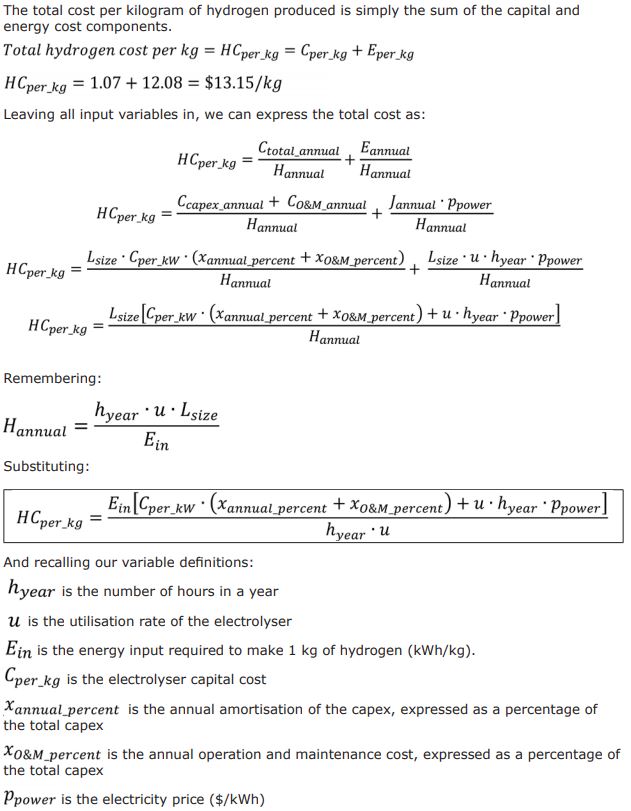
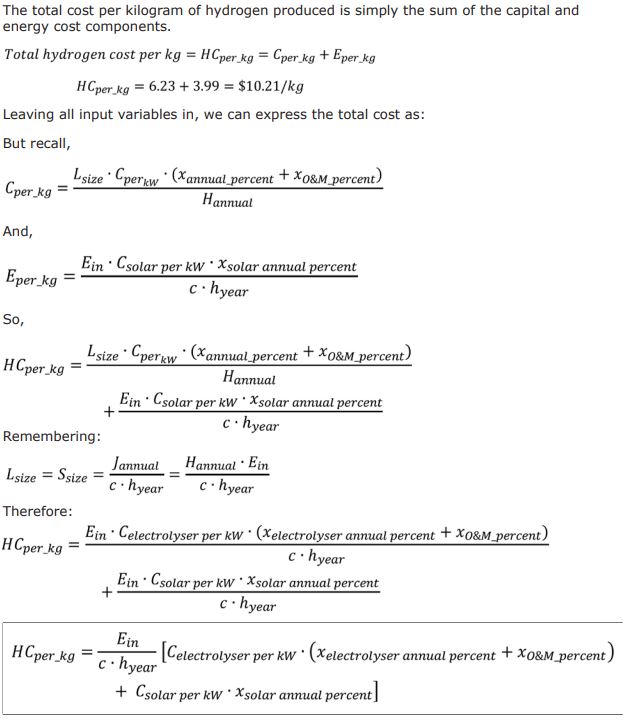
Executive Summary
Green hydrogen is often heralded as a cornerstone of Australia’s net zero ambitions, but the reality is that it is not viable today, and won’t be in the foreseeable future. This paper examines the reasons green hydrogen will likely remain prohibitively expensive, why projects are stalling, and how the recently announced Orica subsidy exposes Australia’s strategy as untenable.
Hydrogen is intended to play a critical role in Australia’s decarbonisation plans. Beyond replacing grey hydrogen (produced from natural gas) in chemical manufacturing, green hydrogen — produced via electrolysis using renewable energy — is envisioned for advanced applications like green metals production, long-haul transport, and electricity grid support.
However, green hydrogen’s high production costs and operational challenges threaten these ambitions. The fundamental issue lies in the energy-intensive nature of electrolysis. Producing 1kg of green hydrogen requires 53 kWh of energy — equivalent to powering a typical home for 3 days. This energy demand, coupled with high capital costs for electrolysers, makes green hydrogen expensive.
Grid-connected electrolysers can theoretically operate at high utilisation rates, but face costly firmed electricity prices, while renewable-connected systems designed to absorb surplus solar power would suffer from low utilisation rates aligned with renewable capacity factors.
Sensitivity analyses show that even with optimistic assumptions around future costs of technology or electricity, green hydrogen costs realistically exceed $10/kg, far above the $2/kg market price of grey hydrogen. This gap necessitates subsidies of approximately $8/kg to compete, a scale that becomes astronomical when applied to national or export ambitions.
The challenges extend beyond production. Applications like long-haul transport and steelmaking require storage and transportation, which are hindered by hydrogen’s high compression or liquefaction costs (12–36% of energy content). Fuel cell applications for transport must grapple with a round-trip energy efficiency below 30%, and hydrogen’s volatility and embrittlement of metals increase safety and maintenance costs. These factors further erode the economic case for hydrogen in hard-to-electrify sectors.
The Orica deal exemplifies the exorbitant cost of green hydrogen. The NSW and federal governments’ $547 million subsidy for just 4,700 tonnes of hydrogen annually — 7.5% of Orica’s current usage — equates to $10.99/kg in subsidies, far exceeding the government’s $2/kg Hydrogen Production Tax Incentive. This implies a carbon abatement cost of $915–$1,569/tonne CO2, 26–44 times higher than the price of Australian Carbon Credit Units (ACCUs) at $30-$40/tonne. Scaling this to replace Orica’s full hydrogen needs would require $7.3 billion — close to the market capitalisation of the entire company. At this rate, replacing Australia’s 500,000 tonnes of annual industrial hydrogen use would require $58b in subsidies, while producing 15 million tonnes for green energy exports could demand $3.19 trillion.
The reliance on subsidies, even for the simplest use case of on-site chemical production, suggests that more complex applications are even less viable. The Orica project exposes a push to prop up a technology whose costs are driven by immutable physical constraints, raising serious questions about the feasibility of Australia’s green hydrogen strategy.
It is essential that Australia removes unrealistic assumptions about green hydrogen from official plans, including the Integrated System Plan, to prevent us committing today to investments and strategies which have no real prospect of success.
Introduction
Hydrogen has been ‘the future’ at least four times. The simplest of elements, itappears to have an intoxicating allure to the modern mind, capable of generating sequential waves of official enthusiasm about its potential, without any of the expectations coming to fruition. A single proton-electron pair, coupled up to form molecules of H2 has an array of eye-opening properties. It is extremely light — the lightest thing in existence — and can burn with, or otherwise combine with, oxygen to release vast amounts of energy. By mass, it has the highest energy density of any chemical — 120MJ/Kg — more than double that of diesel.
But the juxtaposed energy density, with physical un-density has made the hydrogen hand a difficult one to play into many practical applications. A few other eccentric chemical properties, such the capacity to embrittle metals, and burn at extreme speeds and temperatures, add to the challenges.
The first hope for hydrogen was for it to be the lift-gas that would enable the airship, by which “man will crown his conquest of the air”.[1] In 1930, the British Labour Air Minister Lord Christopher Thomson dreamed up the Imperial Airship Scheme to connect the far-flung outposts of the British Empire through the new medium of the air.[2] Yet Thomson was tragically killed on R101’s first overseas voyage to India in October 1930, when the ship crashed in France, killing 48 of the 54 people on board[3] A few years later in 1937, the Hindenburg burned over Lakehurst, New Jersey.[4] The technology had enjoyed enormous official backing and utopian rhetoric, but mass uptake never arrived, particularly as airplanes had grown in popularity and taken over long-distance travel.
Hydrogen saw another ‘false dawn’ in the 1970s,[5] a decade in which oil shocks and concerns about fossil fuel depletion in the face of exponential growth in global primary energy use were at the fore.[6] In 1970, the electrochemist John Bockris coined the term ‘hydrogen economy’ during a discussion at the General Motors Technical Center in Warren, Michigan, envisioning a future in which hydrogen was used as an alternative to fossil fuels.[7] The year after the 1973 oil crisis, The Hydrogen Economy Miami Energy Conference saw 750 participants from 80 countries gathered to promote hydrogen as an energy source, which led to the creation of the International Association for Hydrogen Energy.[8] The International Energy Agency was established in 1974, with a key aim to respond to the global oil crisis by exploring alternative technologies such as hydrogen, with nuclear energy widely considered as an option to produce both electricity and abundant and cheap hydrogen.[9] But interest in hydrogen once again waned, as the oil embargo lifted, new fossil fuel sources were exploited and oil prices fell.[10]
The hydrogen dream came back with a vengeance once again in the ‘false dawn’ of the 1990s and 2000s. In the late 1990s, automobile and power companies were spending billions in pursuit of making cars that could “go 5000 miles between fill-ups” and electric power plants you could “buy like appliances”.[11] In his 2003 State of the Union address, George W. Bush launched a US$1.2b Hydrogen Fuel Initiative, promising that “with a new national commitment, our scientists and engineers will overcome obstacles… so that the first car driven by a child born today could be powered by hydrogen, and pollution-free.”[12] But by 2009, the Obama administration was slashing hydrogen car funding. Energy secretary Steven Chu explained the U-turn in strikingly plain language: “We asked ourselves, ‘Is it likely in the next 10 or 15, 20 years that we will convert to a hydrogen car economy?’ The answer, we felt, was ‘no’.”[13] This prediction turned out to be correct — since then, less than 20,000 hydrogen cars have been sold across the US, mostly being confined to California where taxpayer funding supported the development of public fuelling stations.[14]
Despite the failure of a ‘hydrogen economy’ to emerge after decades of grand promises and boatloads of funding, Australian policymakers have not proven immune to hydrogen’s spell. One key recent example of this is the subsidy package given to Orica’s Kooragang Island facility in the Hunter Valley. In contrast to transformational visions of transport and electricity, this facility epitomises some of the mature industrial use-cases of hydrogen, namely the production of ammonia for use in fertiliser and bulk explosives. On July 4, 2025, Chris Bowen announced a $432m federal subsidy for green hydrogen to replace just 7.5% of the natural gas used to produce hydrogen at the plant.[15] Orica had previously received $45m from the New South Wales government,[16] and $70m from the federal government[17], bringing the total for the project to $547m.
In the history of hydrogen subsidies, half a billion dollars may not even raise eyebrows, let alone concern. But those unfamiliar with the more technical aspects of the net zero plan — and particularly green hydrogen’s role in the energy transition — will miss the alarming reality exposed by the scale of this subsidy, for such a small impact on an existing use-case for hydrogen. By the numbers, this announcement is the most damning indictment of Australia’s energy transition plan to-date.
To understand why, we must first understand green hydrogen’s role in Australia’s net zero plan — the hopes and dreams held for hydrogen in a decarbonised future. We must also identify the fundamental physical challenges in the production of hydrogen that make it permanently expensive, as ‘false dawn’ after ‘false dawn’ has proven. Understanding hydrogen’s designated role in the energy transition and its fundamental physical attributes will reveal why the Orica deal exposes those challenges.
1. Hydrogen is the panacea we are relying on to make net zero work
For over 100 years, hydrogen has been a vital feedstock for industrial chemical production. It is generally made from methane in a process known as steam reforming, and combined with nitrogen to produce ammonia, which is then used to produce fertilisers, explosives, and numerous other chemicals. In Australia, about 500,000 tonnes of hydrogen is currently produced annually for these uses.[18] This accounts for roughly 1% of the nation’s total greenhouse gas emissions.[19]
But future uses for hydrogen are far more expansive than these relatively minor applications. In a decarbonised world, ‘green hydrogen’ produced by electrolysing water with renewable energy is intended to replace ‘grey hydrogen’ made from natural gas, not only in ammonia production for fertilisers and explosives, but for a variety of other applications. These uses are increasingly baked into official planning documents.
The so-called ‘energy transition’ has three main challenges:
- Decarbonising the electricity grid;
- Electrifying other sources of emissions;
- Abating or otherwise offsetting the hard-to-electrify sources of emissions.
Hydrogen is touted as the future fuel for the third of these challenges. The National Hydrogen Strategy outlines the role that hydrogen plays in the government’s net zero plans.[20] Its many uses include green metals production, long haul transport, and power generation for the grid.
CSIRO and Climateworks estimate that in 2050, hydrogen will make up 3–4% of final energy demand across NEM-connected states (16% in a hydrogen export scenario),[21] with many advocates such as the Superpower Institute advocating for extensive use in industry to create energy-intensive processed products for export as part of a ‘green superpower’ strategy.[22]
The past half-decade of AEMO’s Integrated System Plan (ISP) — Australia’s official energy transition plan for the electricity grid — documents show a journey toward greater use of hydrogen.
The ISP first mentioned hydrogen in 2020 as having “the potential to meet some of Australia’s energy needs, once it is economically competitive and the possible challenges to efficient sector integration are resolved”, but the plan did not attempt a quantitative analysis of its use in the energy system “as the industry remains in the early stages of development”.[23]
The 2022 ISP was the first to include a specific ‘Hydrogen Superpower’ scenario, where extra electricity demand is modelled for hydrogen production, to export supposedly abundant renewable energy. Even outside this scenario, hydrogen is considered as a potential fuel for both grid [24]and transport.[25]
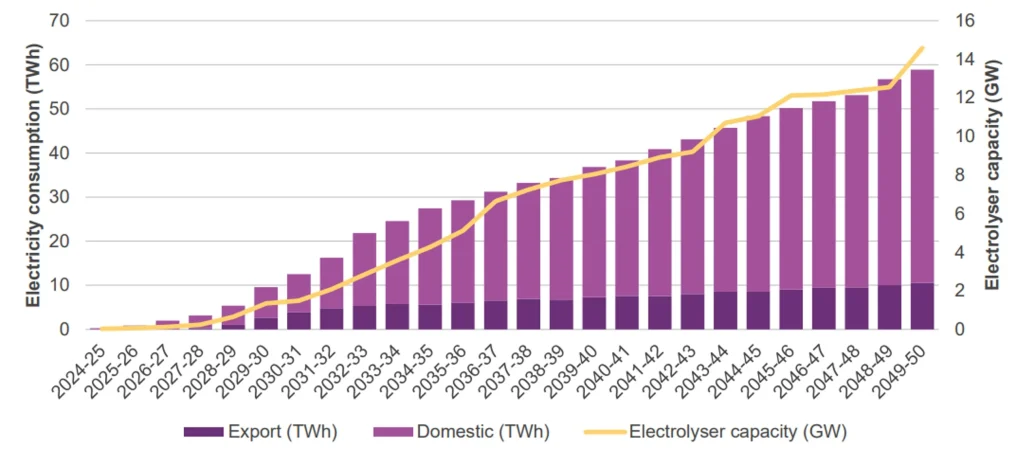
In the 2024 ISP, hydrogen’s role was significantly expanded to include its use in all scenarios to varying extents. Even the ‘Step Change’ scenario, presented as the central case, assumes significant electricity consumption for hydrogen production (Figure 1).[26]
Figure 1 – AEMO ISP – Electricity consumption associated with hydrogen production and ammonia conversion, Step Change
In particular, a ‘solar soak’ role begins to be modelled in the grid, with “large industrial users, including hydrogen production … set to take most advantage of surplus renewable generation when it is available, particularly during daylight hours”.[27] The ISP assumed electrolysers would “operate flexibly, potentially reducing electricity consumption when renewable energy resources are limited … and consuming more during daylight hours when excess solar energy is abundant”.[28]
Figure 2 – AEMO ISP – Projected week of hydrogen electrolyser load in Queensland in 2040, Step Change (GW)
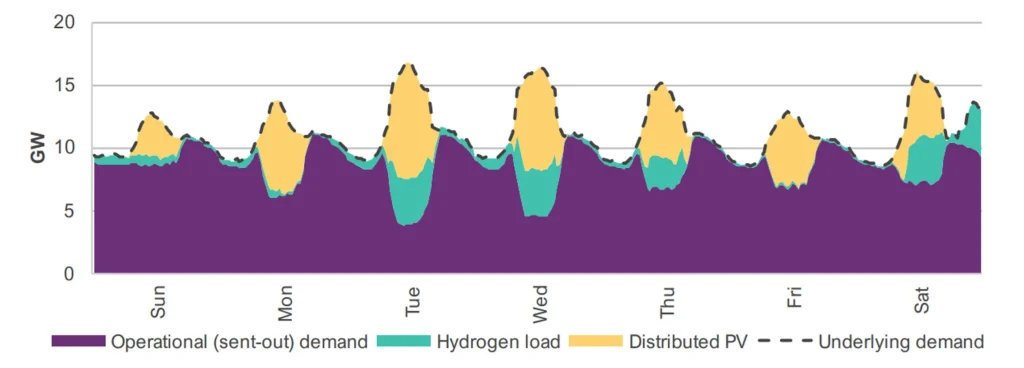
As seen in Figure 2, the utilisation rate of hydrogen electrolysers regularly falls close to zero. Hydrogen electrolysers are modelled as being available to soak up excess solar output and can switch off during periods of low generation.
Hydrogen load in this ISP modelling is therefore expected to lift minimum demand and have minimal impact at times of peak demand. It is also expected to be technically capable of providing flexibility by turning off for whole days when weather conditions are unfavourable, depending on the commercial implications of doing so.[29]
In the AEMO plans, the role hydrogen plays is not simply an extra way to use cheap power, but a critical part of system stability. Appendix 4 of the 2024 ISP noted that “during summer, demand profiles exhibit lower midday troughs due to higher distributed PV output”.[30] This presented an issue of a large gap between the demand and supply of power in the middle of the day, since this is also when grid-scale solar is at its peak output. If demand does not match supply, the system breaks down. The ISP solved this problem by forecasting large increases in demand from hydrogen production, noting that “in the absence of hydrogen production, the average midday summer demand would be only 15 GW in 2049-50”.[31] These hydrogen loads are not trivial, but represent roughly 15 GW of peak demand.[32] Figure 3 demonstrates that the planned average summer demand is between 25 and 30 GW.[33] This means that without hydrogen, the system could be facing instances where only 50% of generation is met by demand — a critical stability risk.
Figure 3 – AEMO ISP – Operational sent-out demand average time-of-day forecasts, summer and winter, Step Change
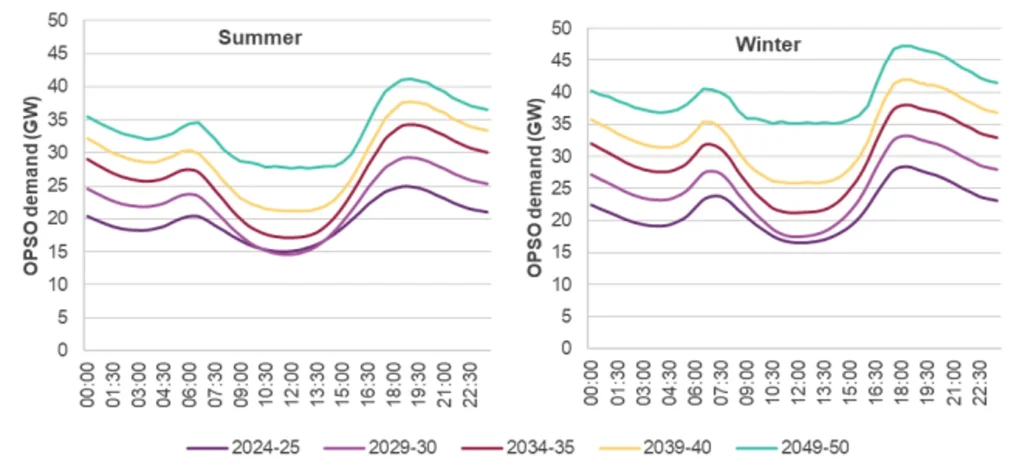
Not only are these electrolysers forecast to operate infrequently (when the sun shines), but also seasonally — contributing more to the demand gap in summer than in winter. This must necessarily result in miniscule utilisation rates. However, hydrogen electrolysers are capital-intensive, and maintaining high utilisation rates is key to their profitability. Likewise, most industrial manufacturing requires steady-state operation. The ISP addressed these challenges in Appendix 2, and concluded, sensibly, that “higher electrolyser utilisation factors (90%) combined with daily hydrogen production requirements is forecast to need greater renewable energy and an even greater amount of utility-scale storage”[34] — all of which substantially raises costs.
It is clear hydrogen does not represent a minor part of our future energy system. It is not merely a bonus industry that could be enabled in a hypothetical future world of abundant green energy. Green hydrogen is intended to form a core part of Australia’s future energy system, and play a critical stabilising role. Without it, the future grid that is being planned will not function. Yet the extent to which our official plans rely on hydrogen belies the major challenges facing the industry. The major recommendation of this paper is to heed the difficulty with which green hydrogen is currently being implemented, and remove the reliance on hydrogen from the government’s energy system and net zero planning.
2. Yet things are not going well for hydrogen
Despite the global hype, green hydrogen projects are not keeping pace with hopes or expectations. Recent analysis by Rystad Energy indicates 99 percent of the announced capacity of hydrogen projects have not progressed beyond the concept or approval stage.[35]
In Australia, there have been several high-profile cancellations of major projects in recent years:
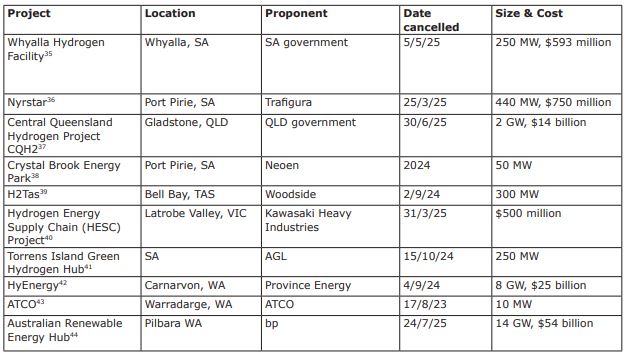
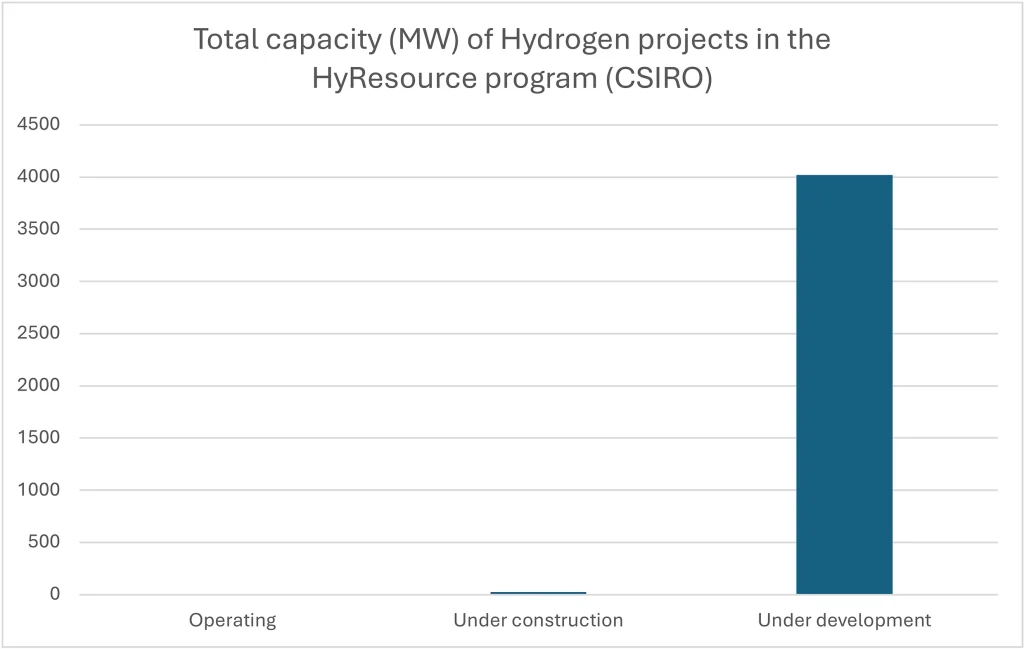
Despite this, there remain 87 projects still forging ahead, according to the CSIRO HyResource database.[46] Yet of these, almost all of them are listed as ‘under development’ (Figure 4).
Figure 4 – Status of hydrogen projects in the CSIRO HyResource database, by capacity
Why is this? If the opportunities in Australia for hydrogen are so great, why is the industry struggling to make headway?
3. Green hydrogen is fundamentally and immutably expensive
Green hydrogen’s most basic use-case is to replace the grey or blue hydrogen in chemical manufacturing processes. The more advanced use-cases include powering fuel cells for long-haul transportation, or turning hydrogen into ammonia to power ships, but these involve extra steps of storage and transportation.
If the economics do not stack up for the most basic use case, more advanced use cases are clearly not viable, rendering optimism about future use void.
We analyse the cost for the basic use case below.
3.1 Manufacturing hydrogen is expensive
Green hydrogen’s fundamental flaw is the energy intensiveness of the production process. Water is a tightly bonded molecule, and it takes a lot of energy to split the bond between hydrogen (H2) and oxygen (O). Chemistry sets the floor — the absolute minimum amount of energy required — of 39.4 kWh/kg H2 at 100% efficiency,[47] with typical electrolysers requiring around 53 kWh/kg H2.[48] To put this into perspective, 53 kWh could lift a 1-tonne object 19.5km vertically, or power a modern electric vehicle for 350km, or power a typical home for 3 days, or run a 2kW space heater for 26 hours.
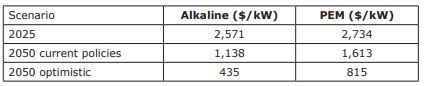
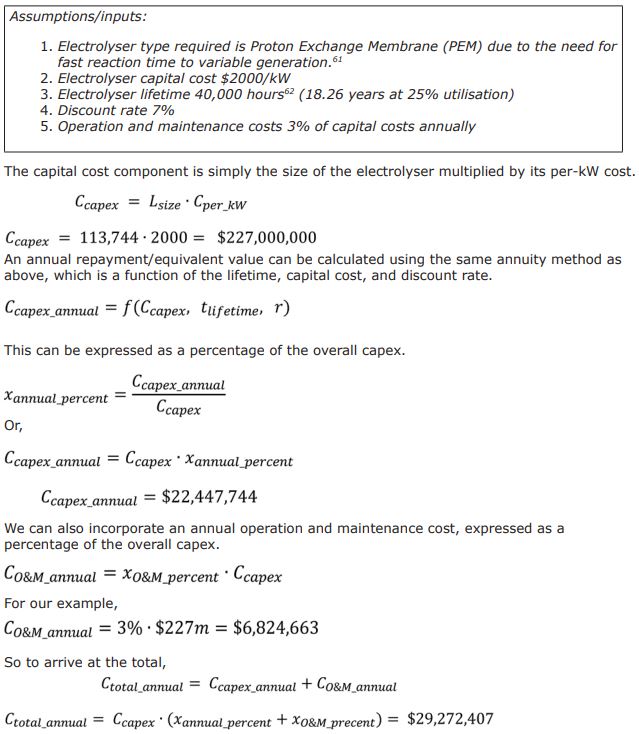
But energy is not the only expensive aspect. Electrolysers are costly pieces of equipment, with prices ranging from $1200-2400/kW installed capacity. There are two main types of electrolysers — alkaline and proton exchange membrane (PEM). Alkaline is suited to steady-state operations, whereas PEM has a wider range of operation, making it more suited to fluctuating renewable power.
CSIRO’s GenCost report places the cost of alkaline electrolysers at $2,571/kW, and PEM at $2,734/kW.[49]
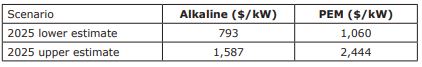
Bloom Energy, an electrolyser manufacturer, gives a more optimistic cost range[50]:
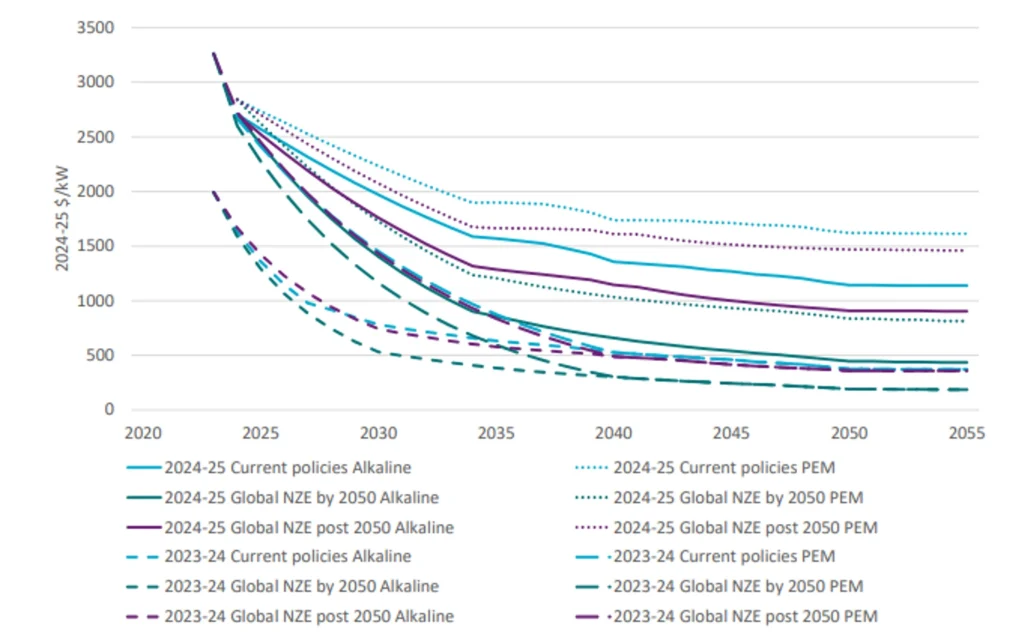
The GenCost report has an optimistic cost curve for predicted future prices of hydrogen electrolysers (Figure 5).[51]
Figure 5 – CSIRO GenCost – Projected technology capital costs for alkaline and PEM electrolysers by scenario, compared to 2023-24
We will demonstrate that even at very optimistic electrolyser prices, green hydrogen remains prohibitively expensive to produce.
3.2 Cost of steady-state green hydrogen from firmed power
Consider a simple grid-connected electrolyser. If grid (firmed) electricity is used, the electrolyser can be highly utilised in a relatively steady state, which allows for a smaller sizing of a cheaper type of electrolyser (alkaline). However, higher power prices must be factored into this calculation to account for highly available power.
The below set of parameters were used to calculate the sensitivity of hydrogen prices to two variables: electrolyser and power prices, as shown. Appendix 1 sets out the calculations in detail.
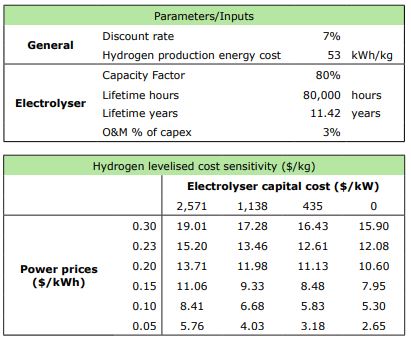
Note that even if the electrolyser is cost-free and power prices are unrealistically low, green hydrogen is still more expensive than hydrogen from natural gas at $2/kg.
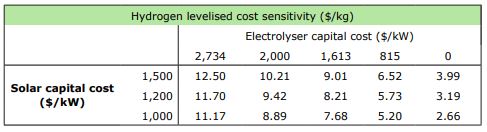
3.3 Cost of green hydrogen from fluctuating renewable power
Alternatively, hydrogen production can play a ‘solar sponge’ role, absorbing excess renewable energy when available, as planned in the ISP.[52] Given solar’s intermittent nature, utilisation rates are expected to drop significantly, to around 25%, in line with solar capacity factor. A larger, more expensive electrolyser, sized according to peak generation, must also be used. Appendix 1 contains a full breakdown of the methodology for these calculations.
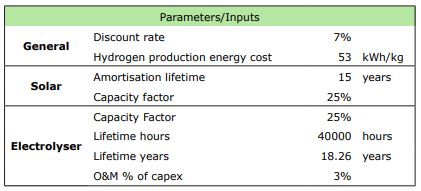
Again, a sensitivity analysis can be conducted:
3.4 Cost of green hydrogen from an optimised off-grid project
A more complex analysis can be undertaken to model an off-grid project using a mixture of wind and solar generation, with an under-sized electrolyser. The reason for under-sizing the electrolyser is so it can operate at utilisation rates higher than the capacity factor of the generation, although this means that some energy is wasted when the system is at peak generation. This creates a trade-off between the value of the energy wasted, and the capital cost saved on a smaller electrolyser.
The economics are also heavily affected by the correlation/anti-correlation of the wind and solar generation, and their respective proportions in the generation mix.
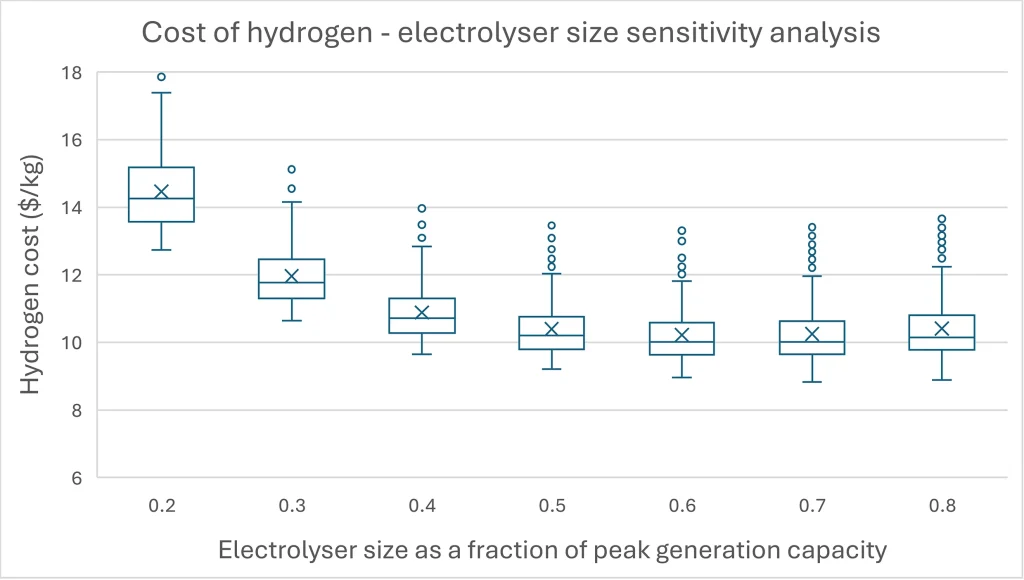
We conducted an empirical analysis with data from individual wind and solar farms. Each combination of generators was combined into a hypothetical wind and solar project, with an iteration over the proportion of each generation type in the mixture and a further iteration over electrolyser size as a proportion of peak generation.
For each of these combinations, the overall cost of hydrogen from each of these hypothetical projects was calculated. This sensitivity analysis produced 38,025 results, showing that electrolyser sizes in the range of 60% to 70% of peak generation capacity produce the cheapest hydrogen.
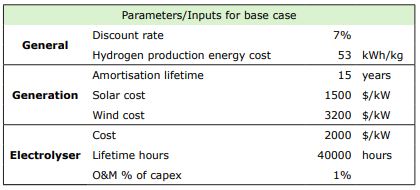
As above, Appendix 1 contains more details on the methodology for these calculations.
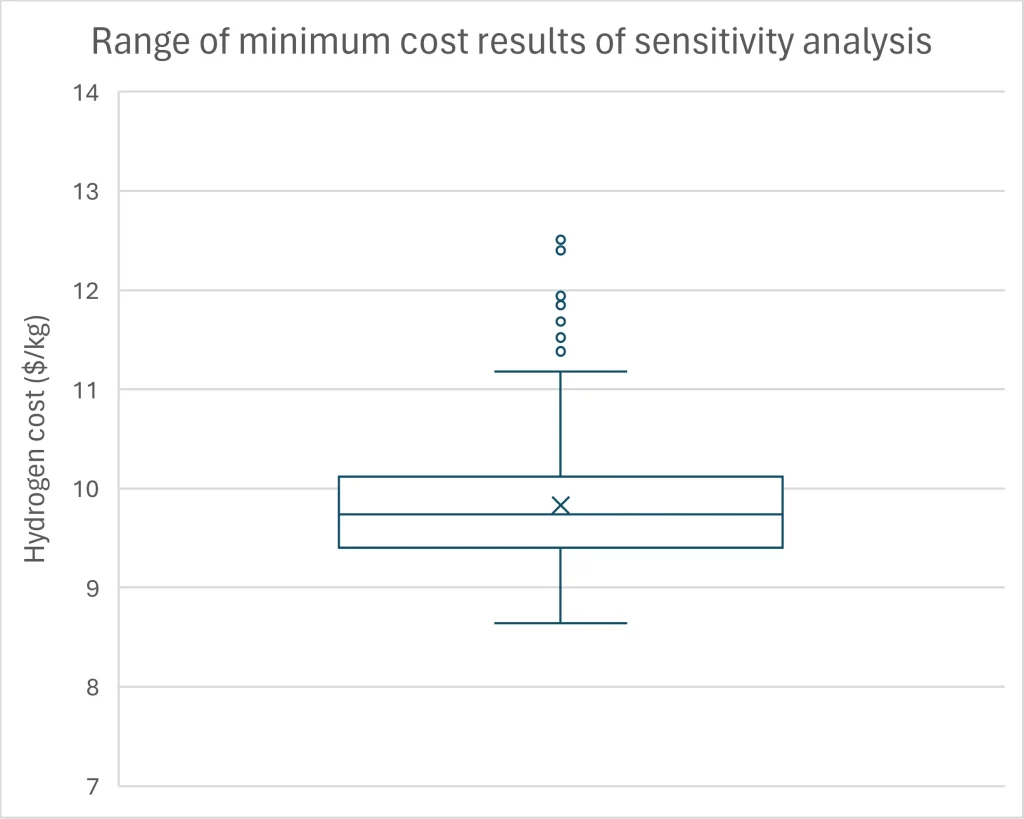
Figure 6 – Box-and-whisker plot of hydrogen costs across the sensitivity analysis
Taking only the minimum-cost scenarios for each of the combinations of wind and solar farms, we can construct the range of minimum-cost outcomes:
Figure 7 – Box-and-whisker plot of minimum-cost hydrogen across the sensitivity analysis
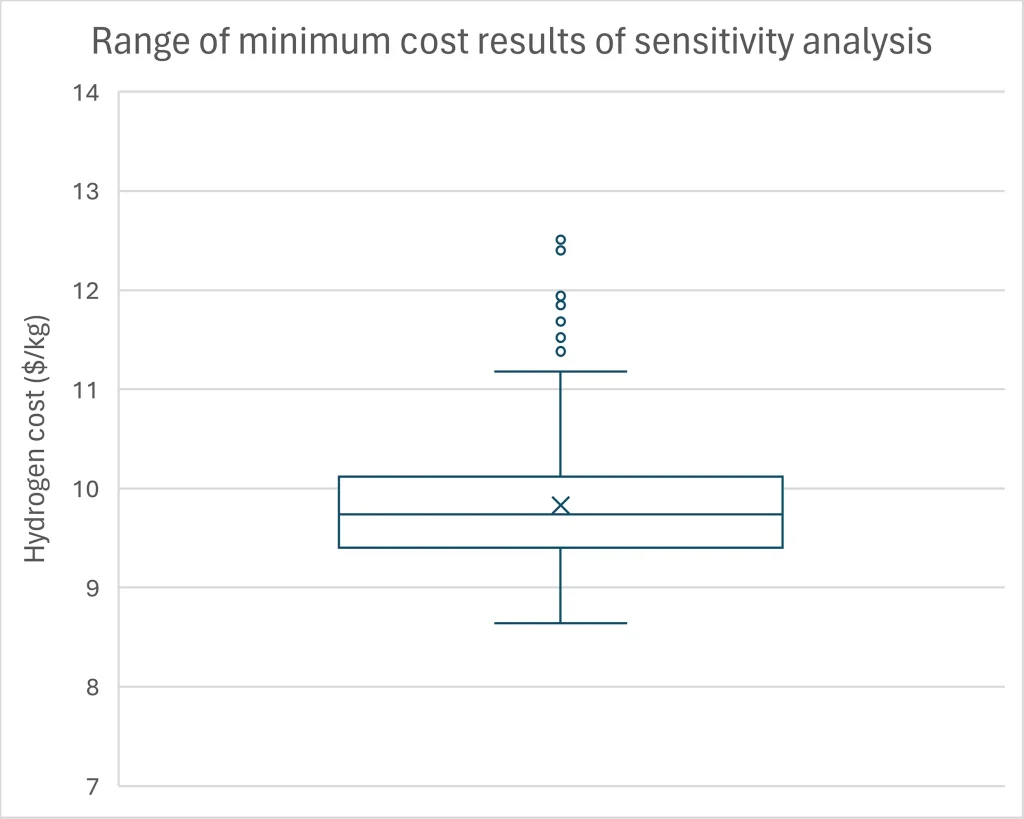
It is not realistic to assume that this minimum can be designed-for, since this would require perfect foresight of weather patterns many years in advance.
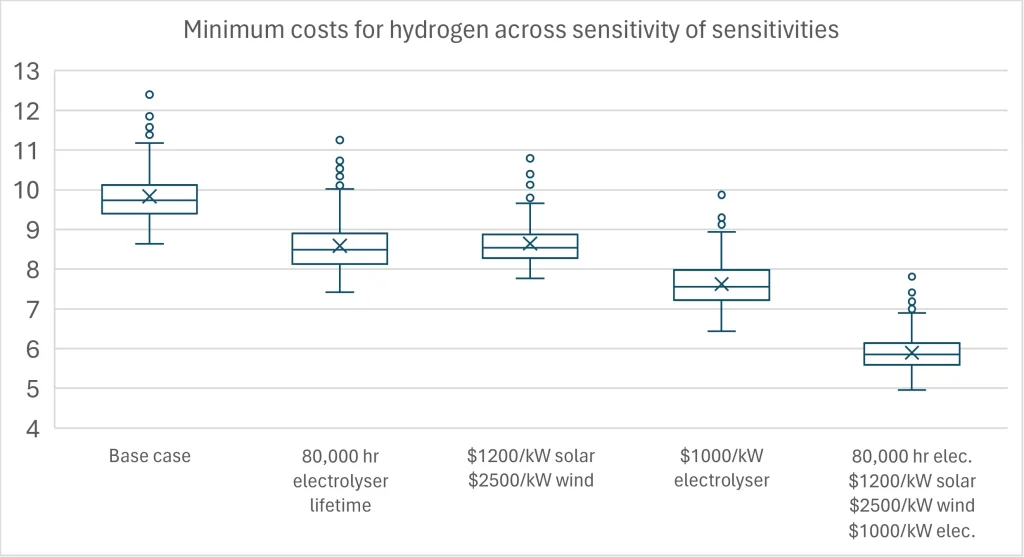
We conclude that off-grid optimised hydrogen cost is in the range of $10/kg.
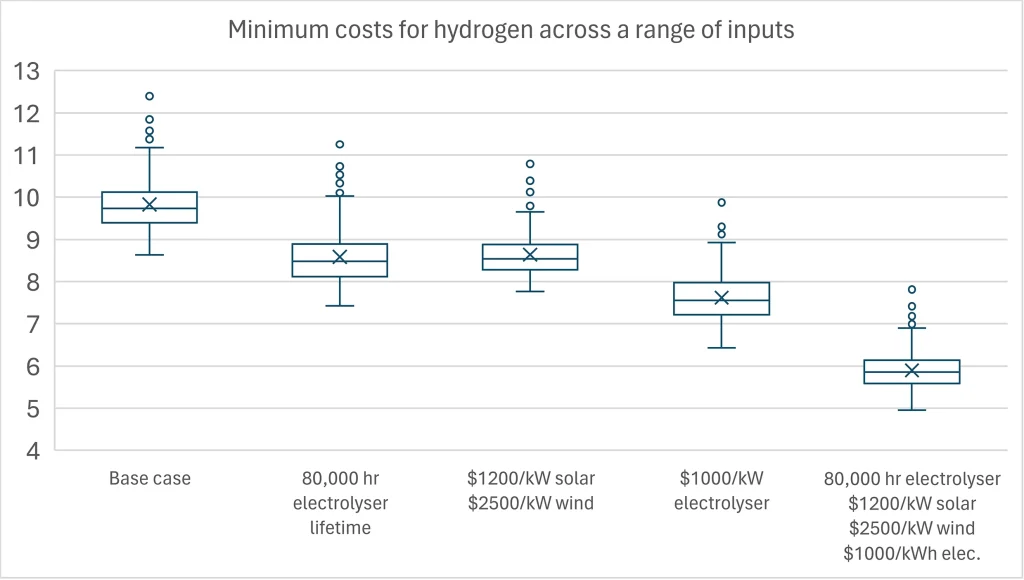
For completeness’ sake, we also calculate results for a range of changes to the input variables. The most optimistic set of input variables yields a cost estimate in the range of $6/kg.
Figure 8 – Box-and-whisker plots for cost of hydrogen across sensitivities of input variables
3.5 Scale will not solve these problems
From the above analyses, even extremely optimistic future scenarios fail to render green hydrogen cost competitive with natural gas.
In most realistic cases, the price for green hydrogen is over $10/kg — 500% of the current market price of grey hydrogen. This means that for projects to be successful, they must either find a buyer at $10/kg or receive subsidies of $8/kg.
Economies of scale and technological developments can only go so far to ameliorate green hydrogen’s basic cost, which is driven by physics. Arguments to the contrary must necessarily be propped up by wishful thinking.
3.6 More advanced uses simply add more cost
The above analysis considers green hydrogen for industrial chemical use only — manufactured and used on-site, integrated into existing production. This does not include the storage, transportation and end-use costs and inefficiencies associated with more advanced uses for green hydrogen.
Touted as a panacea for hard-to-electrify applications like long-haul freight, shipping, and steelmaking, hydrogen underpins the final stage of net-zero ambitions.
One of the key challenges for these applications is storage. Hydrogen is the lightest element, and hard to compress. At atmospheric pressure and standard temperature, it has a density of 0.083 kg/m³ — just 7% the density of air, and 0.0097% the density of diesel.
Compressing hydrogen to 70 MPa can raise the density to 40 kg/m3, but this alone costs 12% of its energy content.[53] Liquefying hydrogen is even more difficult, costing 36% of the energy content, and requiring extremely low temperatures of -252°C.[54]
The low density is only partially offset by the high energy content — 1 kg of hydrogen has more than 2.6 times the energy of 1kg of diesel. The energy in 200L of diesel could be replaced by 900L of liquid hydrogen, or 1600L of pressurised gaseous hydrogen at 70MPa.
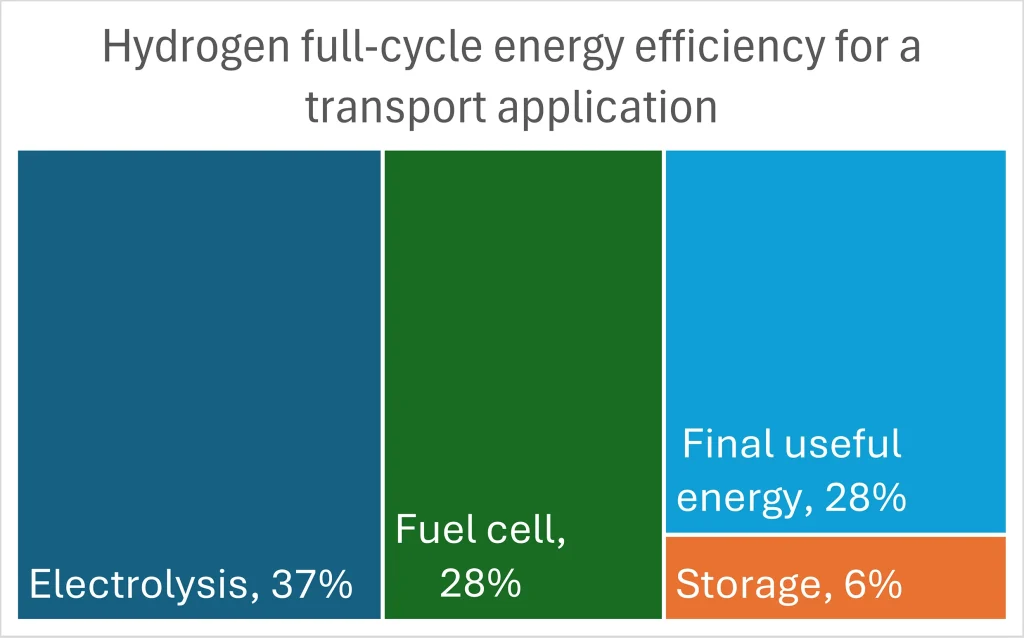
For transport, the final use of this hydrogen is in a fuel cell, which produces electricity to power a motor. The round-trip efficiency of hydrogen for this application is less than 30%, with Figure 6 demonstrating the components of the losses.[55]
Figure 9 – Hydrogen round trip energy efficiency for transport applications
Other impediments to widespread use include:
- Highly flammable and deflagration-prone, with very little ignition energy required. It also has a wide flammability range — flammable in air from about 4% to 75% concentration, which is much wider than most fuels (methane, for example is flammable from 5% to 15%). All these factors make it difficult to store and use safely;
- Embrittlement — causes metals to become more brittle, leading to more cracking and fracturing. Tanks and pipes must be inspected and replaced more often, leading to higher costs.
3.7 Addressing more optimistic cost assumptions
Although we have cited what we believe to be reasonable figures for the input costs and assumptions in the above calculations, some critics may state that technological development and economies of scale will bring lower cost and higher efficiency electrolysers, as well as more efficient fuel cells and distribution routes for hydrogen fuel, etc. For this reason, we have included even what we consider to be unrealistically optimistic inputs in our sensitivity analysis. Indeed, many of these improvements may be eventually achieved, but our analysis indicates that hydrogen would remain relatively expensive.
The overarching point of this paper is that to pin a nation’s future on the expectations of improvements in an emerging technology is fundamentally foolish. It would make more sense to wait until these improvements materialise, and to then incorporate them into our plans.
4. The Orica deal exposes the plan as untenable
As Australia’s largest chemical manufacturer, Orica uses hydrogen extensively to produce explosives for the mining industry, as well as fertilisers for agriculture.
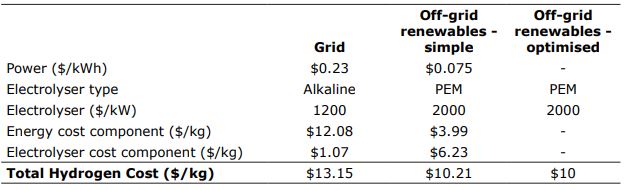
The federal government recently announced $432 million of funding for Orica’s Hunter Valley Hydrogen project.1 The funding is for a 50 MW electrolyser which will produce roughly 4,700 tonnes of green hydrogen annually. This represents 7.5% of Orica’s existing hydrogen use. This grant is in addition to prior announcements of $45 million of state2 and $70 million of federal funding,3 bringing the total subsidy for this project to $547 million.
Orica CEO Sanjeev Ghandi acknowledged that green hydrogen cannot currently be made economically and requires subsidies for both capital and operational expenditure. However, he justified accepting government subsidies by suggesting scale and experience will bring costs down and make the process more economically competitive over time.[56] It is doubtful whether the future holds radically cheaper production costs. As we have already shown, much of the cost structure of green hydrogen is determined by factors extrinsic to scale and experience, such as energy prices. The Orica application is the most basic green hydrogen use case — it should be cheapest and easiest to achieve integration into chemical production first. Instead, the converse is proving true: that if green hydrogen doesn’t make sense in this use-case, there is little hope for every other use case.
4.1 Implicit subsidised hydrogen price
The subsidy of $547m equates to an annual value of $52m over 20 years at a 7% discount rate. The plant will produce 4,700 tonnes of green hydrogen annually, which means that each kilogram of green hydrogen is worth $10.99 in subsidies. This is well over the stated $2/kg ‘Hydrogen Production Tax Incentive’ subsidy which is current government policy.[57]
Scaling up the implied subsidies, it would take an equivalent subsidy of $7.3b to justify Orica replacing all of its hydrogen requirements with green hydrogen. Replacing Australia’s current industrial hydrogen usage of 500,000 tonnes per annum would require $58b. Achieving the capacity required for Green Energy Exports of 15 million tonnes of hydrogen production annually would require $3.19t.
4.2 Implicit price of carbon abatement
So-called ‘grey’ hydrogen is made from natural gas, without carbon capture. The base chemical ratios of the process dictate that at least 5.5 kg of H2 is produced for every kg of CO2. Including inefficiencies and process heat, the number is closer to 7 kg CO2/kg H2.[58] Including other lifecycle factors all the way from the source such as drilling, methane leakage, storage, and transport, an estimated 12kg of CO2 equivalents are released for every kg of hydrogen.[59]
With this data, we can calculate the number of tonnes of CO2 abated using the Orica subsidy. We know that the plant will produce 4,700 tonnes of green hydrogen annually, which amounts to between 32,900 and 56,400 tonnes of CO2 abated. The annual value of the subsidy over 20 years, at a 7% discount rate is $52m.
Therefore, the cost of abatement is at the lowest $915/tonne CO2, and at the highest $1,569/tonne CO2. To put this in context, Australian Carbon Credit Unit (ACCU) prices have been averaging between $30-$40/tonne CO2 for the last few years.[60] This means the Orica subsidy represents carbon abatement at a cost 26 to 44 times higher than existing projects. In no way can this subsidy — or for that matter, any hydrogen subsidies — be construed as being in the public interest.
Conclusion
Green hydrogen’s role as a linchpin in Australia’s net zero strategy is untenable. There is no remaining rationale for the continued planning and funding of green hydrogen projects. The $477m subsidy for Orica’s Kooragang Island project reveals the stark economic realities of green hydrogen production. At $9.57/kg in subsidies, the cost far exceeds the market price of grey hydrogen ($2/kg), with abatement costs of $798-$1,368/tonne CO2, dwarfing typical carbon credit prices. These figures highlight that green hydrogen, even in its simplest application, requires massive financial support to be viable.
The energy-intensive nature of electrolysis, high capital costs, and inefficiencies in storage and transport — driven by hydrogen’s low density and material challenges — render it uncompetitive without sustained subsidies.
The failure of numerous high-profile projects and the stalled progress of most others in Australia’s hydrogen pipeline further underscore these challenges. Scaling green hydrogen to meet national or export goals would demand trillions in subsidies. Proponents of green hydrogen might argue that the subsidies would never amount to trillions because they will kick-start innovation and investment that will eventually make hydrogen so cheap that subsidies are no longer required. In contrast, we have shown that the cost challenges are fundamental and largely extrinsic to scale.
The Orica deal is a cautionary tale: rather than a stepping stone to a green superpower, it exposes green hydrogen as a costly and inefficient solution, propped up by wishful thinking rather than economic or physical reality.
Yet it remains the government’s official plan to give hydrogen a critical role in the energy system of the future. Policymakers must reassess hydrogen’s role in the energy transition and prioritise more viable decarbonisation pathways.
The only thing worse than beating a dead horse is betting on one. When the wager is Australia’s future, hydrogen is simply a bad bet.
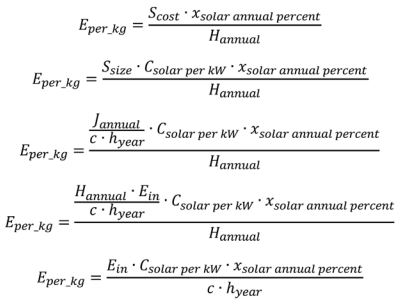
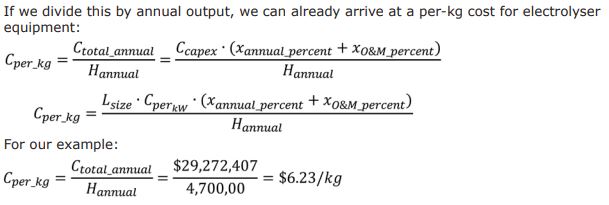
Appendix 1 — Detailed hydrogen costing analysis
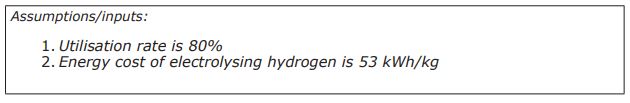
First, we must distinguish between firmed and unfirmed power. Firmed power allows an operator to utilise their assets at a high rate (we use 80%), so they can purchase a smaller, cheaper electrolyser suited to steady-state operation. They must, however, pay the going rate for firmed electricity.
Using unfirmed power is more in line with the intentions for hydrogen in the ISP, which utilises hydrogen electrolysers as load sinks in the system, opportunistically soaking up the excess renewable electricity. This implies a very low utilisation rate, as the electrolyser will only be used when there is ample renewable generation and the power is not required by the grid (typically during peak solar hours). The multiplication of these two rates could be a low number indeed. However, for simplicity, we will model a solar-only standalone project, which installs renewable electricity with the intention to use 100% of the power generated, whenever it is generated, to make hydrogen. This means the utilisation rate will be the same as the capacity factor for the renewable generation, and the electrolyser must be sized to the maximum generation capacity of the renewable energy source.
The final stage of analysis is modelling a more complex off-grid project, similar to Murchison,[61] in WA. This type of project typically uses a mixture of wind and solar, and under-sizes the electrolyser so that it achieves a higher utilisation rate, although this means that energy is wasted when the system is at peak generation.
Below are worked examples using the numbers from the announced Orica subsidy.
Throughout, we make use of the present-value/annuity formula to annualise up-front costs. Briefly, it is:
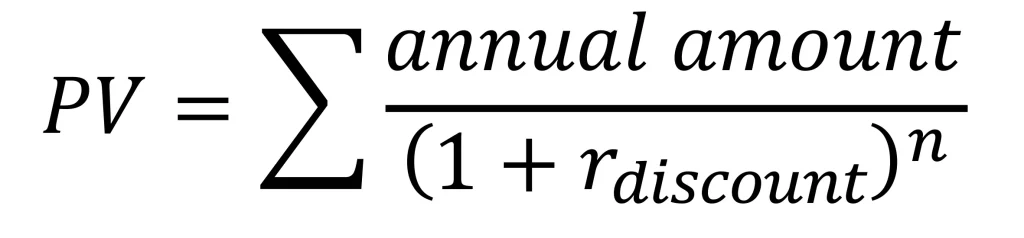
This can be solved for the annual amount, given a time period and a discount rate.
A1.1 Firmed grid electricity
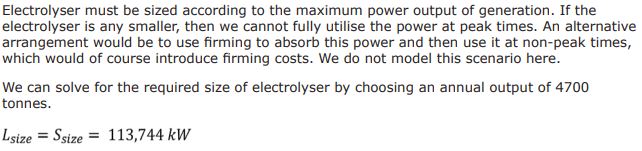
Electrolyser sizing
We can solve for the required size of electrolyser by choosing an annual output of 4,700 tonnes.
![]()
Where:
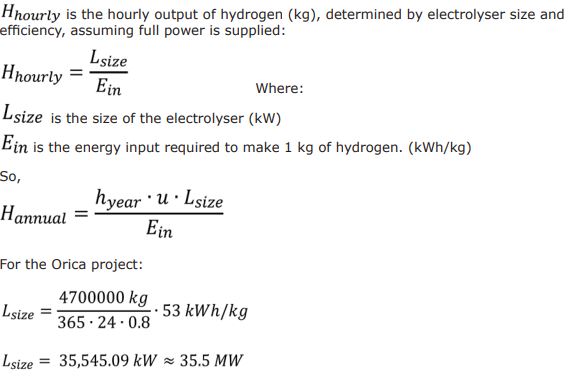
Electrolyser cost
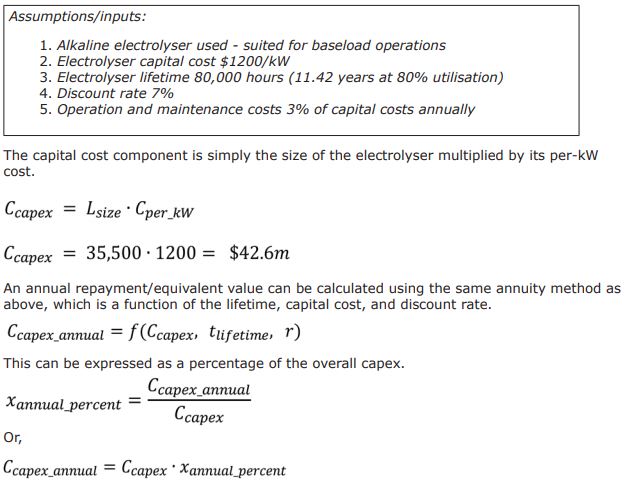
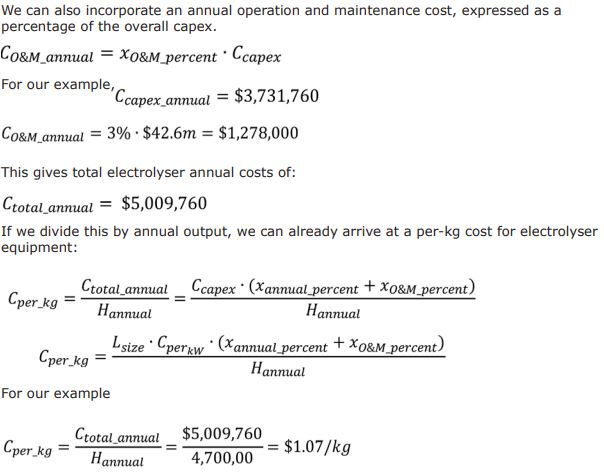
Energy cost
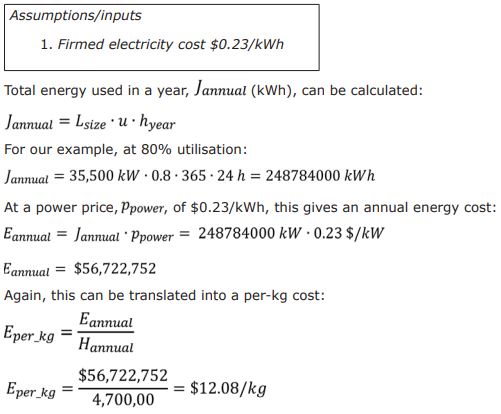
Total cost
A1.2 Unfirmed renewables – simple
Energy generation sizing
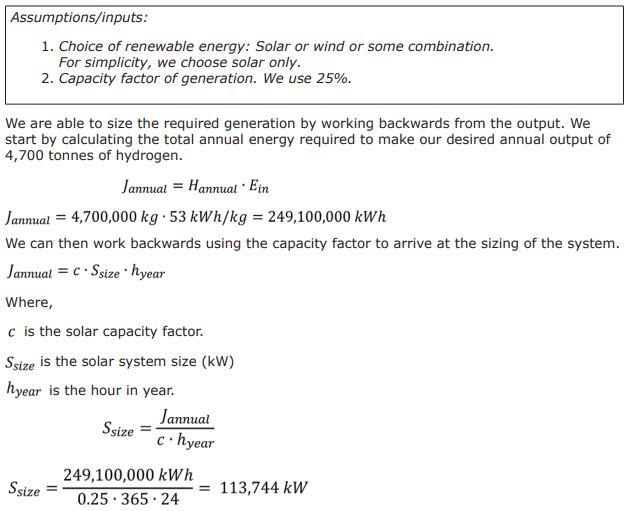
Energy generation cost
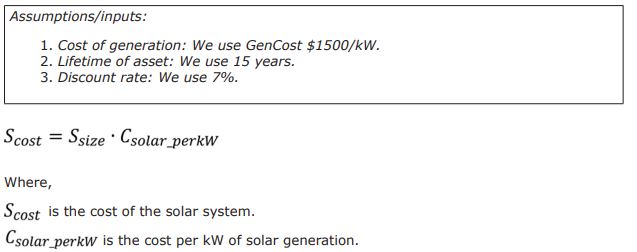
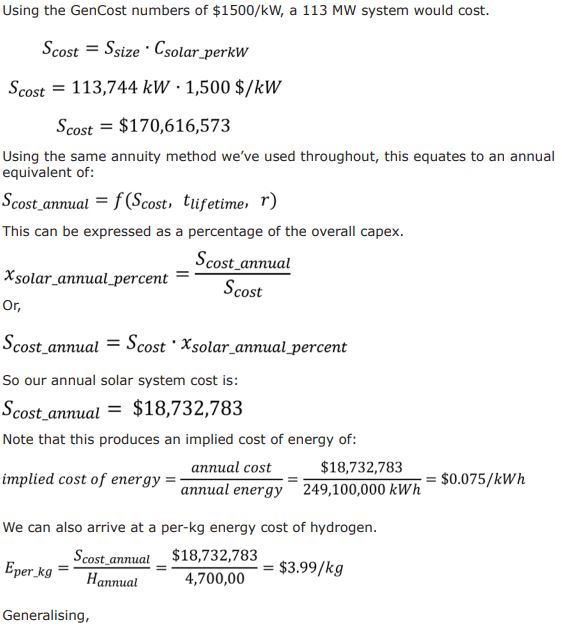
Electrolyser sizing
Electrolyser cost
Total cost
A1.3 Unfirmed renewables — with generation mix and undersized electrolyser
A more complex analysis can be undertaken to model an off-grid project using a mixture of wind and solar generation, with an under-sized electrolyser. The reason for under-sizing the electrolyser is so that it can operate at higher utilisation rates than the capacity factor of the generation, although this means that energy is wasted when the system is at peak generation. This is a complex trade-off between the value of the energy wasted, and the capital cost saved on a smaller electrolyser.
The economics are also heavily affected by the correlation/anti-correlation of the wind and solar generation, and their respective proportions in the generation mix.
Empirical analysis of realistic utilisation rates
We conducted an empirical analysis with data from AEMO archives[64] for 15 wind farm Dispatchable Unit Identifiers (DUIDs) and 15 single-axis tracking solar farm DUIDs. Each combination of generators was combined into a hypothetical wind and solar project, where the generated electricity for each timestamp over a year was a combination of the two sources.
The number of total combinations was limited to 15 of each type as this was deemed a reasonable number to estimate the range of possible combinations. It is assumed some combinations would overestimate the benefit from anti-correlation between wind and solar, and some would underestimate it.
For each combination, we iterated over varying proportions of each generation type in the mixture from 30%/70% solar/wind to 70%/30%. We then iterated over a series of electrolyser sizes, from 20% of peak generation to 80%.
For each of these combinations, the overall utilisation rate of the electrolyser was calculated. Utilisation rates increase as the size of the electrolyser decreases, so there is no optimum size to maximise utilisation. Electrolyser cost decreases with size, but so does output. Hence we must apply the cost calculations from A1.2 above to calculate the overall cost of hydrogen from each of these hypothetical projects.
Calculating cost across generation and electrolyser size scenarios
The same assumptions are used as above:
This sensitivity analysis produced 38,025 results (15 x 15 x 13 weighting parameters x 13 load size parameters). The results show that electrolyser sizes in the range of 50% to 75% of peak generation capacity produce the cheapest hydrogen.
Figure 10 – Box-and-whisker plot of hydrogen costs across the sensitivity analysis

Taking only the minimum-cost scenarios for each of the 225 combinations of wind and solar farms, we can construct the range of minimum-cost outcomes:
Figure 11 – Box-and-whisker plot of minimum-cost hydrogen across the sensitivity analysis
It is not realistic to assume that this minimum can be designed-for, since this would require perfect foresight of weather patterns many years in advance.
We conclude that off-grid optimised hydrogen costs in the range of $10/kg.
For the sake of completeness, we also calculate results for a range of changes to the input variables. The most optimistic set of input variables yields a cost estimate in the range of $6/kg.
Figure 12 – Box-and-whisker plots for cost of hydrogen across sensitivities of input variables
Data and R/Python scripts for these calculations are available on request.
Summary
Endnotes and references
[1] Gwynne, S. C., ‘His Majesty’s Airship: The Life and Tragic Death of the World’s Largest Flying Machine’, 2023.
[2] Ibid.
[3] Davison, P., ‘The R.101 story: a review based on primary source material and first hand accounts’, Journal of Aeronautical History, 2015, https://www.aerosociety.com/media/4840/the-r101-story-a-review-based-on-primary-source-material.pdf
[4] Smithsonian National Postal Museum, ‘The Hindenburg Disaster’, 2025, https://postalmuseum.si.edu/exhibition/fire-ice-hindenburg-and-titanic-exhibition/the-hindenburg-disaster
[5] Lambert, M., ‘Hydrogen and decarbonisation of gas: false dawn or silver bullet?’, The Oxford Institute for Energy Studies, 2020, https://www.oxfordenergy.org/publications/hydrogen-and-decarbonisation-of-gas-false-dawn-or-silver-bullet/
[6] Yap, J. & B. McLellan, ‘A Historical Analysis of Hydrogen Economy Research, Development, and Expectations, 1972 to 2020’, Environments, 2023, 10(1), 11, https://www.mdpi.com/2076-3298/10/1/11
[7] Jonas, J., ‘The History of Hydrogen’, Alt Energy Mag, 2009, https://www.altenergymag.com/article/2009/04/the-history-of-hydrogen/555/
[8] Veziroglu, A., ‘History of the IAHE and IJHE’, International Association for Hydrogen Energy, 2025, https://www.iahe.org/en/about
[9] Yap, J. & B. McLellan, ‘A Historical Analysis of Hydrogen Economy Research, Development, and Expectations, 1972 to 2020’, Environments, 2023, 10(1), 11, https://www.mdpi.com/2076-3298/10/1/11
[10] Evans, S. & Gabbatis, J., ‘In-depth Q&A: Does the world need hydrogen to solve climate change?’, Carbon Brief, 2020, https://www.carbonbrief.org/in-depth-qa-does-the-world-need-hydrogen-to-solve-climate-change/
[11] Leslie, Jacques, ‘Dawn of the Hydrogen Age’, Wired, 1/10/1997, https://www.wired.com/1997/10/hydrogen-3/
[12] The White House, ‘Hydrogen Fuel Technology: a Cleaner and More Secure Energy Future’, 2003, https://georgewbush-whitehouse.archives.gov/infocus/technology/economic_policy200404/chap2.html
[13] Biello, D., ‘R.I.P. hydrogen economy? Obama cuts hydrogen car funding’, Scientific American, 8/5/2009, https://www.scientificamerican.com/blog/news-blog/rip-hydrogen-economy-obama-cuts-hyd-2009-05-08/
[14] Fuel Cells Works, ‘Why Ohio Companies Are Investing in Hydrogen Cars Despite Infrastructure Issues’, 2025, https://fuelcellsworks.com/2025/01/03/fuel-cells/why-ohio-companies-are-investing-in-hydrogen-cars-despite-infrastructure-issues
[15] Orica, ‘Orica awarded $432 million ARENA Headstart funding’, 4/7/25, https://www.orica.com/news-media/2025/orica-awarded-432-million-arena-headstart-funding
[16] NSW Government, ‘$45 million boost for Kooragang Island to drive NSW to a hydrogen future’, 28/9/23, https://www.nsw.gov.au/media-releases/45-million-boost-for-nsw-hydrogen-hub
[17] DCCEEW, ‘$70 million awarded for Hunter Hydrogen Hub’, 13/7/23, https://www.dcceew.gov.au/about/news/70-million-awarded-for-hunter-hydrogen-hub
[18] DCCEEW, ‘State of Hydrogen 2022’, 2022, p. 10, https://www.dcceew.gov.au/sites/default/files/documents/state-of-hydrogen-2022.pdf
[19] DCCEEW, ‘National Hydrogen Strategy 2024’, 2024, p. 65, S3.2, https://www.dcceew.gov.au/sites/default/files/documents/national-hydrogen-strategy-2024.pdf.
4 million tonnes, over 440 million tonnes total emissions.
[20] Ibid.
[21] Reedman, L. et al, ‘Multi-sector energy modelling 2022: Methodology and results Final report’, CSIRO, Climateworks, 2022, https://aemo.com.au/-/media/files/stakeholder_consultation/consultations/nem-consultations/2022/2023-inputs-assumptions-and-scenarios-consultation/supporting-materials-for-2023/csiro-climateworks-centre-2022-multisector-modelling-report.pdf
[22] Sims, R. & B. Mullen, ‘Australia as a green superpower is more than just a slogan’, The Australian, 10/12/24, https://www.theaustralian.com.au/business/renewable-energy-economy/australia-as-a-green-superpower-is-more-than-just-a-slogan/news-story/0108be0fb3608ffbc25e971b1352da39
[23] AEMO, ‘Integrated System Plan 2020’, 2020, p. 22, Box 1, https://aemo.com.au/-/media/files/major-publications/isp/2020/final-2020-integrated-system-plan.pdf
[25] AEMO, ‘Integrated System Plan 2022’, 2022, p. 25, 31, https://aemo.com.au/-/media/files/major-publications/isp/2022/2022-documents/2022-integrated-system-plan-isp.pdf
[26] AEMO, ‘Integrated System Plan 2024 – Appendix 2’, 2024, p. 39, A2.4.1 Step Change, Fig 22, https://aemo.com.au/-/media/files/major-publications/isp/2024/appendices/a2-generation-and-storage-development-opportunities.pdf
[27] AEMO, ‘Integrated System Plan 2024’, 2024, p. 27, s1.2, https://aemo.com.au/-/media/files/major-publications/isp/2024/appendices/a2-generation-and-storage-development-opportunities.pdf
[28] AEMO, ‘Integrated System Plan 2024 – Appendix 4. System Operability’, 2024, p. 11, A4.2, https://aemo.com.au/-/media/files/major-publications/isp/2024/appendices/a4-system-operability.pdf
[29] Ibid
[30] Ibid
[31] Ibid
[32] AEMO, ‘Integrated System Plan 2024 – Appendix 2’, 2024, p. 38, A2.4.1 Step Change, ‘Hydrogen developments’, https://aemo.com.au/-/media/files/major-publications/isp/2024/appendices/a2-generation-and-storage-development-opportunities.pdf
[33] AEMO, ‘Integrated System Plan 2024 – Appendix 4. System Operability’, 2024, p. 12, A4.2, Fig 3, https://aemo.com.au/-/media/files/major-publications/isp/2024/appendices/a4-system-operability.pdf
[34] AEMO, ‘Integrated System Plan 2024 – Appendix 2’, 2024, p. 76, A2.5.6 Low Hydrogen Flexibility, https://aemo.com.au/-/media/files/major-publications/isp/2024/appendices/a2-generation-and-storage-development-opportunities.pdf
[35] Williams, P., ‘Green hydrogen hopes up in smoke’, The Australian, 4/3/25, https://www.theaustralian.com.au/business/green-hydrogen-hopes-up-in-smoke/news-story/f3b69233bb8ee730083f87e73764a232
[36] Carroll, D., ‘South Australia dissolves Office of Hydrogen Power’, PV Magazine, 5/5/25, https://www.pv-magazine-australia.com/2025/05/05/south-australia-dissolves-office-of-hydrogen-power/
[37] Hancock Energy, ‘Trafigura scraps $750m green hydrogen plant at Port Pirie’, 25/3/25, https://www.hancockenergy.com.au/trafigura-scraps-750m-green-hydrogen-plant-at-port-pirie/
[38] Hines, J., ‘Developers dump Gladstone’s Central Queensland Hydrogen Project CQH2’, ABC News, 30/6/25, https://www.abc.net.au/news/2025-06-30/central-queensland-green-hydrogen-project-cqh2-dumped-gladstone/105476564
[39] Simmons, D., ‘Nearly half of all SA hydrogen projects quietly ‘archived’’, In Daily SA, 5/3/25, https://www.indailysa.com.au/news/in-depth/2025/03/05/nearly-half-of-all-sa-hydrogen-projects-quietly-archived
[40] Carroll, D., ‘Woodside halts two large-scale green hydrogen projects’, PV Magazine, 2/9/24, https://www.pv-magazine-australia.com/2024/09/02/woodside-halts-two-large-scale-green-hydrogen-projects/
[41] Fuel Cell Works, ‘Japanese HESC Project Relocates Hydrogen Production Amid Australian Delays’, 31/3/25, https://fuelcellsworks.com/2025/03/31/green-hydrogen/japanese-hesc-project-relocates-hydrogen-production-amid-australian-delays
[42] Simmons, D., ‘Nearly half of all SA hydrogen projects quietly ‘archived’’, In Daily SA, 5/3/25, https://www.indailysa.com.au/news/in-depth/2025/03/05/nearly-half-of-all-sa-hydrogen-projects-quietly-archived
[43] Bates, A. & J. Shackleton, ‘Carnarvon’s future uncertain as Hyenergy green hydrogen project stalls’, ABC News, 04/09/24, https://www.abc.net.au/news/2024-09-04/carnarvon-residents-uncertain-future-clean-energy-project-stalls/104293954
[44] Jose, L. & J. Prendergast, ‘Energy company ATCO says WA gas reservation a factor in hydrogen project cancellation’, ABC News, 17/8/23, https://www.abc.net.au/news/2023-08-17/cheap-gas-price-sinks-wa-green-hydrogen-project/102732386
[45] Macdonald-Smith, Angela, Australian Financial Review, ‘BP ditches $54b Pilbara hydrogen project’, 24/7/25 , https://www.afr.com/companies/energy/bp-ditches-us36b-pilbara-hydrogen-project-20250724-p5mhmh
[46] CSIRO, ‘HyResource’, 2025, https://research.csiro.au/hyresource/projects/facilities/
[47] HOMER energy, ‘Electrolyzer Efficiency’, 2025, https://www.homerenergy.com/products/pro/docs/3.15/electrolyzer_efficiency.html
[48] Blain, L., ‘Record-breaking hydrogen electrolyzer claims 95% efficiency’, New Atlas, 16/3/2022, https://newatlas.com/energy/hysata-efficient-hydrogen-electrolysis/
[49] Graham, P., J. Hayward & J. Foster, ‘GenCost 2024-25 Consultation draft’, CSIRO, 2024, p. 85, Apx Table B.11 Hydrogen electrolyser cost projections by scenario and technology, $/kW, https://www.csiro.au/-/media/Energy/GenCost/GenCost2024-25ConsultDraft_20241205.pdf
[50] Bloom Energy, ‘Bloom Energy submission to CSIRO-AEMO GenCost 2024-25 Draft Consultation’, 2025, https://aemo.com.au/-/media/files/major-publications/isp/2025/draft-2025-gencost-submissions/bloom-energy.pdf
[51] Graham, P., J. Hayward & J. Foster, ‘GenCost 2024-25 Consultation draft’, CSIRO, 2024, p. 56, Figure 5-20, https://www.csiro.au/-/media/Energy/GenCost/GenCost2024-25ConsultDraft_20241205.pdf
[52] AEMO, ‘Integrated System Plan 2024’, 2024, p. 27, Figure 7, https://aemo.com.au/-/media/files/major-publications/isp/2024/2024-integrated-system-plan-isp.pdf
[53] Mulky L., et al, ‘An overview of hydrogen storage technologies – Key challenges and opportunities’, Materials Chemistry and Physics, 2024, s4.1, Table 10, https://www.sciencedirect.com/science/article/pii/S0254058424008356#bib189
[54] Ibid
[55] Headly, A.J., ‘Hydrogen Energy Storage’, Sandia National Laboratories, p. 13, s2.3.1, https://www.sandia.gov/app/uploads/sites/163/2022/03/ESHB_Ch11_Hydrogen_Headley.pdf
This source cites round-trip efficiency of 40%: “Fuel cell efficiency of 40-55%”. In reality, it is less. 53 kWh spent in electrolysis means 190,000 kJ is the energy input, each kg contains 120,000 kJ of energy, of which 10% is lost in storage, and roughly 50% is lost in the fuel cell. This equates to 28% final useful energy.
[56] Harrison, J., ‘Australia’s gas policy is holding back investment, warns Orica CEO Sanjeev Gandhi’, Sky News, 11/5/25, https://www.skynews.com.au/business/energy/australias-gas-policy-is-holding-back-investment-warns-orica-ceo-sanjeev-gandhi/news-story/5e08084ed24fb4e8a96d3bd24cc1571a
[57] DCCEEW, ‘National Hydrogen Strategy 2024’, 2024, p. 9, https://www.dcceew.gov.au/sites/default/files/documents/national-hydrogen-strategy-2024.pdf
[58] Soltani, R., M.A. Rosen & I. Dincer, ‘Assessment of CO2 capture options from various points in steam methane reforming for hydrogen production’, International Journal of Hydrogen Energy, 2014, https://www.sciencedirect.com/science/article/abs/pii/S0360319914027566
[59] Moberg, J. & S. Bartlett, ‘The mirage of blue hydrogen is fading’, Green Hydrogen Organisation, 2022, https://gh2.org/blog/mirage-blue-hydrogen-fading. 11.1-13.7 kg CO2/kg H2.
[60] Clean Energy Regulator, ‘Quarterly Carbon Market Report ’, p. 9, Figure 1.2, https://cer.gov.au/document/quarterly-carbon-market-report-march-quarter-2025
[61] Murchison Renewables, https://www.murchisonrenewables.com.au/
[62] Graham, P., J. Hayward & J. Foster, ‘GenCost 2024-25 Consultation draft’, CSIRO, 2024, p. 55, s 5.3.16,
https://www.csiro.au/-/media/Energy/GenCost/GenCost2024-25ConsultDraft_20241205.pdf
[63] Thunder Said Energy, https://thundersaidenergy.com/2023/01/17/green-hydrogen-alkaline-versus-pem-electrolysers/
More optimistic range provided by AEMC: https://www.aemc.gov.au/hydrogen-role-hydrogen-production-industry-providing-system-services-nem
[64] AEMO/NEMWEB, https://www.nemweb.com.au/REPORTS/ARCHIVE/Dispatch_SCADA/
[65] Graham, P., J. Hayward & J. Foster, ‘GenCost 2024-25 Consultation draft’, CSIRO, 2024, p. 55, s 5.3.16,
https://www.csiro.au/-/media/Energy/GenCost/GenCost2024-25ConsultDraft_20241205.pdf
[66] Thunder Said Energy, https://thundersaidenergy.com/2023/01/17/green-hydrogen-alkaline-versus-pem-electrolysers/
More optimistic range provided by AEMC: https://www.aemc.gov.au/hydrogen-role-hydrogen-production-industry-providing-system-services-nem