
Executive Summary
This report is the first in a series of CIS research papers focusing on intergenerational political attitudes and electoral behaviour. This report investigates the extent to which age is a factor in determining a first preference vote for Australia’s major centre-right political parties; the ex ante coalition between the Liberal Party of Australia and the National Party of Australia — the Coalition.
The report presents estimates of the ‘election adjusted’ primary vote for the Coalition parties from the Australian Election Study (AES). These election-adjusted primary votes reflect the difference between a generation’s primary vote for the Coalition, at a given age, and the average primary vote for the Coalition among the overall electorate in elections held in 1966, 1969, 1980 and from 1987 to 2022.
These estimates suggest strong — and intergenerationally diverse — age effects in Australian electoral behaviour.
For the post-war generations born prior to 1996, support for the Coalition was considerably lower compared to the average voter in their late teens and early 20s; with support for the Coalition increasing thereafter. More specifically:
- Baby Boomers (born 1946 to 1964) had a primary vote 5 percentage points lower than the average voter in elections held when they were in their late teens and early 20s but moved in favour of the Coalition by just over 1 percentage point per electoral cycle, on average. By their mid-70s, Boomers were 15.2 percentage points more inclined to vote for the Coalition compared to the average voter.
- Generation X (born 1965 to 1980) were just under 10 percentage points less likely to vote for the Coalition in their early elections (-9.4 percentage points) relative to the average. This generation moved towards the Coalition at a slightly slower rate than Baby Boomers up until their mid-50s. At the last election Generation X were 2.2 percentage points more inclined to vote for the Coalition than the average voter.
Beginning in their early 50s, both Boomers and Generation X became more likely to vote for the Coalition compared to the average voter (on average).
The AES data currently available strongly suggests the voting patterns observed for Baby Boomers and Generation X are unlikely to be true for Australian voters born after 1980.
- Millennials (born 1981 to 1995) were 12.7 percentage points less inclined to vote for the Coalition in their early elections moving towards the Coalition at a rate of 0.6 percentage points per electoral cycle. Given their low initial support for the Coalition, Millennials remain 8 percentage points less likely to vote for the Coalition in their early 40s.
Although the youngest generation of current voters, Generation Z (born 1996 to 2009) have cast their vote in only three federal elections, their electoral behaviour stands out as dramatically different to the generations that preceded them — even when compared to Millennials.
- Support for the Coalition among Generation Z in their earliest elections has been significantly lower than any generation of the post-war era, with an election adjusted primary vote of -14.4 percentage points — lower than that for Millennials (in absolute terms) at a similar age. In contrast to earlier generations, Generation Z has moved further away from the Coalition at just under 5 percentage points per electoral cycle. They are, in their mid-20s, 25.3 percentage points less likely to vote for the Coalition than the average voter.
Having uncovered strong — and intergenerationally diverse — age effects in electoral behaviour, this report uses a simulation methodology to assess the extent to which these age effects are politically significant within the context of generational change.
Despite a modest (projected) increase in the average age of the electorate from 47.3 in 2022 to 48.7 by 2040, this period will see considerable change in its generational composition. Although the ‘pro-Coalition’ generations (mostly Baby Boomers and Generation X) were a majority of voters at the last election (56.2 per cent), by 2040 they will make up less than a third (30.2 per cent).
The younger generations (Millennials and Generation Z) made up 43.8 per cent of voters in 2022. With the addition of the post-Generation Z electorate, voters born after 1980 are set to make up just under 69.8 per cent of voters by 2040.
Given Millennials’ modest inclination towards the Coalition — and Generation Z’s present aversion to it — changing generational demography could have politically important ramifications if these generational voting behaviours continue into the future.
The simulation method developed in this report suggests generational change could see the Coalition’s Average Primary Vote across lower house electorates fall by 9.1 percentage points over the course of the next six electoral cycles. This reduction in primary vote is simulated to result in a 35-seat reduction in Coalition seats in the House of Representatives by 2040.
1. Introduction
Rarely is a quote so consistently misattributed as the political adage “If you’re not a liberal when you’re 20, you have no heart. If you’re not a conservative by the time you’re 40, you have no head.” Widely thought of as one of Winston Churchill’s aphorisms, the quote has also been incorrectly attributed to George Bernard Shaw, François Guizot, Benjamin Disraeli, Otto von Bismarck, and Mark Twain with considerable variation in the age at which it is deemed appropriate to let one’s head overrule one’s heart in the retelling[1].
Whoever coined the phrase, it is one that has the support of a number of empirical studies of voter behaviour in Western democracies[2]. However, more recent data casts increasing doubt on the continued relevance of this well-documented ‘age effect’ whereby the propensity to vote for centre-right political parties increases with age.
There is growing evidence across the Anglosphere that Millennials and Generation Z are not showing the same propensity to vote centre-right as they age, as did previous generations. Cameron et al (2022) observe a marked decline in Millennials allocating their first preference to the Coalition in the House of Representatives in Australian federal elections. In the early 2000s, about 35 percent of Millennials showed support for the Coalition at federal elections; falling to just 25 percent at the 2022 election[3].
The Coalition would find little comfort in their level of support among the most recent generation of voters born after 1996. At the most recent election, just 26 per cent of Generation Z (henceforth ‘Gen Z’) cast their first preference in favour of the Coalition. As Cameron et al (2022) note, “No other generation records such skewed preferences at similarly early stages of the life course.”[4].
Opinion polls conducted since the 2022 election do not indicate support for the Coalition has improved among younger voters since their election defeat. Recent Newspolls suggest the primary vote for the Liberal and National parties among those under 35 is lower than that for the Australian Greens.
To paraphrase the adage, the younger generation’s choice of heart over head at the ballot box is not a uniquely Australian phenomena. Recent analysis by John Burn-Murdoch at the Financial Times suggests that Millennials in the United Kingdom (UK) are increasingly less likely to vote Conservative as they age[5]. When in their early twenties, UK Millennials were 7 percentage points less likely to vote Conservative compared to the national average. Now in their forties, these voters are more than 10 percentage points less likely to vote Conservative. More recent data from the UK collected on behalf of conservative think tank Onward in April this year, suggests just 21 per cent of Millennials intend to vote Conservative at the next general election compared to 45 per cent who intend to vote Labour[6].
According to Burn-Murdoch, the Millennial Republican vote in the United States is more nuanced. American Millennials were just under 10 percentage points less likely to vote Republican in elections held in their early twenties compared to the national average. The modest shift towards voting Republican in their thirties has since reversed, leaving their voting behaviour in their 40s not greatly different to that of their early elections.
This report finds strong evidence of an association between age and electoral behaviour that is more or less consistent with the much celebrated — and commonly misattributed — quote cited above. However, this association varies markedly across generations. It would seem the old saying is more apt for those born prior to 1980 than for those born after.
Having uncovered strong — and intergenerationally diverse — age effects in electoral behaviour, this report uses a simulation methodology to assess the extent to which these age effects are politically important. These simulations suggest that if the current low levels of support for the Coalition among younger generations are to continue, the inevitable increase in the percentage of Millennial and Generation Z voters will make it increasingly difficult for parties of the centre-right to win seats and maintain those they currently hold.
This report is not intended as an exercise in partisan political research. The political success of the Liberal Party of Australia, and its coalition partner, is only of consequence to classical liberals insofar as these parties’ policies continue to reflect the values of classical liberalism. Former Liberal Prime Minister John Howard saw his party as the custodian of the classical liberal tradition of John Stuart Mill and the conservative tradition of Edmund Burke stating that the party was at its best when “…it balances and blends those two traditions.”[7]. If this is to be true of future Coalition governments, the low levels of support among younger voters should be of great concern and a quantification of their electoral impacts of some interest to classical liberals.
Although those on the centre-left might have little interest in the political fortunes of the Coalition, or the extent to which government policy is shaped by classical liberal values, the possibility that generational change could relegate the Coalition parties to minor party status should also be of concern. The nature of Australian public policy will be quite different if it is to be formulated in the context of a centre-left government, held to account by a far-left opposition, than by one of the centre-right.
Future research will focus on what factors may explain the association between age and support for parties of the left and right. This research will also seek to understand why the relationship between age and voting behaviour is so different across generations.
2. Generational change vs cyclical change
Since the loss of the federal election last year, the Coalition has suffered a defeat at a state level in New South Wales and a loss to an incumbent government at a federal by-election — something not seen in Australian politics in over a century[8]. Having lost the last federal election, the only remaining Coalition government at the time of writing is the state government in Tasmania.
While support for the Coalition may appear to be at its lowest ebb, in terms of federal seats held and number of Coalition governments nationally, the last election was not a resounding victory for the ALP. Despite forming a majority government following the 2022 election and achieving a similar National TPP to that of the 2007 ‘Rudd slide’, the ALP’s primary vote at the 2022 election was — at 32.6 per cent — more than 10 percentage points lower than in 2007[9]. Labor holds power on a margin of two seats. Though the Coalition’s defeat in 2022 was the most decisive since the party’s founding, had the Liberal Party held on to the eight seats that fell to ‘Teal’ candidates the 2022 defeat would have been on par with the end of the Howard Government in 2007.
There is an undeniable ebb and flow of Australian politics where just about anything can — and will — happen. Governments and oppositions that looked unassailable have frequently been the subject of sudden reversals of political fortune in recent years. Less than three years after beating Bob Hawke’s record as Australia’s second longest serving Prime Minister, John Howard lost the 2007 election and his seat of Bennelong. In March 2009 Kevin Rudd was the highest polling Australian Prime Minister on record, only to be ousted by his own party not much more than a year later — with Labor reduced to minority government at the following election[10]. Tony Abbott won a convincing majority in 2013 only to suffer a similar fate to Kevin Rudd, as the Coalition saw their 15-seat majority cut to one seat at the subsequent election. Labor leader Bill Shorten looked destined for the Lodge in May 2019 having been ahead in just about every Newspoll since the previous election — the Coalition held on to power by a single seat[11].
One of the few certainties of Australian politics is that support for political parties can swing toward, and away, from parties as governments and oppositions make inevitable political mistakes. However, the political cycle occurs within a landscape of structural forces like generational demography that are continuously at play. If a political party finds itself swimming against the structural tide, it will require pivotal blunders on the part of its adversaries to regain the political advantage.
The problem the Coalition faces is that its current electoral woes are not of a purely cyclical nature. As this report will demonstrate, generational change can have a significant impact on the political fortunes of a party. What the analysis in this report provides is a sense of the magnitude of the task that now befalls the Coalition if they are to remain the primary party of opposition, much less return to government.
3. Are young voters deserting the Coalition?
3.1 The 2022 election
In May last year the Australian Labor Party (ALP) returned to power federally under the leadership of Anthony Albanese, after almost nine years in opposition. Voters under 40 were instrumental in the Coalition’s defeat. According to the 2022 Australian Election Study (AES), conducted shortly after the election, Millennials (born 1981 to 1995) provided the Coalition with their lowest number of first preferences since they began voting in 2001 (22.9 per cent). Among Millennials, the Coalition polled fewer primary votes than the Australian Greens; a political party generally thought of as a minor party. The Coalition primary vote was, at 23.1 per cent, not greatly different among Gen Z with a third of this youngest generation voting for the Australian Greens (henceforth the Greens).
Text Box I: Australian Political Surveys
Australian Election Study
The Australian Election Study (AES) is a nationally representative Australian survey that has been conducted after every federal election since 1987[12]. The purpose of the AES is to provide a long-term perspective on Australians’ political attitudes and voting behaviour, and to provide insights into the political issues specific to each election and assess their importance in determining the election result. The AES builds upon the earlier Australian National Political Attitudes Surveys (ANPAS) conducted in 1967,[13] 1969 and 1979.[14] For the purposes of this report the term ‘AES data’ refers to the combined AES and ANPAS samples which span a period that encompasses Australian federal elections held in 1966, 1969, 1980 and from 1987 to 2022. There were no AES surveys conducted following the federal elections of 1972, 1974, 1975 and 1983, however the 1979 survey contains retrospective questions on who the respondent voted for at the 1975 and 1977 elections.
The AES utilises a probability sample whereby respondents are recruited via random selection from a specified sampling frame; in this instance the Australian electoral role. This was supplemented with a probability sample taken from the Geocoded National Address File (G-NAF) in 2016, with the full sample subsequently sampled from the G-NAF in 2019 and 2022.[15] The AES survey has been mailed out to potential respondents for completion since 1987 with an option for online completion introduced in 2010.[16] Prior to 1987 data was gathered via interviews. The 2013 and 2022 survey included a supplemental sample of younger Australians on account of an under-sampling of voters aged 18 to 24[17]. The AES data are available from Dataverse (dataverse.ada.edu.au/dataverse/aes) and the Australian Election Study website (australianelectionstudy.org) where further details on methodology, questionnaires, codebooks and technical reports can be found.
Newspoll
Newspoll is a nationally representative online political poll conducted fortnightly on behalf of The Australian newspaper. Initially established in 1985 and conducted by YouGov Galaxy Pty Ltd since December 2017. The Newspoll sample is taken from YouGov Galaxy’s online research panel and typically involves a sample of over 1,500 respondents. The estimates presented in Figure 2B come from a pooled sample of three Newspolls taken between February 1 and April 3, 2023, providing a combined sample of 4,756 respondents (Benson, 2023). In addition to demographic characteristics, respondents are asked: Thinking about federal politics. If a federal election for the House of Representatives was held today, which one of the following [political parties] would you vote for? Newspoll also includes questions on satisfaction with the Prime Minister and the opposition leader, and which of the major party leaders is their preferred Prime Minister.
Unsurprisingly, given the 2022 change of government, support for the Coalition among older voters was lower than that of recent elections. As indicated in Figure 1, a third of Gen X gave the Coalition their first preference, the lowest level since they first began voting in 1987[18]. At 42.4 per cent, the Coalition primary vote among Boomers was the lowest since Labor narrowly clung to power at the 2010 election (41.1 per cent). Among the Silent Generation (born 1928 to 1945), the Coalition primary vote was just under 50 per cent, the lowest since Labor last won government in 2007.[19]
Figure 1 First preference vote for the major parties in the House of Representatives, 1987 to 2022
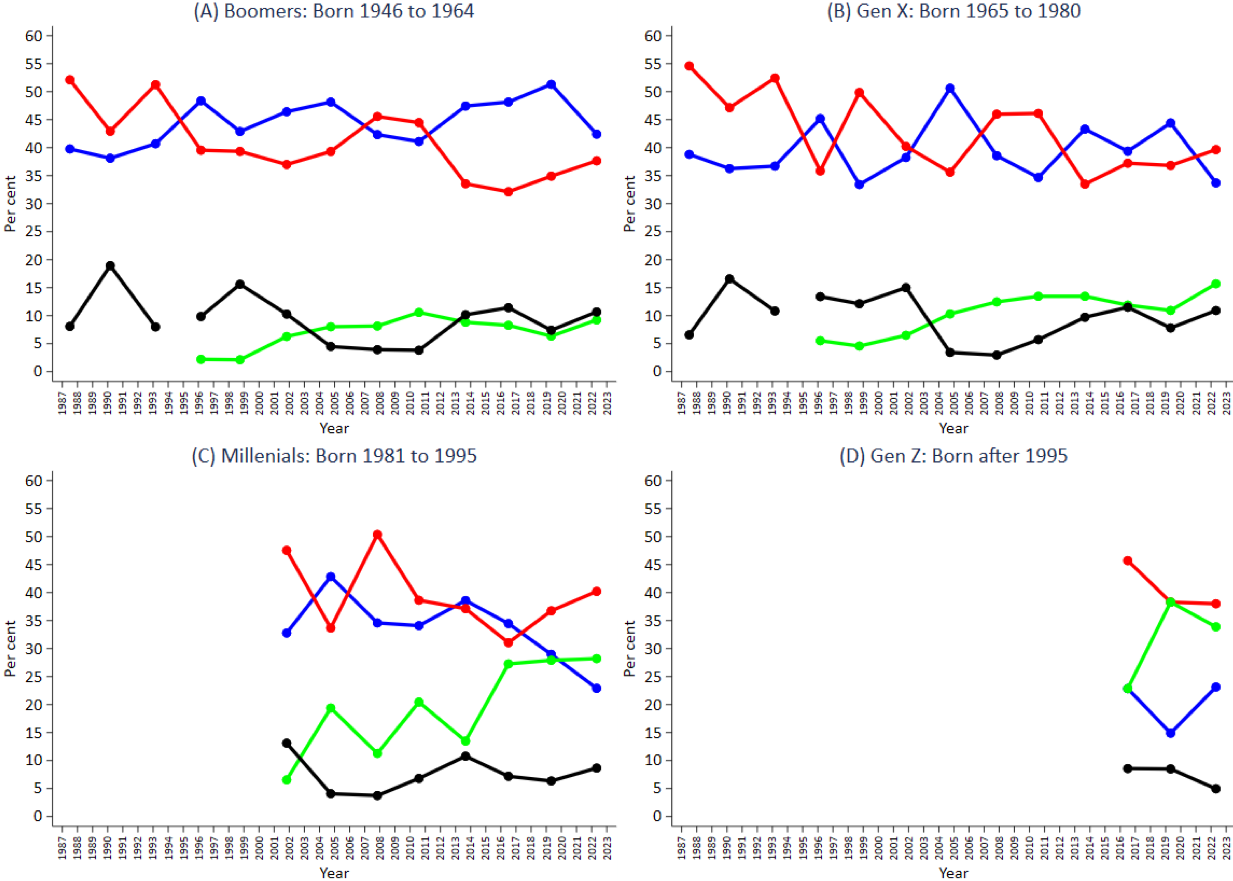
Notes: Blue indicates Liberal Party of Australia, red indicates the Australian Labor Party (ALP), green indicates the Australian Greens and black indicates all other (minor) political parties and independents combined. The Australian Greens are included in ‘other’ prior to the 1996 election.
Source: Australian Election Studies, 1967 to 2022.
An interesting feature of the 2022 AES election data is the comparative similarity in the primary vote for the ALP across the post-war generations. The ALP primary vote ranged from 37.7 per cent among Boomers to 40.2 per cent among Millennials. For the most part, the lower Coalition primary vote observed among the younger generations mostly reflected a higher primary vote for the Greens.
From their humble beginnings of 2.9 per cent of the primary vote in the 1996 election,[20] the Greens have increased their primary vote dramatically over time — especially among younger voters[21].
3.2 Post-election support for the major parties
Support for the Coalition does not appear to have recovered since their 2022 election loss. The top panel of Figure 2 presents the primary vote for the Coalition, the ALP, the Greens and ‘other’ political parties across four age groups as measured in the 2022 AES by age of respondent at the time of the election (panel A). The lower panel presents similar estimates from three collections of Newspoll conducted between February 1 and of April 3, 2023 (panel B).[22] Figure 2B suggests little improvement in the Coalition’s position across age groups since the 2022 election.
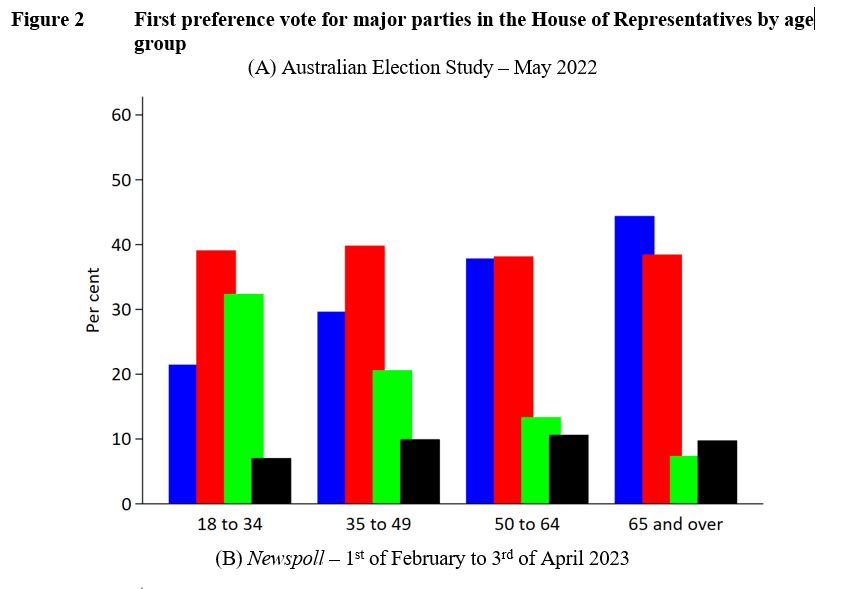
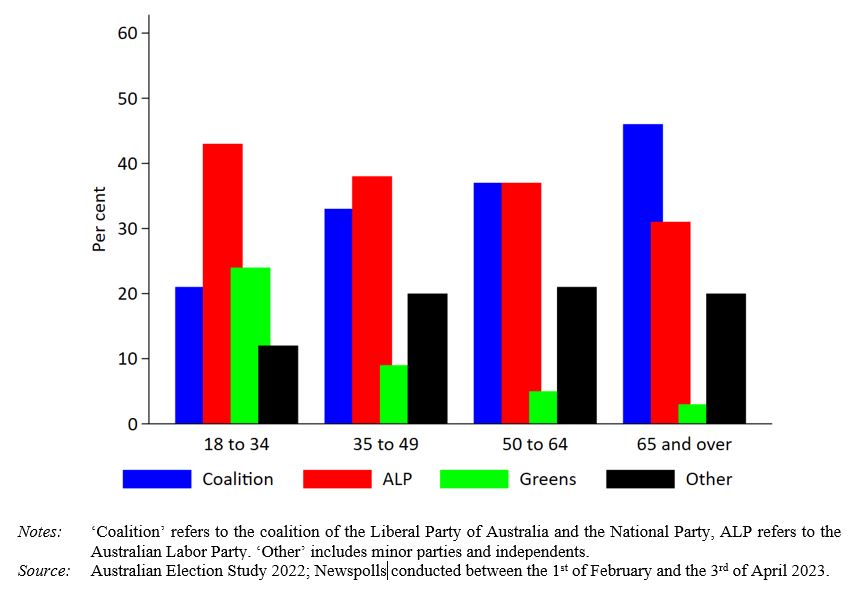
One of the striking features of Figure 2 is that support for the Greens is higher than for the Coalition among the 18–34 age group (Gen Z and younger Millennials) both at the election and in the more recent polls. Put another way, were the electorate entirely made up of Gen Z and the youngest Millennials, the Greens — not the Coalition — would be the primary party of opposition.
3.3 Generational change
Such low levels of support for the Coalition among voters under the age of 50 should be of concern; not just for those who would like to see the Coalition parties returned to government, but also for those who would prefer a centre-right opposition over a far-left one. If these levels of support for the Coalition are indicative of how these younger generations will vote in subsequent elections, and indicative of how future generations of young voters will vote in future elections, it is difficult to see how the coalition parties will remain politically relevant in the years to come.
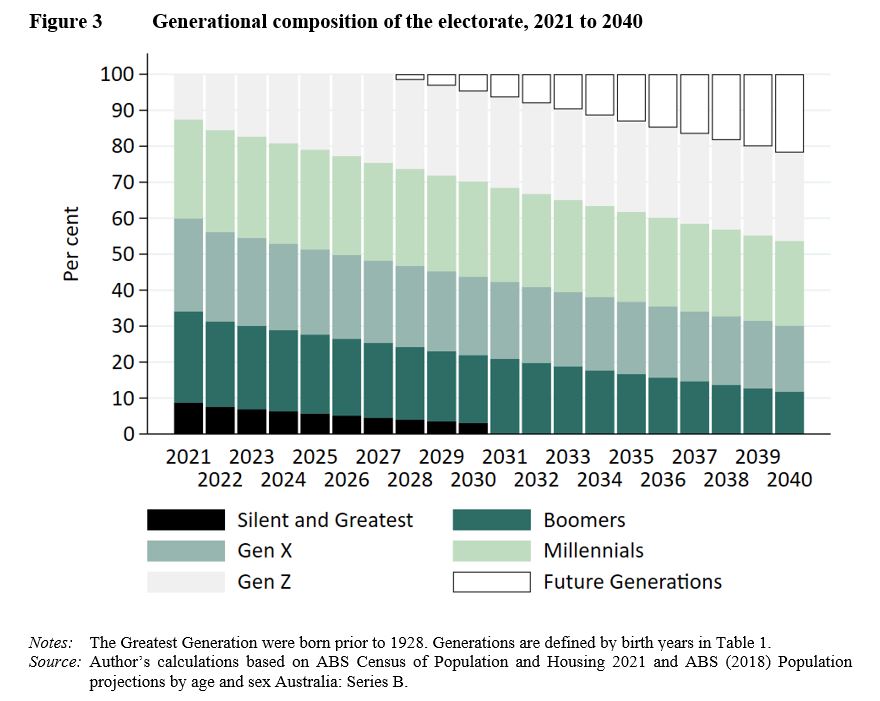
Figure 3 provides an insight into the demographic shift that will occur in the Australian federal electorate over a period that is likely to span at least seven federal elections. The figure presents the generational composition of Australians aged 18 years and over from the 2021 Australian Bureau of Statistics (ABS) Census of Population and Housing alongside that which the ABS expects to observe between 2022 and 2040.[23] The Silent Generation and Boomers, (combined from those 58 and over), made up just under a third of the electorate at the last election (31.3 per cent). This is somewhat less than the 43.8 per cent of voters under the age of 40, mostly made up of Millennials (28.3 per cent) but also Gen Z (15.5 per cent). Nestled between these cohorts was Gen X who made up just under a quarter of voters (24.9 per cent).
According to the ABS population projections, the electorate will continue to age between now and 2040 with the average voter age increasing from 47.3 to 48.7 years.[24] However, this modest increase in the average age of the electorate belies the significant generational change that will occur over this period. By 2040, the Silent Generation will have left the electorate entirely, and Boomers will make up 11.8 per cent of voters — approximately a third of their contribution to the electorate in 2022. The share of the electorate made up of Gen X is also projected to fall from one-in-four to a little under one-in-five voters (18.4 per cent).
The decline in the electoral power of Boomers and Gen X will coincide with the rise of Millennials, Gen Z and the generation that will follow them. At the 2022 election, Gen Z voters made up less than half that of Boomers; with many yet to vote in their first federal election. By 2040, the entirety of Gen Z will have reached the voting age and they will make up almost a quarter of the national electorate. Together, Gen Z and the generation that follows will make up 46.3 per cent of the electorate. Combined with Millennials, those currently considered ‘younger voters’ and those yet to cast a vote, will make up 69.8 per cent of the electorate. The demographic change depicted in Figure 3 is a structural feature of the political landscape, not a cyclical and its impact on electoral outcomes can be consequential.
3.4 At what age do Australian voters choose ‘head over heart’?
The rise in the electoral power of Millennials, and the post-Millennial generations, does not in itself portend electoral disaster for the Coalition nor necessarily triumph for parties of the left. If the ABS projections prove accurate, the electorate will continue to age which — if the adage cited in the introduction is true — should advantage parties of the right. However, an older electoral demography is of little consequence in the absence of an association between age and voting behaviour. An ageing electorate is potentially advantageous to the political right only if:
- there is a positive relationship between age and voting for parties of the centre-right — at least on average; and
- enough of the electorate has reached the age at which they are, on average, more inclined to vote for parties of the right.
Variation in the age distribution across electorates will then determine the extent to which this voting ‘age effect’ matters for electoral outcomes, as will variation in preference flows between political parties across electorates in the context of Australia’s preferential system of voting.
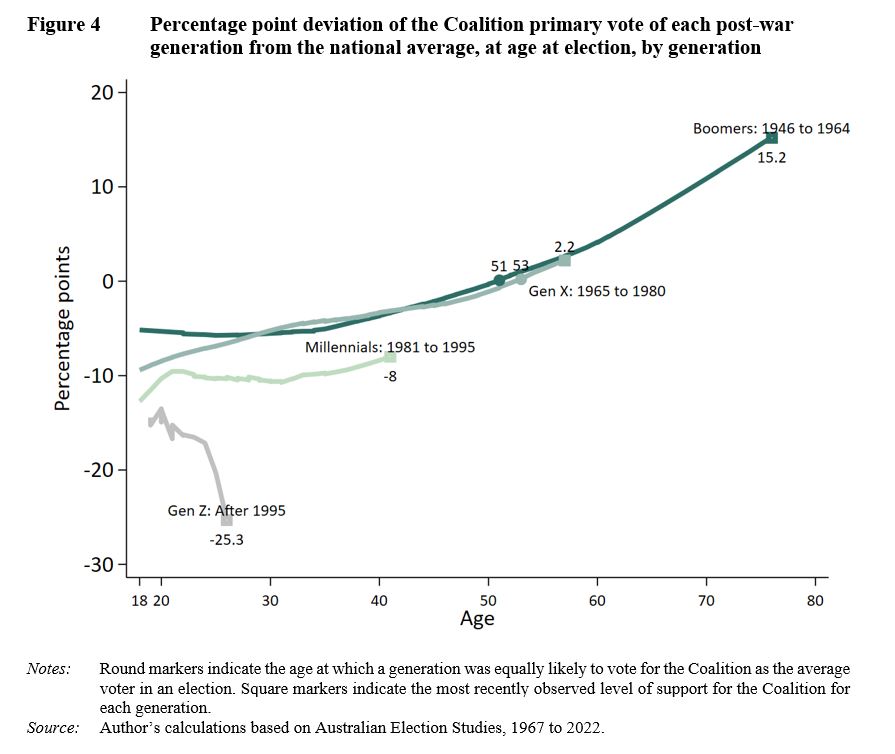
Figure 4 provides an insight into the voting age effect in Australian elections between 1966 and 2022 for which there are AES data.[25] The figure presents estimates of the difference between the average primary vote for the Coalition for a specific age group vs. for all voters who voted in that election. These estimates give an indication of the extent of support for the Coalition among a particular age group, compared to the overall level of support for the Coalition at the election. This essentially adjusts the age group’s support for the Coalition for factors specific to the election, enabling a clearer picture of the age effect to emerge over the life course. The lines in the figure provide smoothed estimates of these election-adjusted primary votes in the neighbourhood of each age, using Cleveland’s (1979) ‘lowess’ method. This approach is applied to the election adjusted estimates for each generation defined in Table 1.
Figure 4 demonstrates a strong age effect in the centre-right primary vote in Australian elections; an effect that varies dramatically across generations. Insofar as one believes support for the Coalition above the election average represents an electoral choice of head over heart — an assertion to which many on both the right and the left would object — the adage appears only partially correct. It would also seem more apt for some generations of voters than for others.
The average member of the Boomer generation and Gen X had levels of support for the Coalition lower than the average voter in elections held prior to their fiftieth birthday. The average member of Gen X was slightly less than 10 percentage points less likely to vote for the Coalition than the average voter in their early federal elections, held between 1987 and 1998. Over time, Gen X increased their (relative) support for the Coalition, reaching parity with the average voter in their early 50s in elections held after 2016. As Gen X enters their later fifties, they appear slightly more pro-Coalition than the average voter.
Figure 4 suggests the Boomers that preceded Gen X entered the electorate with comparatively higher levels of support for the Coalition at 5.2 percentage points below the average voter. Boomers reached parity with the average voter at the age of 51, just two years prior to Gen X. However, it is possible that were AES data available for elections held in the 1970s, they would show that Boomer’s support for the Coalition in their earlier years was lower than that indicated in Figure 4 and closer to that observed for Gen X at the same ages. These missing AES years ensure that the age effects observed for Boomers in their younger years are estimated from data on the older cohorts of the Boomer generation (see endnote 25). Only those Boomers born before 1948 were able to vote in the 1969 election.[26]
Unless one genuinely believes the Boomers in the 1970s were in fact more conservative than the average voter, Figure 4 demonstrates that Boomers and Gen X all entered the electorate with a comparatively unfavourable view of the Coalition but increased their support over time. However, it would seem these generations would choose head over heart at an age somewhat older than 40. As of the most recent election, Boomers were 15.2 percentage points in favour of the Coalition, with Gen X 2.2 percentage points in favour.
3.5 Will Millennials and Gen Z move to the right?
The most striking aspect of Figure 4 is how different the voting behaviour of Millennials and Gen Z is to that of the generations that came before. All the post-war generations entered the electorate with a comparatively unfavourable view of the Coalition; in this sense Millennials and Gen Z were no different. However, what makes these younger generations distinct is the extent of their comparative dissatisfaction with the Coalition parties. In their earliest elections, Millennials were just under 13 percentage points less likely to vote for the Coalition compared to the average voter; viewing the Coalition more negatively than did Gen X in their first elections. While there is some evidence of this generation increasing their support for the Coalition as they enter their forties, there would need to be a very abrupt move to the political right among this generation for them to achieve parity with the average voter in their fifties as has been observed for Boomers and Gen X.
Gen Z stands out as a very distinct political generation. Those born after 1995 entered the electorate viewing the Coalition more unfavourably than any generation on record[27]. At -14.4 percentage points, Gen Z’s comparative disapproval of the Coalition is somewhat greater than that observed for Millennials at a similar same age. In contrast to Millennials, there is absolutely no evidence of any shift to the right among Gen Z as they age. If anything, Gen Z appears to have moved further to the left of the average voter, with an election-adjusted level of support for the Coalition of -25.3 per cent as they enter their late twenties. Unless there is an abrupt reversal at future elections, it is hard to imagine that Gen Z will ever favour the Coalition more than the average voter.
One way to understand the diversity in political age effects across the generations observed in Figure 4 is to ask: At what rate would Millennials and Gen Z have to move their support in favour of the Coalition to reach parity with the average voter at an age similar to that observed for Boomers and Gen X?
At the most recent election, Millennials were -8 percentage points in favour of the Coalition. This generation would have to increase their support for the Coalition by 1.7 percentage points over each electoral cycle to reach parity with the average voter by the age of 55. At their current rate of 0.6 percentage points, this is unlikely to occur prior to them turning 80.
Since Gen Z had far lower levels of support for the Coalition at the last election, this generation would need to increase their support by 2.7 percentage points per electoral cycle to reach parity with the average voter by the age of 55. In contrast to Millennials, at the last election Gen Z were not moving their support towards the Coalition at a glacial pace — they were moving away at a rate of knots.
The rate of increase required for these younger generations to reach parity with the average voter is significant. To provide some context, between the ages of 42 and 55, Boomers increased their support for the Coalition by 1.1 percentage points in each electoral cycle, on average. The increase in support among Gen X at these ages was just under 1 percentage point on average. For Millennials to reach parity with the average voter by the age of 55, they would need to increase their support for the Coalition at almost double the rate observed for Boomers or Gen X over the same age range.
Among Gen Z, a 2.7 percentage point increase per electoral cycle between the age of 27 and 55 would be historic. The average percentage point increase in support for the Coalition observed for Boomers and Gen X over this age range was less than 1 percentage point per electoral cycle.
In summary, if the youngest generations of voters are to follow older generations in favouring the Coalition over other parties in their 50s, they will have to move to the right over the coming years at a rate not observed for any generation born in the post-war era.
4. Where have the Coalition votes gone?
Figure 5 presents the same estimates of election adjusted primary vote for the ALP (red), the Greens (green) and other political parties and for independents and non-Green minor parties combined (black) for the post-war generations. The estimates for the Coalition observed in Figure 4 are reproduced for reference (blue).
4.1 Boomers
Figure 5 demonstrates the extent to which the Boomers move towards the Coalition came mostly at the expense of minor parties rather than the ALP.[28] When Boomers began voting, they were 3.4 percentage points more likely to vote for the ALP than the average voter; by their late-forties they were close to parity with the average voter. Prior to their late-fifties, Boomers’ support for the Greens was little different to that of the average voter. Since then, their relative level of support for the Greens has declined to just under -8 percentage points. Boomers’ support for other minor parties also declined from 2 percentage points in their early elections to -8 percentage points.
Figure 5 Percentage point deviation of the Coalition, ALP and Greens primary vote from their respective election averages
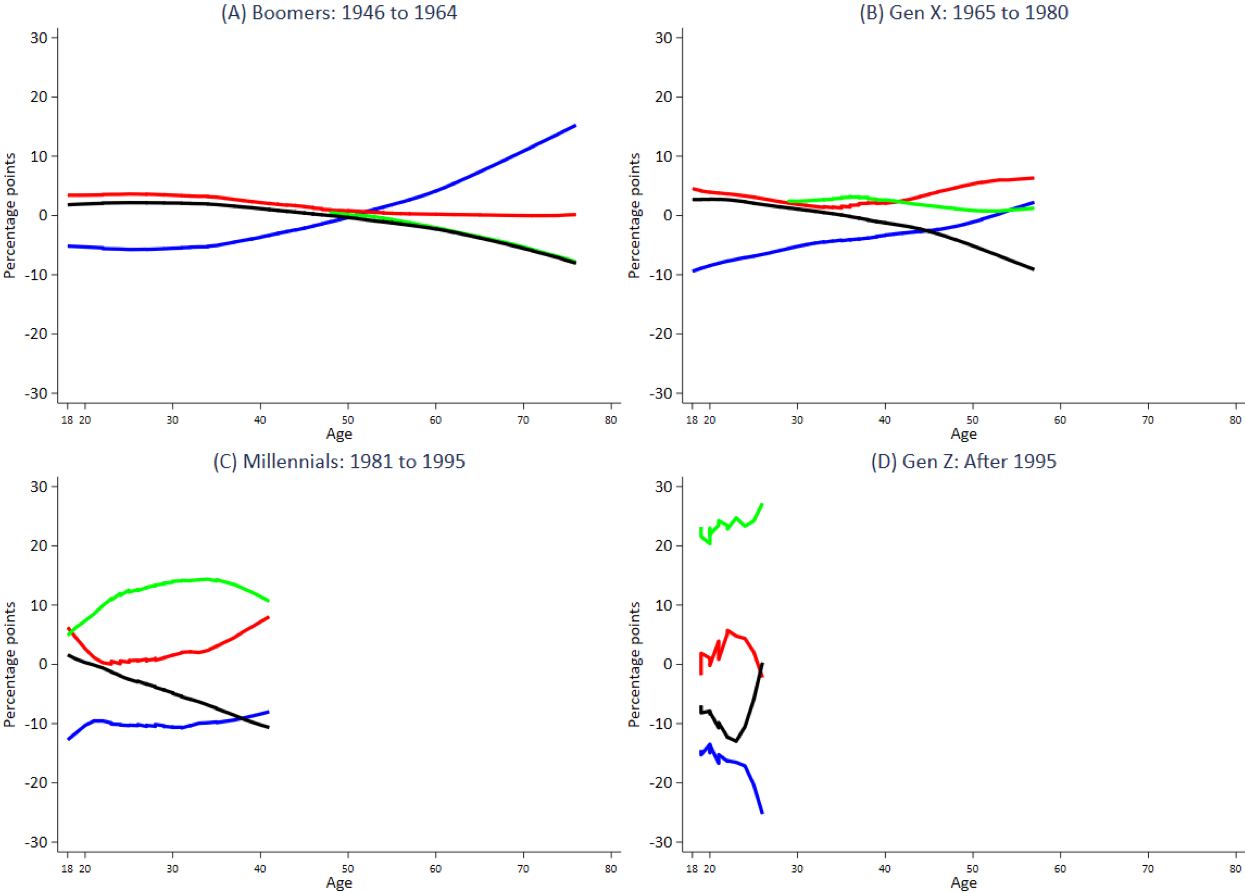
Notes: Blue indicates Liberal Party of Australia, red indicates the Australian Labor Party (ALP), green indicates the Australian Greens and black indicates all other (minor) political parties and independents combined.
Source: Author’s calculations based on Australian Election Studies, 1967 to 2022.
4.2 Gen X
Prior to their mid-30s, Gen X’s move to the right appears to have come at the expense of the ALP and the minor parties, with relative support for the ALP falling from 4.5 to 1.3 percentage points. However, Figure 4(B) suggests that in more recent times, both the ALP and the Coalition have benefited from a continuing decline in this generation’s relative support for the Greens and other minor parties.
4.3 Millennials
The lower panels of Figure 4 underline just how different the voting behaviour of Millennials and Gen Z has been compared to previous generations — but also quite different from one another. The glacial rise in relative support for the Coalition among Millennials appears to have coincided with more pronounced growth in relative support for the ALP, both coming at the expense of the Greens and other minor parties, beginning in their mid-30s.
4.4 Gen Z
While Millennials have moved towards the major parties, Gen Z have been pushing away. Among Gen Z, the plunge in relative support for the Coalition has not resulted in a higher election-adjusted primary vote for the ALP which has fallen to -2.2 percentage points at age 26 down from 5.7 percentage points in their early twenties. Gen Z’s support for the Greens is also far greater than that among Millennials when they were in their early twenties. Relative support for the Greens among Gen Z has ranged from 15.5 percentage points to 27.2 percentage points — far higher than the 4.9-12.6 percentage points observed for Millennials at the same age. Of course, this is not overly surprising in light of the very high Greens primary vote among 18 to 34 year olds observed in Figure 1. Another important point of difference between the two youngest generations is their support for other minor parties. Where Millennials have moved towards the major parties over time, there has been an abrupt increase in support for minor parties among Gen Z.
5. The potential electoral impacts of generational voting
5.1 Simulating electoral impacts of generational change
Taken together, Figure 3 and Figure 4 suggest the Australian electorate will undergo considerable generational change in the years to come. Figure 3 demonstrates how the coming elections will have a very different generational make-up than those that preceded them. Figure 4 underlines some profound differences in the life-course voting behaviour of Millennials and Gen Z compared to those that preceded them. This section turns to the question of whether these generational voting age effects, combined with the changing generational composition of the electorate, might have meaningful electoral consequences. This question is explored using a simulation technique described in Appendix I.
In simple terms, the simulation presented in this sub-section (Simulation I) takes the most recent estimates of relative support for the Coalition observed for each generation in Figure 4, to form an estimate of the age effect for each electorate in the House of Representatives. These simulated estimates take into account the projected generational composition of each electorate at the time of the hypothetical election. These electorate level age effects, which are on average negative across electorates, are then added to the Coalition primary vote observed at the 2022 election thereby reducing it in most instances. Text Box II presents the construction of the simulated primary vote for the seats of Gilmore and Deakin for the projected electoral demography in an election held in 2025.
Text Box II: A tale of two electoral divisions
Gilmore
This coastal electorate extends along the coast from Kiama in the north to Tuross Head in the south and encompasses the regional towns of Batemans Bay, Nowra and Ulladulla (Australian Electoral Commission, 2019). The seat is currently held by ALP MP Fiona Phillips who won the seat following the retirement of the Liberal Party’s Ann Sudmalis in 2019. The ALP holds Gilmore by a wafer-thin TPP margin of 0.2 per cent; having been contested at the 2022 election by former Liberal state treasurer Andrew Constance, who was able to achieve a 2.4% swing towards the Liberal Party (Green, 2022b). Despite narrowly losing to the Labor candidate, Constance was able to achieve a higher primary vote (42 per cent to 36 per cent). The Labor victory in 2022 was in no small part a result of preference flows from the Greens, who polled a respectable 10.2 per cent of the primary vote.
The third and fourth columns of Table B1 present the generational composition of Gilmore in 2022 and the predicted composition for 2025. Gilmore is a relatively old electorate in demographic terms; in 2022, half of Gilmore’s voters were born before 1946 and were at least 76 years of age on election day. Were an election held in 2025, this percentage would fall by 5 percentage points to 45 per cent. Boomers would remain the largest generation in the electorate at 36 per cent, however the percentage of the electorate made up of Millennials and Gen Z will have increased by 5 percentage points to 29 per cent.
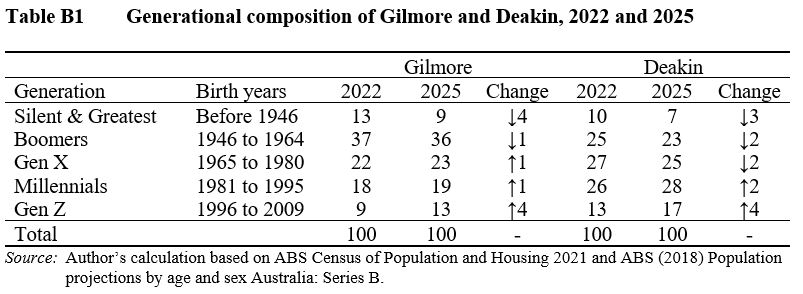
The first step is to calculate the overall age effect for the electorate, taking into account the predicted generational composition of the electorate for 2025 shown in Table B1. This involves weighting the voting age effects for each generation observed in Figure 4 by their contribution of each generation to the overall Gilmore electorate in 2025.
2.3 = 0.09 ×12.9+ 0.36 × 15.2 + 0.23 × 2.2 + 0.19 × -8.0 + 0.13 × -25.3
This suggests that in 2025, the overall age effect for Gilmore should increase the primary vote of the Coalition candidate by 2.3 percentage points. This occurs because the oldest voters (Greatest and Silent Generations), Boomers and Gen X have reached an age where they view the Coalition more favourably than the average voter (see Figure 4). These generations are projected to make up 68 per cent of the electorate in 2025. This very high percentage of older voters is enough to offset the large negative age effects observed for younger voters (Millennials and Gen Z) who make up just 22 per cent of the 2025 Gilmore electorate.
The simulated Coalition primary vote for the 2025 election is the sum of this age effect and the Coalition primary vote observed at the 2022 election:
44.3 = 42 + 2.3
The Two Candidate Preferred (TCP) is then calculated assuming preferences flows as they did at the 2022 election producing a simulated 2025 TCP for the Coalition candidate of 52.3 per cent. As this is a ‘classic’ Coalition-ALP contest, the TCP is also the Two Party Preferred (TPP). With a TCP greater than 50 per cent, the Coalition candidate is projected to win the seat.
Deakin
The seat of Deakin is in outer-metropolitan Victoria in Melbourne, stretching from Croydon to Blackburn (Australian Electoral Commission, 2022b). Like Gilmore, Deakin is an ultra-marginal seat though one currently held by the Liberal Party’s Michael Sukkar who was housing minister in the Morrison Government. Sukkar holds Deakin by a TPP margin of just 0.2 per cent having suffered a 4.5 per cent swing to the ALP at the 2022 election.
As shown in Table B1, Deakin is a relatively young electorate — most certainly when compared to Gilmore. At the 2022 election Boomers made up 37 per cent of Gilmore voters, in Deakin the combined Greatest, Silent and Boomer generations made up 35 per cent of the Deakin electorate.
As in Gilmore, Millennials and Gen Z will make up a greater proportion of the electorate if an election is to be held in 2025. At the 2022 election these generations made up 39 per cent of the electorate, in 2025 they are projected to make up 45 per cent.
Applying the same approach as for Gilmore, the overall age effect for Deakin in 2025 implied by Table B1 is:
-1.6 = 0.07 ×12.9+ 0.23 × 15.2 + 0.25 × 2.2 + 0.28 × -8.0 + 0.17 × -25.3
In contrast to Gilmore, the overall age effect for Deakin implies a reduction in the primary vote of the Coalition on account of Deakin having more than double the percentage of Millennials and Gen Z voters (45 per cent versus 22 per cent). While this age effect is small in absolute terms, due to the ultra-marginal nature of the electorate it is enough for the seat to change hands at a hypothetical 2025 election. Adding this (negative) age effect to the Liberal 2022 primary vote of 41.5 per cent implies a hypothetical primary vote of 39.9 per cent. After the distribution of preferences, the Coalition’s TCP is simulated to fall to 48.8 per cent whereby the seat falls to the ALP candidate.
In summary, Simulation I can be described thus:
Simulation I assumes each generation has an election-adjusted Coalition primary vote equal to that of the oldest of each generation observed at the 2022 election, and that this level of support remains the same at future elections. While voting behaviour remains frozen in time, the contribution of each generation to the electorate changes considerably with the share of the electorate made up of Boomers and Gen X declining and the share of voters born after 1980 increasing.
The average reduction in the Coalition primary vote across all 151 electorates resulting from generational change is simulated to be -2.1 percentage points at a hypothetical election held in 2025, -5.6 percentage points in 2031 and -10.7 percentage points in 2040.
5.2 Impact of generational change on the Average Primary Vote
Before turning to the results of Simulation I, the top panel of Table 2 presents some statistics concerning the 2022 election constructed from AEC data and other sources. The National Primary Vote (NPV) for the Coalition parties was 35.7 per cent at the 2022 election, somewhat higher than the 32.6 per cent achieved by the ALP; who nonetheless formed majority government. The Greens received 12.2 per cent of the NPV. ‘Other’ in the NPV row in Table 2 includes all other parties that fielded candidates. The better-known of the minor parties included in the other category are One Nation, the United Australia Party, Katter’s Australian Party and the Centre Alliance. It also includes independent candidates not affiliated with any party. These ‘other candidates’ received the remaining 19.5 per cent of the NPV in 2022.
Turning to the results of the first simulation, Table 2 (column 2) suggests generational change could result in a reduction in the Average Primary Vote (APV) of the Coalition by one percentage point at the 2025 election.[29] At the 2031 election, the Coalition APV is simulated to fall by a further 3.2 percentage points to 30.4 per cent. Over the subsequent three electoral cycles the Coalition APV is simulated to fall another 4.9 percentage points culminating in a 9.1 per cent drop between 2022 and 2040.[30]
Table 2 Simulated election results for Simulation I, 2025, 2031 and 2041
| Party | Coalition | ALP | Greens | Independents‡ | Other |
| Election 2022 | |||||
| National Two Party Preferred | 47.9 | 52.1 | – | – | – |
| National Primary Vote | 35.7 | 32.6 | 12.3 | – | 19.5 |
| Average Primary Vote† | 34.6 | 32.7 | 12.2 | 31.0 | – |
| Average Two Candidate Preferred | 45.3 | 45.7 | 2.7 | 6.3 | – |
| Seats | 58 | 77 | 4 | 12 | – |
| Simulated Election 2025 | |||||
| Average Primary Vote† | 33.6 | 34.4 | 12.3 | 31.6 | – |
| Average Two Candidate Preferred | 43.4 | 47.3 | 2.9 | 6.4 | – |
| Seats | 55 | 80 | 4 | 12 | – |
| Simulated Election 2031 | |||||
| Average Primary Vote† | 30.4 | 37.2 | 12.4 | 34.5 | – |
| Average Two Candidate Preferred | 40.1 | 50.2 | 2.9 | 6.7 | – |
| Seats | 41 | 94 | 4 | 12 | – |
| Simulated Election 2040 | |||||
| Average Primary Vote† | 25.5 | 41.5 | 12.5 | 39.1 | – |
| Average Two Candidate Preferred | 35.3 | 54.4 | 2.9 | 7.3 | – |
| Seats | 23 | 107 | 4 | 17 | – |
| Simulated 2022 to 2040 change | |||||
| Average Primary Vote† | -9.1 | 8.8 | 0.3 | 8.1 | – |
| Average Two Candidate Preferred | -10.0 | 8.7 | 0.3 | 1.0 | – |
| Seats | -35 | 30 | 0 | 5 | – |
Notes: †Average Primary Vote refers to the average primary vote across electorates the party contested and is not expected to sum to 100 across parties. ‡Independents include Katter’s Australian Party (Bob Katter), the Centre Alliance (Rebekha Sharkie), Andrew Wilkie, Helen Haines in addition to ‘Teal’ independents (see Appendix II for further discussion of the independent category).
Source: National Two Party Preferred figures sourced from Australian Electoral Commission (2022a) and National Primary vote sourced from Green (2022). Election 2022 Average Primary Vote and Average Two Candidate Preferred are author’s calculations using data contained in Australian Electoral Commission (2022b). Remaining figures are author’s modelling incorporating the ABS Census of Population and Housing 2021, ABS (2018) Population projections by age and sex Australia: Series B and the Australian Election Studies, 1967 to 2022.
Table 2 (column 3) illustrates the extent to which the reduction in the Coalition APV advantages the ALP, suggesting a 1.7 percentage point increase in the APV of the ALP at the 2025 election to 34.4 per cent. Over the next two electoral cycles, the ALP APV is expected to increase by an additional 2.8 percentage points and by a further 4.3 percentage points over the next three cycles. All up, the ALP is simulated to increase its APV by 8.8 percentage points between 2022 and 2040.
Table 2 suggests very little change in the Green’s APV following the hypothetical 2025 election — which may seem unrealistic in light of Figure 5(D), especially as Gen Z come to form a larger percentage of electorate in coming years. This is a consequence of some of the limitations of the AEC preference flow data described in Appendix I, which prevent the hypothetical allocation of preferences to candidates who do not finish in the top-two at the 2022 election. Without going into granular details here, these data limitations are more problematic for simulating the relative electoral success of the ALP versus the Greens than they are for a hypothetical reduction in support for the Coalition relative to other candidates. With this in mind, Table 2 is likely to overestimate the likely future electoral success of the ALP and underestimate that of the Greens.
5.3 The potential impact of generational change on Two Candidate Preferred and Coalition seats won
Before turning to the simulation results, an interesting observation to be made from the first panel of Table 2 is the similarity in the Average Two Candidate Preferred (ATCP) of the major parties at the 2022 election, despite a convincing ALP election win on a seat by seat basis (77 to 58 in favour of the ALP) and a National Two Party Preferred (TPP) result 4.2 percentage points higher than the Coalition.[31] Of course, an ATCP below 50 does not mean a party cannot win an election, rather it suggests a significant showing of non-majors in the top-two candidates across a number of electorates and that the major party wins at the last election were narrow ones. The considerable gap between the ALP’s ATCP and their (national) TPP of 6.4 percentage points indicates the parties who placed second to a major party candidate would have been more inclined to allocate preferences to the ALP than to the Coalition.
In Simulation I, the ATCP for the Coalition is simulated to fall by 1.9 percentage points at the next election with an almost commensurate increase for the ALP (1.6 percentage points). The Coalition’s ATCP is predicted to fall a further 3.3 percentage points between 2025 and 2031, followed by an additional 4.8 percentage points drop between 2031 and 2040. Between 2022 and 2040, generational change is simulated to reduce the Coalition ATCP by 10 percentage points; mostly to the benefit of the ALP (8.7 percentage points), with independents increasing their ATCP by one percentage point and the Greens by 0.3 percentage points.
The simulated drop in the Coalition ATCP translates into the fall of 35 Coalition seats between 2022 and 2040 with three set to fall at the next election. Most of these are simulated to fall to the ALP with independents predicted to win five seats[32] by 2037.
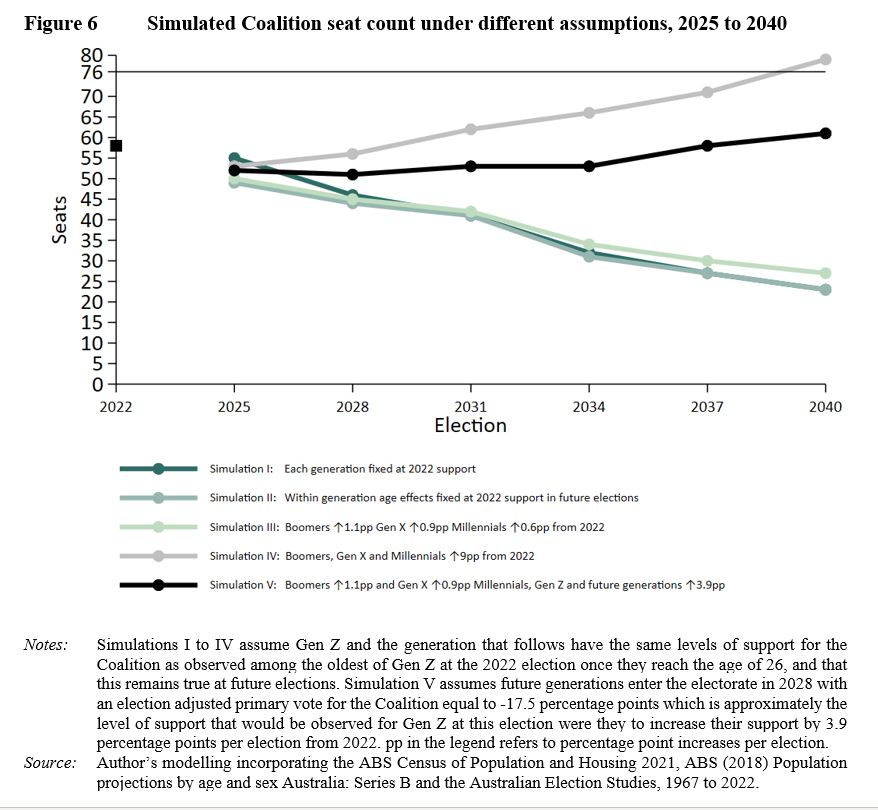
Figure 6 presents the seat count for simulations that make different assumptions about generational voting behaviour at future elections, and displays the simulated Coalition seat count for each election between 2025 and 2040 inclusive of Simulation I.
Figure 6 presents a second simulation, Simulation II, that makes slightly different assumptions to Simulation I that do not appear to change the simulated Coalition seat count to any great extent.
Simulation II assumes the youngest cohorts of each generation have an election-adjusted Coalition primary vote equal to that observed in Figure 4 when at the ages depicted in the figure. Once these voters attain the oldest age for their generation observed at the 2022 election, they are assumed to maintain this level of support for the Coalition in future elections (as in Simulation I).
Simulation II suggests a lower seat count for the Coalition compared to Simulation I at elections held prior to 2037; however the additional number of seats lost compared to Simulation I is not particularly large from 2031. This result is intuitive, considering the age effects observed in Figure 4. Even among the more pro-Coalition generations, the younger cohorts among Boomers and Gen X are observed to have lower levels of support for the Coalition than the oldest among them. Once every voter within a generation reaches the age of their oldest member in 2022, the seat counts for Simulation I and Simulation II coincide.
5.4 Will increasing Coalition support among voters born before 1996 stem the tide?
Simulation I and II both assume there is no change in the level of support for the Coalition beyond that observed at the 2022 election. In light of the upward trend in election-adjusted support for the Coalition observed for voters born prior to 1996, even if somewhat muted among Millennials, it is natural to wonder how the simulated Coalition seat count might evolve if these trends were to continue at future elections. It is this prospect that is the subject of Simulation III.
Simulation III assumes Gen Z and the generation that follows have the same (low) levels of support for the Coalition as observed among the oldest of Gen Z at the 2022 election, and that this remains true at future elections. Coalition support among Boomers, Gen X and Millennials is assumed to increase with age at the average rates implied by Figure 4. This suggests an increase in support for the Coalition among Boomers of 1.1 percentage points per election from 2025 to 2040 and 0.9 percentage points among Gen X. Millennials are assumed to increase their support for the Coalition at a more modest rate of 0.6 percentage points.
Simulation III suggests increased support among the three oldest generations of voters has the potential to deliver a higher seat count for the Coalition than if support remained fixed at 2022 levels. However, the electoral impact of these trends does not suggest much higher levels of seat retention. Assuming voters born before 1996 remain on their current voting trajectories, the Coalition is simulated to win 50 seats at the 2025 election in Simulation III compared to 49 in Simulation II.
5.5 Is the Coalition’s path back to power paved by ‘doubling down’ on voters born prior to 1996?
The results of Simulation III suggest that, even under an assumption that support among the older generations of voters will continue to increase as they have in the past, this would be insufficient to offset low levels of support among younger voters. Insofar as ‘doubling down’ on older voters might be thought to be a viable strategy for the Coalition, it is natural to ask: at what rate would Boomers, Gen X and Millennials have to move their support towards the Coalition to counter the low levels of support among those born after 1995? This is the subject of Simulation IV.
Simulation IV assumes Gen Z and the generation that follows have the same levels of support for the Coalition as observed among the oldest of Gen Z at the 2022 election and that this remains true at future elections. Coalition support among Boomers, Gen X and Millennials is assumed to increase by 9 percentage points per election from 2025 to 2040.
Simulation IV in Figure 6 suggests, that in the absence of an increase in support for the Coalition among the youngest voters, extremely large increases in support among older voters would be required to return the Coalition to government in six elections’ time.
To be clear, Simulation IV does not assume a 9 percentage point increase in Coalition support among Boomers, Gen X and Millennials between 2022 and 2040. Rather, it requires that the Coalition increase support among these generations by 9 percentage points at every single election for a cumulative increase of 54 percentage points by 2040 (3 percentage points per annum). It should be clear from Figure 4 that this would require a shift in support toward the Coalition that is unprecedented over an 18-year period. To provide some context for this assertion, it took Boomers and Gen X 41 and 33 years respectively to increase their (election adjusted) Coalition primary vote by 8.8 percentage points. It seems unlikely that the Coalition could, in the future, achieve such large gains over a three-year period and repeat such a feat at the next five elections. Were this to eventuate, the Coalition primary vote among Gen X would be on the way to 90 per cent by 2040 with a Boomer Coalition primary vote in excess of this. Millennials’ Coalition primary vote would be over 75 per cent. Again, such high levels of support — gained in such short period of time — seem unlikely.
5.6 If the tide won’t turn what would be required to tread water?
Simulation IV strongly suggests that the current low levels of support among the youngest generation of voters cannot be ignored — especially if these are to be replicated among the generation that follows Gen Z. The increase in support among voters born prior to 1996 required to compensate for such low levels of support among those born after 1995 is far too great to be practicable. Simulation III indicated that relying on Boomers, Gen X and Millennials to increase their support in line with current trends would do little to ameliorate the Coalition’s electoral pain in the absence of an increase in support among voters born after 1995. This is in part due to Millennials’ move towards the Coalition occurring at a rate far slower than that of earlier generations. Given the large decline in Coalition held seats implied by simulations I to IV, and the infeasibility of executing the shift in support required in simulation IV in particular, it is natural to ask: by how much would Coalition support among voters born after 1980 have to increase to maintain approximately the number of seats they currently hold? Simulation V addresses this question:
Simulation V assumes Boomers and Gen X increase their support for the Coalition at the average rates implied by Figure 4 (as in Simulation III). Coalition support among Millennials and Gen Z follows the trajectories presented in Figure 4 and is assumed to increase by 3.9 percentage points from the ages of 41 and 26 respectively. The generation that follows Gen Z is assumed to enter the electorate with a level of support for the Coalition of -17.5 percentage points below the average voter, increasing at a rate of 3.9 percentage points per election in line with Millennials and Gen Z.[33]
Simulation V suggests a return to the Coalition’s seat count at the 2022 election by 2037, followed by a modest increase at the following election. Though still 18 seats short of that required for majority government, this deficit is well within the bounds of the number of seats that have changed hands at elections that saw the Coalition return to government in recent decades.[34] A consistent shift of 3.9 percentage points per electoral cycle across a large portion of the electorate would be no mean political feat, but it is far more plausible than the 9 percentage points of Simulation IV.
6. Conclusion
The report does not provide an explanation as to why it is that Millennials have shown a greatly diminished inclination to move to the right as they age compared to previous generations, nor why it is that Gen Z has entered the electorate with such low levels of support for the Coalition that continue to fall. This is a task for future research in the CIS Intergenerational program’s series on generational voting behaviour — research that hopes to contribute to ensuring classical liberal values remain politically relevant in the years to come. Nor does this report offer a polemic on what policy positions or political strategy are required for the political parties of the centre-right to return to the Treasury benches. What it does offer is a warning: connecting with younger voters must be the centre-right’s highest priority; to ignore such low levels of support among those born after 1980 is to risk never returning to power. If the Coalition’s path back to power is thought to be paved by ‘doubling down’ on older voters and ignoring the young, it will prove a perilous one.
Political parties can do little to change the demography of the electorate. However, they can change how they and their current policies are perceived by younger voters, and formulate new ones. The simulations presented in this report offer a glimpse into a possible future; they are not fate. Their implication is not that the Coalition will never be able to return to government, rather that if current generational voting trends are to continue, this task will become increasingly difficult. Australian political history suggests the Coalition can win government from a seat count in the 60s, but there is no recent precedent in Australian politics for a party forming government from a seat count in the 50s.[35] It is difficult to see how, based on this report’s simulations, the Coalition can maintain the level of support required for the prospect of a return to government in the absence of a consistent increase in support among younger voters.
In the absence of a concerted effort on the part of the Coalition parties, it would be unwise to assume younger generations of voters will move to the centre-right as they grow older, as Boomers and Gen X did. Millennials and Gen Z will only move to the right if political parties of the centre-right give them a reason to do so. If the Coalition parties are not perceived to be offering solutions to the social and economic problems that matter to Millennials and Gen Z, there is no incentive for these generations to vote for them. Future reports in this series will shed light on generational differences in attitudes across policy areas, but the currently available evidence would suggest housing affordability and climate change are policy issues of particular import to younger voters[36].
In the absence of thoughtful policy alternatives, and an ability to make their case to younger voters, parties of the left have shown no hesitation in filling this vacuum with government intervention that is at best ineffective — and at worst contrary to the interests of the younger voters they purport to help. For evidence of this, one need look no further than the Greens current ‘solutions’ to Australia’s housing affordability problems.
Appendix I: Simulation methodology
Overview
For each electoral division, the simulated primary vote for party p at election t is given by:
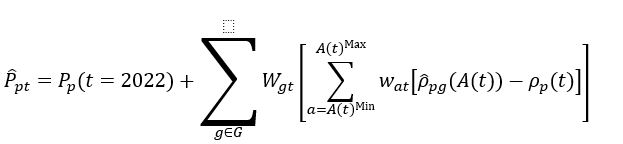
where Ppt is the observed primary vote of party p at election t and Wgt the predicted percentage of the electorate made up of generation g at election t. ![]() is an estimate of the primary vote of generation g for party p at whatever age in years (A) they were observed at election t. Ppt(t) is the overall primary vote for the party at election t and Wat the contribution of those aged A to generation g at election t. In the instance where p = Coalition,
is an estimate of the primary vote of generation g for party p at whatever age in years (A) they were observed at election t. Ppt(t) is the overall primary vote for the party at election t and Wat the contribution of those aged A to generation g at election t. In the instance where p = Coalition, ![]() would be an estimate of the election adjusted primary vote for the Coalition for generation g at age A as depicted in Figure 4.
would be an estimate of the election adjusted primary vote for the Coalition for generation g at age A as depicted in Figure 4.
The superset is the collection of the sets of generations which include: S = Silent Generation, B = Boomers, X = Generation X, M = Millennials and Z = Generation Z. These generations are defined by the birth years listed in Table 1. F refers to those generations born after 2009, Figure 3 implies until such time that t = 2028.
and are formed from the 2021 Census of Population and Housing and the ABS Population Projections. The former are essentially electorate level estimates analogous to the national estimates in Figure 3[37]. is the primary vote of party p at the 2022 election as reported by the AEC.
The Two Candidate Preferred (TCP) for each electorate is simulated by taking the estimate of the final term in the equation for the Coalition (p = Coalition), and adding this to the primary vote of the non-Coalition candidate that polled second in 2022. The preference flows observed at the 2022 election are then added to the simulated primary votes of the top-two candidates to form a simulated TCP.[38] The number of seats won by party p, at election t, is then the count of electoral divisions where party p has a TCP greater than 50 per cent.
Limitations arising from preference data
As with any model of a social system, the modelling is based on several assumptions; some of which are necessitated by data limitations. One limitation of the method is that it assumes the parties that finished in the top two at the 2022 election continue to do so for every simulated election — albeit with a primary vote determined by the changing age distribution of the electorate. It effectively rules out the possibility of a minor party (or independent) who distributed preferences in 2022 benefiting from the decline in the Coalition primary vote. These candidates are assumed to continue to distribute preferences as they did in 2022 and cannot move into the top two or win a seat at subsequent (simulated) elections.
While this assumption is less than satisfactory, it is an unavoidable consequence of only having data on preference flows for the top-two candidates in each electorate rather than a full accounting of all pair-wise preference flows between candidates. This is best illustrated by way of an example. Take an electorate where the top-two candidates at the 2022 election were from the ALP and the Liberal Party. In principle, the simulated reduction in the Liberal candidate’s primary vote could be allocated to an independent who did not finish in the top two, rather than the ALP candidate. Despite missing out on the top two, an independent with a reasonably large primary vote at the 2022 election, who may benefit from the reduction in the Coalition primary vote at future elections, may move ahead of one — or both —the ALP and Liberal candidates in TCP terms after the distribution of preferences. The problem here is that there is no AEC data on whom this candidate would have received preferences from in 2022, and hence no way of performing this calculation. The only alternative would be to make assumptions as to how the preference might flow in future elections, which would require speculation rather than an assumption informed by data.
This is of no concern in seats that are likely to remain — what psephologists term ‘classic contests’ — between the Coalition and the ALP in future elections. Nor is it a concern in seats where the Coalition candidate is likely to continue to poll in the top-two against a minor party or independent. However, it does rule out the possibility of minor parties and independents who did not make it to the top two in 2022 doing so in future elections. As observed in Table 2, the simulation method was able to show Coalition seats falling to independents — but only those who made a good showing in 2022 (see column five).
This want of comprehensive data on preference flows is also the reason Table 2 suggests very little change in the APV of the Greens over time. Without knowing how preferences flow to Greens candidates not currently polling in the top-two, it is hard to say which seats might one day move from being classic contests to ALP-Greens contests. Of course, this is more of a problem for predicting the relative number of seats held by the ALP and the Greens than it is for simulating the absolute decline in seats held by the Coalition. It seems more likely that future increases in the Greens APV would arise from a reduction in the ALP primary vote, and that the number of ALP-Greens contests will increase in the years to come. Of the 151 House of Representatives seats, classic contests accounted for 82 per cent of electoral contests at the 2022 election (124 seats, 115 Liberal and 9 National). Outside these classic contests, the Coalition was more likely to place first or second in seats where their main competition was an independent rather than a Green; with 16 seats characterised as Coalition-Independent contests and just three Liberal-Greens contests. In non-classic seats where the ALP placed first or second, ALP-Greens contests were more common than ALP-Independent contests accounting for 6 and 2 seats respectively.
Another limitation arising from the preference data is that for the eight seats in which the Coalition did not place first or second in the 2022 election, the simulation method assumes the primary vote of all candidates remains unchanged. In these seats, the reduction in the Coalition primary vote serves to change the preferences flows only from the Coalition candidate to the top two, and does not result in a reduction in primary vote of the top two. If the reduction in Coalition primary vote is allocated to one of the top two, but not subtracted from the other — since there is no top-two Coalition candidate — the total primary vote in these electorates would sum to a number greater than 100 as would the simulated TCP. Were comprehensive data on preference flows available, the reduction in the Coalition primary vote could in principle be allocated to any candidate and their preference flows added on to simulate a TCP. It is regrettable that this data limitation rules out a simulation of how generational change might move more Greens candidates into the top two where they are most likely to face an ALP incumbent. A further implication of this is that the cumulative sum of the reduction in the Coalition APV over the course of subsequent elections is not equal to the estimated age effect for each election (see also endnote 30).
Other limitations
There are additional limitations of the methodology aside from those that arise from the lack of comprehensive preference flow data. Firstly, the modelling assumes that the relationship between age and the election adjusted vote for the Coalition across generations is the same in every electorate. In reality, these will differ across electorates, and may be quite different in regional electorates compared to those in urban areas.
The use of Census data to obtain the age distributions for each electorate does not consider differences in eligibility to vote, voter registration or voter turnout across electorates. The use of the ABS population projections to simulate the future age distribution of the electorates will be impacted by ABS predictions of future foreign immigration into Australia. Not all migrants who ultimately become citizens will be eligible to vote in the early years of their residency; however this is only a problem for the simulations insofar as the age distribution of migrants differs to that of citizens. The method also assumes there are no electoral redistributions — which is not entirely realistic over an 18-year period.
Appendix II: A primer on electoral statistics
This appendix clarifies the distinction between the estimates produced by the simulation methodology and some of the more commonly reported electoral statistics reported by the AEC and in political polls.
Two Party Preferred versus Two Candidate Preferred
The ultimate objective of the simulation method is to obtain a hypothetical count of which of the 151 seats in the House of Representatives might be won by the Coalition, the ALP, the Greens and other candidates as the generational demography of the Australian electorate changes through the years. With this in mind, it is not the National Two Party Preferred (TPP) that is of interest, but rather the Two Candidate Preferred (TCP) for each electorate.
At the electorate level, the TCP differs from the more often reported TPP in that it measures the percentage of votes a candidate receives, taking account of those voters who cast their first preferences in favour of the candidate in addition to votes they received from lower polling candidates via preference flows. The TCP is expressed as a percentage of the total votes cast in the electorate. The TCP can be calculated for the two highest polling candidates in each electorate regardless of which party they represent and can also be calculated for independent candidates not affiliated with any party. The seat is ultimately won by the top-two candidate who obtains greater than 50 per cent of the TCP. In this sense, the TCP is a measure of the relative support for the top-polling candidates taking into account first preferences and preference flows.
Provided an electorate was contested by a candidate from the ALP, and from one or other of the coalition parties, a TPP can be calculated for the electorate. In electorates where the top-two polling candidates represent the Coalition and the ALP, the TCP and the TPP coincide. In electorates where the top two polling candidates are from one of the major parties and either an independent or of a minor party, the TPP is calculated by distributing the preferences of the independent or minor party candidate to the major parties. In this sense, the TPP is an index of relative support for the major parties. It does not play a role in determining which candidate wins the seat despite the TCP and TPP coinciding in classic contests.
The simulation results in Table 2 focus on the TCP in preference to an electorate level TPP measure, to include the 27 seats that were not classic contests at the 2022 election — which made up 18 per cent of total seats. Of the 143 electoral contests of the 2022 federal election where the Coalition placed first or second, 124 were with the ALP, three were with the Greens and 16 with independents (as defined below). The remaining eight contests where a Coalition candidate contested, but did not place second, included six ALP-Greens contests and two ALP-independent contests.
National versus Average Primary Vote
Table 2 reports the Average Primary Vote (APV). The APV takes the average of the primary votes for each party observed (or simulated) across all 151 electorates. The APV is different to the National Primary Vote (NPV) which counts all of the first preference votes received by a party across the nation and divides by the total number of votes cast nationally. For parties that contest all 151 seats, the APV deviates from the NPV as a result of modest variation in the total number of votes cast across electorates on account of difference in population and voter turnout. Although the interpretation of the APV is different to the more familiar NPV reported by the AEC,[39] they tend to track one another quite closely — at least for the major parties and the Greens.
The reason the NPV and the APV are closely correlated for the major parties and the Greens is that these parties tend to contest every electorate thereby receiving a primary vote greater than zero in all electorates. The APV for the Greens at the 2022 election was far lower than that observed for the major parties as they only won four seats and placed second in just five. In contrast to the major parties, the vast majority of Greens candidates only serve to distribute preferences.
Minor parties and Independents
The final column of Table 2 reports the NPV received by candidates who were neither affiliated with the Liberal Party, the National Party, the ALP nor the Greens. These ‘other’ candidates received just under one-in-five first preferences at the 2022 election (19.5 per cent). This ‘other’ category includes independent candidates and all the minor parties with the exception of the Greens. Since the overwhelming majority of candidates from minor parties, and independents, failed to gain a seat in the House of Representatives at the 2022 election — or even place second in the seats they contested – their primary vote’s impact on the seats they contest lays solely in the preferences they distribute. As in an actual election, the role that these candidates play in the TCP simulations is to direct preferences to the top-two polling candidates in each electorate.
However, not all independents and minor parties exist merely to distribute preferences. Katter’s Australian Party’s Bob Katter held the seat of Kennedy at the 2022 election as did the Centre Alliance’s Rebekha Sharkie her seat of Mayo. The same is true of the eight ‘Teal’ independents[40] all of whom won – or in Zali Steggall’s case, held — their seats. There were also an additional two independent candidates not affiliated with the Teal political brand, Andrew Wilkie (Clark) and Helen Haines (Indi), both of whom held their seats. A further six independents failed to win the seats they contested but managed to place second[41].
The electoral success of these candidates sets them apart from others who merely distribute preferences. They either hold their seats or could potentially win their seat were their primary vote or preference flows to increase at subsequent elections and so it makes sense to accommodate them in the simulated elections. Despite the fact these ‘independents’ do not share a party room; the simulation methodology essentially treats these candidates — as well as Bob Katter and Rebekha Sharkie — as a political party that receives preferences from other candidates in determining who will win their seat. In summarising the results of the simulations, these candidates are grouped together in column 5 of Table 2 under the heading ‘Independents’ for whom an APV and a TPC is presented.
The advantage of taking the afore mentioned independents out of a broader ‘other’ category who are neither Coalition, ALP or Greens is that it allows the hypothetical reduction in the Coalition primary vote to move to candidates other than those of the ALP or the Greens. The rise of the ‘Teal’ independents at the 2022 election would suggest that the ALP and the Greens are unlikely to be the sole beneficiaries of a reduction in the Coalition primary vote.
There are two important implications of this approach for the simulated Independent APVs reported in Table 2 and in Figure 6. The first is that the APV of the independents is very high relative to the number of seats won when compared to the Coalition and the ALP. To take the 2022 result as an example, the ALP obtained an APV only slightly higher than the Independents but won more than six times as many seats. The reason for this is that the APV only averages over those seats the party contests. The Coalition and the ALP contested every seat at the 2022 election and placed in the top-two in 143 and 132 seats respectively. The independents only contested 18 seats; but since this grouping is essentially defined on the basis of their electoral success, they have very high primary votes in these seats. Consequently, they have a high APV but cannot by definition win more than 18 seats in any simulation.
The second implication of the independent grouping is that the sum of the APVs across the columns of Table 2 does not equal 100. Were one to sum the first preferences received by the independent candidates and divide this by the total number of votes nationally, forming a measure more analogous to the NPV, this would be far lower than the independent 2022 APV observed in Table 2 on account of them only receiving a primary vote in 18 electorates and a primary vote of zero elsewhere. If one were to then add the first preferences received by the remaining independent and minor party candidates to form a residual NPV the sum of these NPVs across the Coalition, ALP, Greens, independents and the residual candidates would sum to 100.
Appendix III: Data references and acknowledgements
The author acknowledges that those who carried out the original analysis and collection of the data, listed below, bear no responsibility for the further analysis or interpretation of them.
McAllister, I., Sheppard, J., (2022). Australian Election Study (2022) [computer file], December 2022.
McAllister, I., Sheppard, J., Bean, C., Gibson, R., Makkai, T. (2019). Australian Election Study 2019 [computer file], December 2019.
McAllister, I., Makkai, T., Bean, C., Gibson, R., (2017). Australian Election Study 2016 [computer file], February 2017.
McAllister, I., Pietsch, J., Bean, C., Gibson, R. (2014). Australian Election Study 2013 [computer file], January 2014.
McAllister, I., Bean, C., Gibson, R., Pietsch, J., (2011). Australian Election Study 2010 [computer file], May 2011.
Bean, C., McAllister, I., Gow, D. (2008). Australian Election Study 2007 [computer file], May 2008.
Bean, C., McAllister, I., Gibson, R., Gow, D. (2005). Australian Election Study 2004 [computer file], March 2005.
Bean, C., Gow, D., McAllister, I. (2002). Australian Election Study 2001 [computer file], April 2002.
Bean, C., Gow, D., McAllister, I. (1999). Australian Election Study 1998 [computer file], January 1999.
Jones, R., Gow, D., McAllister, I. (1996). Australian Election Study 1996 [computer file], June 1996.
Jones, R., McAllister, I., Denemark, D., Gow, D. (1993). Australian Election Study 1993 [computer file], August 1993.
McAllister, I., Jones, R., Gow, D. (1990). Australian Election Study 1990 [computer file], November 1990.
McAllister, I., Mughan, A. (1987). Australian Election Study 1987 [computer file], November 1987. Other data sources: Australian Electoral Commission. (2019). Federal Elections [website], accessed November 2019. URL: https://www.aec.gov.au/Elections/Federal_Elections/
Aitkin, D. (2007). Australian National Political Attitudes Survey, 1979 [computer file], May 2007.
Aitkin, D., Kahan, M., Stokes, D. (2005). Australian National Political Attitudes Survey, 1969 [computer file], September 2005.
Aitkin, D., Kahan, M., Stokes, D. (2005). Australian National Political Attitudes Survey, 1967 [computer file], September 2005.
References
Burn-Murdoch, J., 2022. Millennials are shattering the oldest rule in politics. [Online]
Available at: https://www.ft.com/content/c361e372-769e-45cd-a063-f5c0a7767cf4
ABS, 2018. Population Projections Australia 2017-2066, Catalogue No. 3222.0, Canberra: Australian Bureau of Statistics.
Australian Electoral Commission, 2019. Profile of the electoral division of Gilmore. [Online]
Available at: https://www.aec.gov.au/profiles/nsw/gilmore.htm
[Accessed 15 May 2023].
Australian Electoral Commission, 2022a. House of Representatives Two party preferred results 1949 – present. [Online]
Available at: https://www.aec.gov.au/elections/federal_elections/tpp-results.htm
[Accessed 27 March 2023].
Australian Electoral Commission, 2022b. Profile of the electoral division of Deakin. [Online]
Available at: https://www.aec.gov.au/profiles/vic/deakin.htm
[Accessed 15 May 2023].
Australian Electoral Commission, 2022b. TALLYROOM. [Online]
Available at: https://results.aec.gov.au/27966/Website/HouseDownloadsMenu-27966-Csv.htm
[Accessed 21 March 2023].
Barber, S., 2017. Federal election results 1901–2016, Canberra: Parliamentary Library.
Benson, S., 2023. Liberals suffer broken heartland as Labor marches in: Newspoll. [Online]
Available at: https://www.theaustralian.com.au/nation/politics/liberals-suffer-broken-heartland-as-labor-marches-in-newspoll/news-story/99fbdd1fd7bb6af1ad79f37436daf23c
[Accessed 1 June 2023].
Blagden, J. & Payne, S., 2023. Missing Millennials: Why the Conservatives lost a generation, and how to win them back, London: UK Onward Thinktank.
Cameron, S. & McAllister, I., 2019. The 2019 Australian Federal Election: Results from the Australian Electoral Survey, Canberra: School of Politics and International Relations, Australian National University.
Cameron, S., McAllister, I., Jackman, S. & Sheppard, J., 2022. The 2022 Australian Federal Election: Results from the Australian Election Study, Canberra: ANU School of Politics and International Relations.
Cleveland, W., 1979. Robust Locally Weighted Regression and Smoothing Scatterplots. Journal of the American Statistical Association, Volume 74, pp. 829-836.
Coohill, J., 2019. Quote Or No Quote: “Liberal When You’re 25, Conservative When You’re 35”, s.l.: s.n.
Coorey, P., 2009. The Rudd supremacy. The Sydney Morning Herald, 30 March.
Galloway, A. & Malo, J., 2023. More than 70% of young people believe they’ll never be able to buy a home. [Online]
Available at: https://www.smh.com.au/politics/federal/more-than-70-percent-of-young-people-believe-they-ll-never-be-able-to-buy-a-home-20230223-p5cn01.html
[Accessed 2 June 2023].
Gethin, A., Martínez-Toledano, C. & Piketty, T., 2022. Brahmin left versus merchant right: changing political cleavages in 21 Western democracies, 1948-2020. Quarterly Journal of Economics, 137(1), p. 1–48.
Geys, B., Heggedal, T. & Sorensen, R., 2022. Age and vote choice: Is there a conservative shift among older voters?. Electoral Studies, Volume 78, pp. 1-8.
Goerres, A., 2008. The grey vote: determinants of older voters’ party choice in Britain and West Germany. Electoral Studies, 27(2), p. 285–304.
Green, A., 2022. ABC Federal Election 2022 Results: Party Totals. [Online]
Available at: https://www.abc.net.au/news/elections/federal/2022/results/party-totals
[Accessed 27 March 2023].
Green, A., 2022b. Gilmore Key Seat – Federal Election 2022. [Online]
Available at: https://www.abc.net.au/news/elections/federal/2022/guide/gilm
[Accessed 15 May 2023].
Henderson, G., 2020. Kalgoorlie 1920 is no guide to Eden-Monaro today. [Online]
Available at: https://thesydneyinstitute.com.au/blog/kalgoorlie-1920-is-no-guide-to-eden-monaro-today
[Accessed 12 April 2023].
Howard, J., 2005. Address at the Launch of the Publication ‘The Conservative’ Parliament House, Canberra. [Online]
Available at: https://pmtranscripts.pmc.gov.au/release/transcript-21912
[Accessed 2023 May 11].
Kahan, M. & Aitkin, D., 1968. Drawing a Sample of the Australian Electorate, Canberra: Research School of Social Sciences.
Lethborg, A., 2017. Australian Election Study Technical Report, Melbourne: The Social Research Centre.
Lethborg, A., Phillips, B. & Tan, S., 2022. Australian Election Study 2022 Technical Report, Melbourne: The Social Research Centre.
Morrison, K., 2022. Housing Affordability campaign launch, Sydney: Property Council of Australia.
Myers, P. & Vickers, N., 2014. Australian Election Study Technical Report, Melbourne: The Social Research Centre.
Newspoll, 2023. Two Party Preferred Archive. [Online]
Available at: https://www.theaustralian.com.au/nation/newspoll
[Accessed 1 June 2023].
Tilley, J., 2005. Research note: libertarian-authoritarian value change in Britain 1974- 2001. Political Studies, Volume 53, p. 442–453.
Tilley, J. & Evans, G., 2014. Ageing and generational effects on vote choice: combining cross-sectional and panel data to estimate APC effects. Electoral Studies, 33(1), p. 19–27.
Tranter, B., Skrbiš, Z. & Smith, J., 2020. Poles Apart: Political Divisions over Climate Change. Journal of Applied Youth Studies, 3(3), p. 255–273.
Williams, P., 2008. The 2007 Australian Federal Election: The Story of Labor’s Return from the Electoral Wilderness. Australian Journal of Politics and History, 54(1), pp. 104-125.
Wood, R., 2023. Most young Aussies giving up on home ownership, survey finds. [Online]
Available at: https://www.9news.com.au/national/housing-crisis-update-two-thirds-of-young-people-give-up-on-home-ownership/8b217180-75d2-4106-b49a-c25dac7c0678
[Accessed 2 June 2023].
York, B., 2016. Museum of Australian Democracy. [Online]
Available at: https://www.moadoph.gov.au/blog/lowering-the-voting-age-43-years-on
[Accessed 21 March 2023].
Endnotes
[1] According to historian Joseph Coohill, there is a stronger case for attribution to the French academic and lawyer Anselme Polycarpe Batbie who is supposed to have said “He who is not a republican at twenty compels one to doubt the generosity of his heart; but he who, after thirty, persists, compels one to doubt the soundness of his mind.” referring to the French republicanism of the late 18th and first half of the 19th century not the conservative republicanism of the present day US (Coohill, 2019).
[2] See Tilley (2005), Goerres (2008), Tilley & Evans (2014), Gethin, Martínez-Toledano & Piketty (2022) and Geys, Heggedal & Sorensen (2022).
[3] Cameron et al (2022) partition Millennials and Gen Z at 1996.
[4] See p. 23 of Cameron, McAllister, Jackman & Sheppard (2022).
[5] See Burn-Mudoch (2022). This author also partitions Millennials and Gen Z at 1996.
[6] See Blagden & Payne (2023). These authors define Millennials as those born between 1983 and 1998. Their intention to vote estimates exclude those who responded ‘Don’t know’.
[7] Howard (2005).
[8] Henderson (2020).
[9] Williams (2008).
[10] Coorey (2009).
[11] Newspoll (2023).
[12] Cameron, et al. (2022).
[13] The 1967 survey pertains to the 1966 election which was held quite late in the year on the 26th of November. In contrast to the AES surveys, the fieldwork for this initial ANPAS was conducted from September to November 1967 approximately 12 months after the election respondents were reporting on.
[14] In contrast to the AES, and the other ANPAS collections, the 1979 survey was not conducted in the months after a federal election. In addition to being asked who they had voted for at the most recent 1977 federal election, the 1979 respondents were also asked: If a federal election were held tomorrow for the House of Representatives, which party would you vote for? which is used in the construction of Figure 4. This does not necessarily provide an accurate indication of who respondents would ultimately have voted for at the 1980 election held on the 18th of October 1980. As the objective of this report is to quantify the association between age and voting behaviour, and the extent to which this may vary across generations, it matters little whether the 1979 data reflects respondents’ actual 1980 vote or for whom they intended to vote at some point in 1979. The AES data will however be interpreted in this report as a measure of for whom the respondent voted for at the most recent election subject to the caveat that this is not strictly true of the 1979 data.
[15] There have been various methodological changes to the surveys over the years. The appendix in Cameron & McAllister (2019) provides an overview of the survey methodology for 1987 to 2019. Greater detail on the methodology used in the 2013, 2016 and 2022 surveys can be found in the technical reports prepared by the Social Research Centre (Myers & Vickers, 2014; Lethborg, 2017; Lethborg, et al., 2022). The survey methodology for the older ANPAS surveys is described in Kahan & Aitkin (1968).
[16] The 2001 AES included an ancillary study that utilised online data collection for a subset of the survey questions in order to assess ‘…the use of the web as a methodological tool for survey research in national election studies’ (Gibson, et al., 2017, p. 4).
[17] See Cameron & McAllister (2019) and Lethborg, et al. (2022).
[18] The oldest of Gen X would have been of voting age when the 1984 election was held, unfortunately there was no AES conducted immediately following the 1984 federal election.
[19] Support for the Coalition remained very high among the Greatest Generation (born before 1928) with three-in-four voting for the Coalition. However, these levels of support would provide little comfort for the Coalition as this generation made up less than 1 per cent per cent of the 2022 electorate (ABS, 2018). In light of the relatively small percentage of voters from the Greatest Generation, and the decline in the percentage of the electorate made up of the Silent Generation over the coming years, the focus of this report is on the post-war generations born after 1945.
[20] Although the Australian Greens were founded in 1992, not all local green organisations affiliated with the new federal party. The Greens primary vote for the 1996 federal election includes the Australian Greens, Greens Western Australia, Victorian Greens, Tasmanian Greens, Central Coast Green Party, and Richmond/Clarence Greens.
[21] Barber (2017).
[22] The Newspoll data cited in this subsection is taken from Benson (2023).
[23] More specifically, the generational composition implied by Table B9: Population projections by age and sex – Series B in (ABS, 2018) using the generations defined in Table 1.
[24] These numbers will slightly underestimate the actual average age implied by the projections as age in the ABS publication is top-coded at 100. However, since the percentage of Australians over 18 years who are also aged 100 and over is well under 0.1 per cent it is highly unlikely this would greatly impact the calculation of the average.
[25] The AES includes data relevant to the 1966 and 1969 elections but not the 1972, 1974, 1975, 1977 or 1983 polls. This matters little for the estimation of the age effect for Gen X and has no bearing on the estimation of the age effect for subsequent generations. However, it does mean the data are somewhat incomplete for Boomers. More specifically, the voting behaviour of the oldest Boomers is incomplete between the ages of 26 and 31 just as their vote at the 1983 election, when they were aged 37, is not observed. For the youngest Boomers the data are only incomplete for the 1983 election when they were 19 years of age as the youngest Boomer birth cohorts were below the voting age prior to the 1983 election.
[26] Prior to the 1974 election the voting age in federal elections was 21 (York, 2016).
[27] The estimate referred to in this sentence, and in Figure 4 and Figure 5, is the election adjusted Coalition primary vote among Gen Z at 19 years of age rather than 18. The reason for this is the primary vote for the ALP among Gen Z 18 year olds was inordinately high in the AES data in 2016 and introduces a discontinuity in the election adjusted primary vote profiles in these figures. The report proceeds on the assumption that that the estimates for Gen Z 19 year olds is a more reliable estimate of their relative support for each of the major parties in their early elections.
[28] This is not to say that Boomers who voted for minor parties in their youth necessarily switched to the Coalition later in life. Figure 5 is consistent with some minor party voters switching to the ALP and some ALP voters switching to the Coalition. However, since the AES usually includes questions on who the respondent voted for at the previous federal election, it would be possible to approximate election-on-election transition probabilities between parties from 1987.
[29] Appendix II clarifies the distinction between the National Primary Vote and the Average Primary Vote.
[30] As the simulated primary vote is calculated by subtracting the electorate level age effects at each hypothetical election from the 2022 Coalition primary vote, one might expect the cumulative reduction in the simulated Coalition APV to equal the average age effect at the election. Clearly this is not the case as the average 2040 age effect reported earlier was -10.7 which is somewhat larger than the 9.1 percentage point reduction in the Coalition’s simulated APV between 2022 and 2040. The reason the simulated reduction in the Coalition APV is smaller, in absolute terms, than the age effect is that the latter is not applied to those electorates where a Coalition candidate failed to finish in the top-two at the 2022 election for reasons explained in Appendix I. The age effect and the (cumulative) simulated reduction in the Coalition APV are however equal among those electorates where a Coalition candidate finished in the top-two at the 2022 election.
[31] Appendix II clarifies the distinction between the Two Party Preferred and the Two Candidate Preferred.
[32] The reason the level, and increase, in the Independent’s ATCP is low despite a significant gain in seats is that Independents are assumed to continue to contest no more than 18 seats of which they currently hold 12. The Independent ATCP is therefore zero in most electorates and low when averaged over 151 electorates. However, it is high enough in the electorates independents contest for them to hold 12 seats in 2022 and for them to potentially gain an additional three seats as the Coalition primary vote cedes.
[33] This is the approximate level of support that would be observed for Gen Z at this election were they to increase their support by 3.9 percentage points per election from 2022. This ensures simulation V is consistent with the earlier simulations in assuming the generation that follows Gen Z takes on their voting behaviour.
[34] The Coalition’s victory over the Rudd government in 2013 saw the Coalition pick up 17 seats. The Coalition’s victory over the Keating government in 1996 saw the Coalition’s seat count increased by 29 seats.
[35] The inception of the Whitlam government in 1972 was the result of the ALP increasing their seat count from 59 seats to 67 seats. Similarly, the start of the Hawke government was the result of an increase in lower house seats held by the ALP from 51 to 75. However, both these victories were in the context of a House of Representatives with 125 seats rather than the 147 to 151 seats furnished from 1993.
[36] See Tranter, et al. (2020), Morrison (2022), Galloway & Malo (2023) and Wood (2023).
[37] The age distributions from the 2021 Census were obtained from the ABS Table Builder product found at <https://tablebuilder.abs.gov.au/webapi/jsf/login.xhtml>. The population projections are constructed using Tables B1-B8 in ABS (2018).
[38] More specifically, this involves data from the Distribution of Preferences by Candidate by Division workbook found at the AEC’s Tally Room website (Australian Electoral Commission, 2022b).
[39] Political polls use representative samples of the national electorate to form estimates of each political party’s primary vote. Political pollsters then use assumptions about aggregate preference flows to estimate a National TPP for the major parties.
[40] These include Zali Steggall (Warringah), Sophie Scamps (Mackellar), Allegra Spender (Wentworth), Kylea Tink (North Sydney), Kate Chaney (Curtin), Zoe Daniel (Goldstein), Monique Ryan (Kooyong) and Dai Le (Fowler).
[41] These include Nicolette Boele (Bradfield), Kate Hook (Calare), Caz Heise (Cowper), Suzie Holt (Groom), Alex Dyson (Wannon) and Rob Priestly (Nicholls)The independent candidate for Calare, Kate Hook, lost to then National Party candidate Andrew Gee who now sits as an independent (Karp, 2022). The modelling assumes the National Party hold this seat as of 2022.