
Executive Summary
Public debate about the ‘cost-of-living crisis’ often confuses nominal price increases with declining affordability. This paper argues that the proper measure of affordability is not the dollar price of goods and services, but the amount of work time required to obtain them.
Using long-run data from the United States and Australia, this paper applies time pricing — a method that divides price indices by wage indices — to assess changes in abundance. In the United States between 2000 and 2025, average hourly wages rose faster than the Consumer Price Index, implying that the time required to purchase the average consumption basket fell by 16.5%. In Australia, a similar pattern emerges: many goods have become substantially more abundant relative to wages.
However, the gains are uneven across sectors. Tradable, competitive, and technologically dynamic sectors — such as communications, clothing, electronics, and household goods — show large abundance increases. By contrast, housing, education, and healthcare have become less abundant relative to wages in both countries.
The divergence is not random. Sectors where abundance rises are typically exposed to competition, innovation, and global supply chains. Sectors where abundance falls are characterised by supply constraints, third-party payment systems, heavy subsidies, and government intervention in the form of regulatory barriers to entry and growth.
The implication is clear: the cost-of-living problem is not a general failure of markets but a sector-specific failure of policy design. If policymakers wish to improve affordability, reforms should focus on liberalising housing supply, increasing price transparency in healthcare, and reconsidering subsidy structures in higher education and childcare.
Abundance is the natural output of open, competitive markets. Scarcity persists where policy blocks adjustment.
Introduction
Concerns about affordability dominate political debate across advanced economies. Rising rents, tuition fees, and medical bills are cited as evidence that the economic system no longer delivers for ordinary people. In both the United States and Australia, younger generations in particular are said to be ‘locked out’ of prosperity.
But such claims often begin with a flawed premise. They focus on nominal price increases rather than on the relationship between prices and wages. Households do not consume dollars; they consume goods and services purchased with earnings. When wages rise faster than prices, purchasing power expands even if sticker prices increase.
This paper revisits the affordability debate using a clearer metric: time pricing. By measuring how many hours of work are required to buy specific goods and services, we obtain a more intuitive and more accurate picture of living standards. The results challenge the narrative of generalised economic decline while identifying genuine pressure points that deserve policy attention.
Across both the United States and Australia, the broad pattern is consistent. Abundance rises sharply in sectors where productivity compounds and competition disciplines prices. Abundance falls in sectors constrained by regulation, insulated from consumer choice, or shaped by subsidy-driven distortions.
The task, therefore, is not to condemn modern capitalism wholesale, but to identify and reform the institutional arrangements that impede its functioning in specific domains.
The problem of money illusion
Most cost-of-living debates start with a mistake that economists have warned about for more than a century: money illusion. People see a higher dollar price and infer that life has become less affordable, even when their paychecks have risen too. A family does not live on price tags; it lives on the amount of goods and services it can purchase per hour of work. If hourly wages rise faster than prices, the relevant burden falls even if the sticker price rises. If hourly wages lag, the burden rises even if inflation looks tame. The difference is not academic. It changes what voters demand, what politicians promise, and what reforms get tried.
What the CPI gets right — and what it misses
Let’s start with the so-called ‘Chart of the Century’ (Figure 1) popularised by the American economist Mark Perry. Perry’s chart compiles long-run price changes across major U.S. spending categories and compares them to overall inflation. In his latest version, from 2000 to 2025, the Consumer Price Index — a measure of U.S. inflation — rose 89.9% while average hourly earnings rose 127.4%. Those two numbers already tell you something important: for the typical worker, the cost of the ‘average basket’ grew more slowly than pay.’
Figure 1: Price changes January 2000 to June 2025
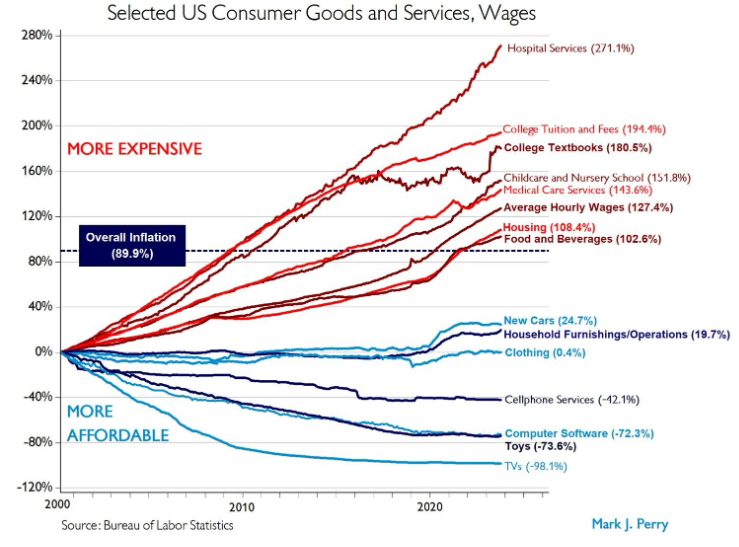
Perry’s chart then shows how uneven that experience has been across categories. Some essentials rose far faster than the CPI, including hospital services (271.1%), college tuition and fees (194.4%), childcare and nursery school (151.8%), and housing (108.4%). Other goods and services rose more slowly than inflation or even fell outright, including new cars (24.7%), household furnishings (19.7%), clothing (0.4%), cellphone Services (-42.1%), toys (-73.6%), software (-72.3%), and TVs (-98.1%). The distribution matters: people notice the bill they dread, not the item that quietly got cheaper.
Perry’s chart is powerful for another reason. It reminds readers that ‘inflation’ is not one thing. It is an average of many moving parts. When commentators talk as if the price level is a single force bearing down on families, they miss the real story: some sectors deliver more for less year after year, while other sectors absorb more and more of household budgets.
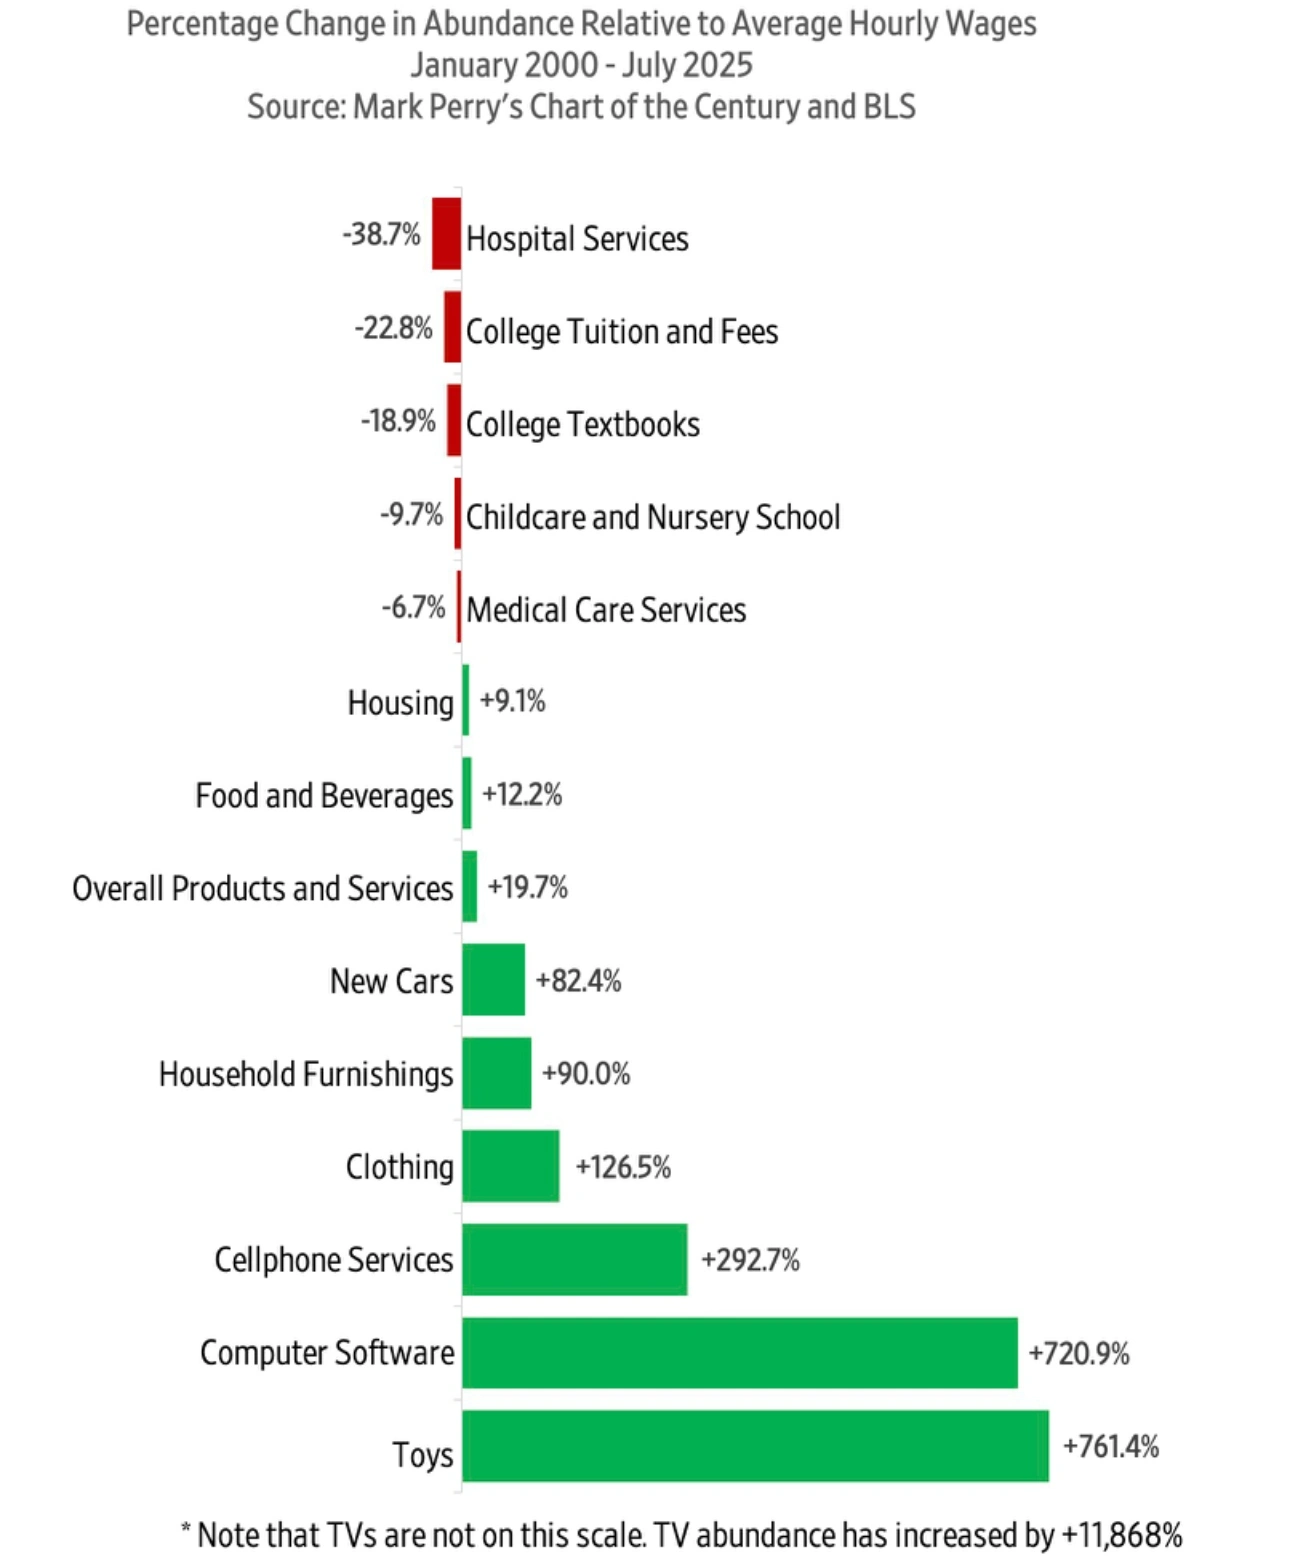
Still, Perry’s presentation can leave a reader with an incomplete sense of how living standards changed, because it keeps the comparison anchored to the CPI rather than to hourly wages. If you care about affordability, the central question is not “How did prices move relative to other prices?” but “How did prices move relative to what people earn?” That is the logic behind my colleague Gale Pooley’s adjustment of Perry’s chart (Figure 2) using time pricing.
Figure 2: Selected U.S. consumer goods and services
Time pricing: measuring affordability in hours, not dollars
Time pricing translates a price into the amount of work time required to buy it. The arithmetic is simple. Take an item’s price index and divide it by an earnings index. If the ratio rises, the item takes more work time. If the ratio falls, the item takes less work time. The payoff is clarity. Hours are harder to spin than dollars.
When Pooley applies our time pricing method to Perry’s headline numbers, the conclusion is straightforward. With CPI up 89.9% and wages up 127.4%, the time price of the overall CPI basket fell from 1.00 to 0.835. That implies a 16.5% decline in the work time needed to buy the basket, and therefore a 19.7% increase in ‘abundance’ — defined as the inverse of time price.
Pooley’s reframing changes the feel of the story. In CPI terms, the basket costs more. In time-price terms, the basket costs less because wages grew faster. The point is not that households never feel pressure; the point is that the right yardstick distinguishes between nominal anxiety and real constraints.
Time pricing also sharpens the contrast across categories. Pooley’s wage adjustment turns Perry’s deflationary categories into enormous abundance gains, because falling prices combine with rising wages. Between 2000 and 2025, Pooley reports abundance increases of 11,868.4% for televisions, 720.9% for software, 292.7% for cell phone service, 126.5% for clothing, 90% for furnishings, 82.4% for new cars, 12.2% for food and beverages and 9.1% for housing.
The same adjustment exposes the genuine problem sectors: hospital services show a 38.7% decline in abundance and college tuition shows a 22.8% decline. Childcare and nursery school abundance fell by 9.7% and medical services by 6.7%.
That is exactly the kind of distinction policy makers need when contemplating future reforms. If abundance is soaring in competitive, innovative, tradable sectors, it is hard to blame ‘capitalism’ for the whole cost-of-living problem. If abundance is shrinking in sectors with heavy subsidies, third-party payment, entry barriers, and local supply constraints, it is equally hard to claim that the situation is an unavoidable feature of modern life.
Applying the framework to Australia
The same framework travels well, which brings me to Australia. The country has its own version of the American argument. Australians hear the same complaints about “prices running away,” “young people locked out,” and “services becoming unaffordable.” The data show a similar split between goods that show rising abundance and services that show falling abundance.
Two Australian series matter for this exercise. The first is the Consumer Price Index (CPI), a basket measure of household prices compiled by the Australian Bureau of Statistics. The CPI measures price change for goods and services purchased by households and is built from a weighted basket across major groups such as food, housing, health, education, and communication.
The second is the Wage Price Index (WPI), which the ABS designed as a ‘pure price’ index for wages, holding job characteristics constant so that compositional shifts do not masquerade as wage growth. That design makes the WPI a useful wage yardstick when you want to talk about affordability rather than about workforce mix.
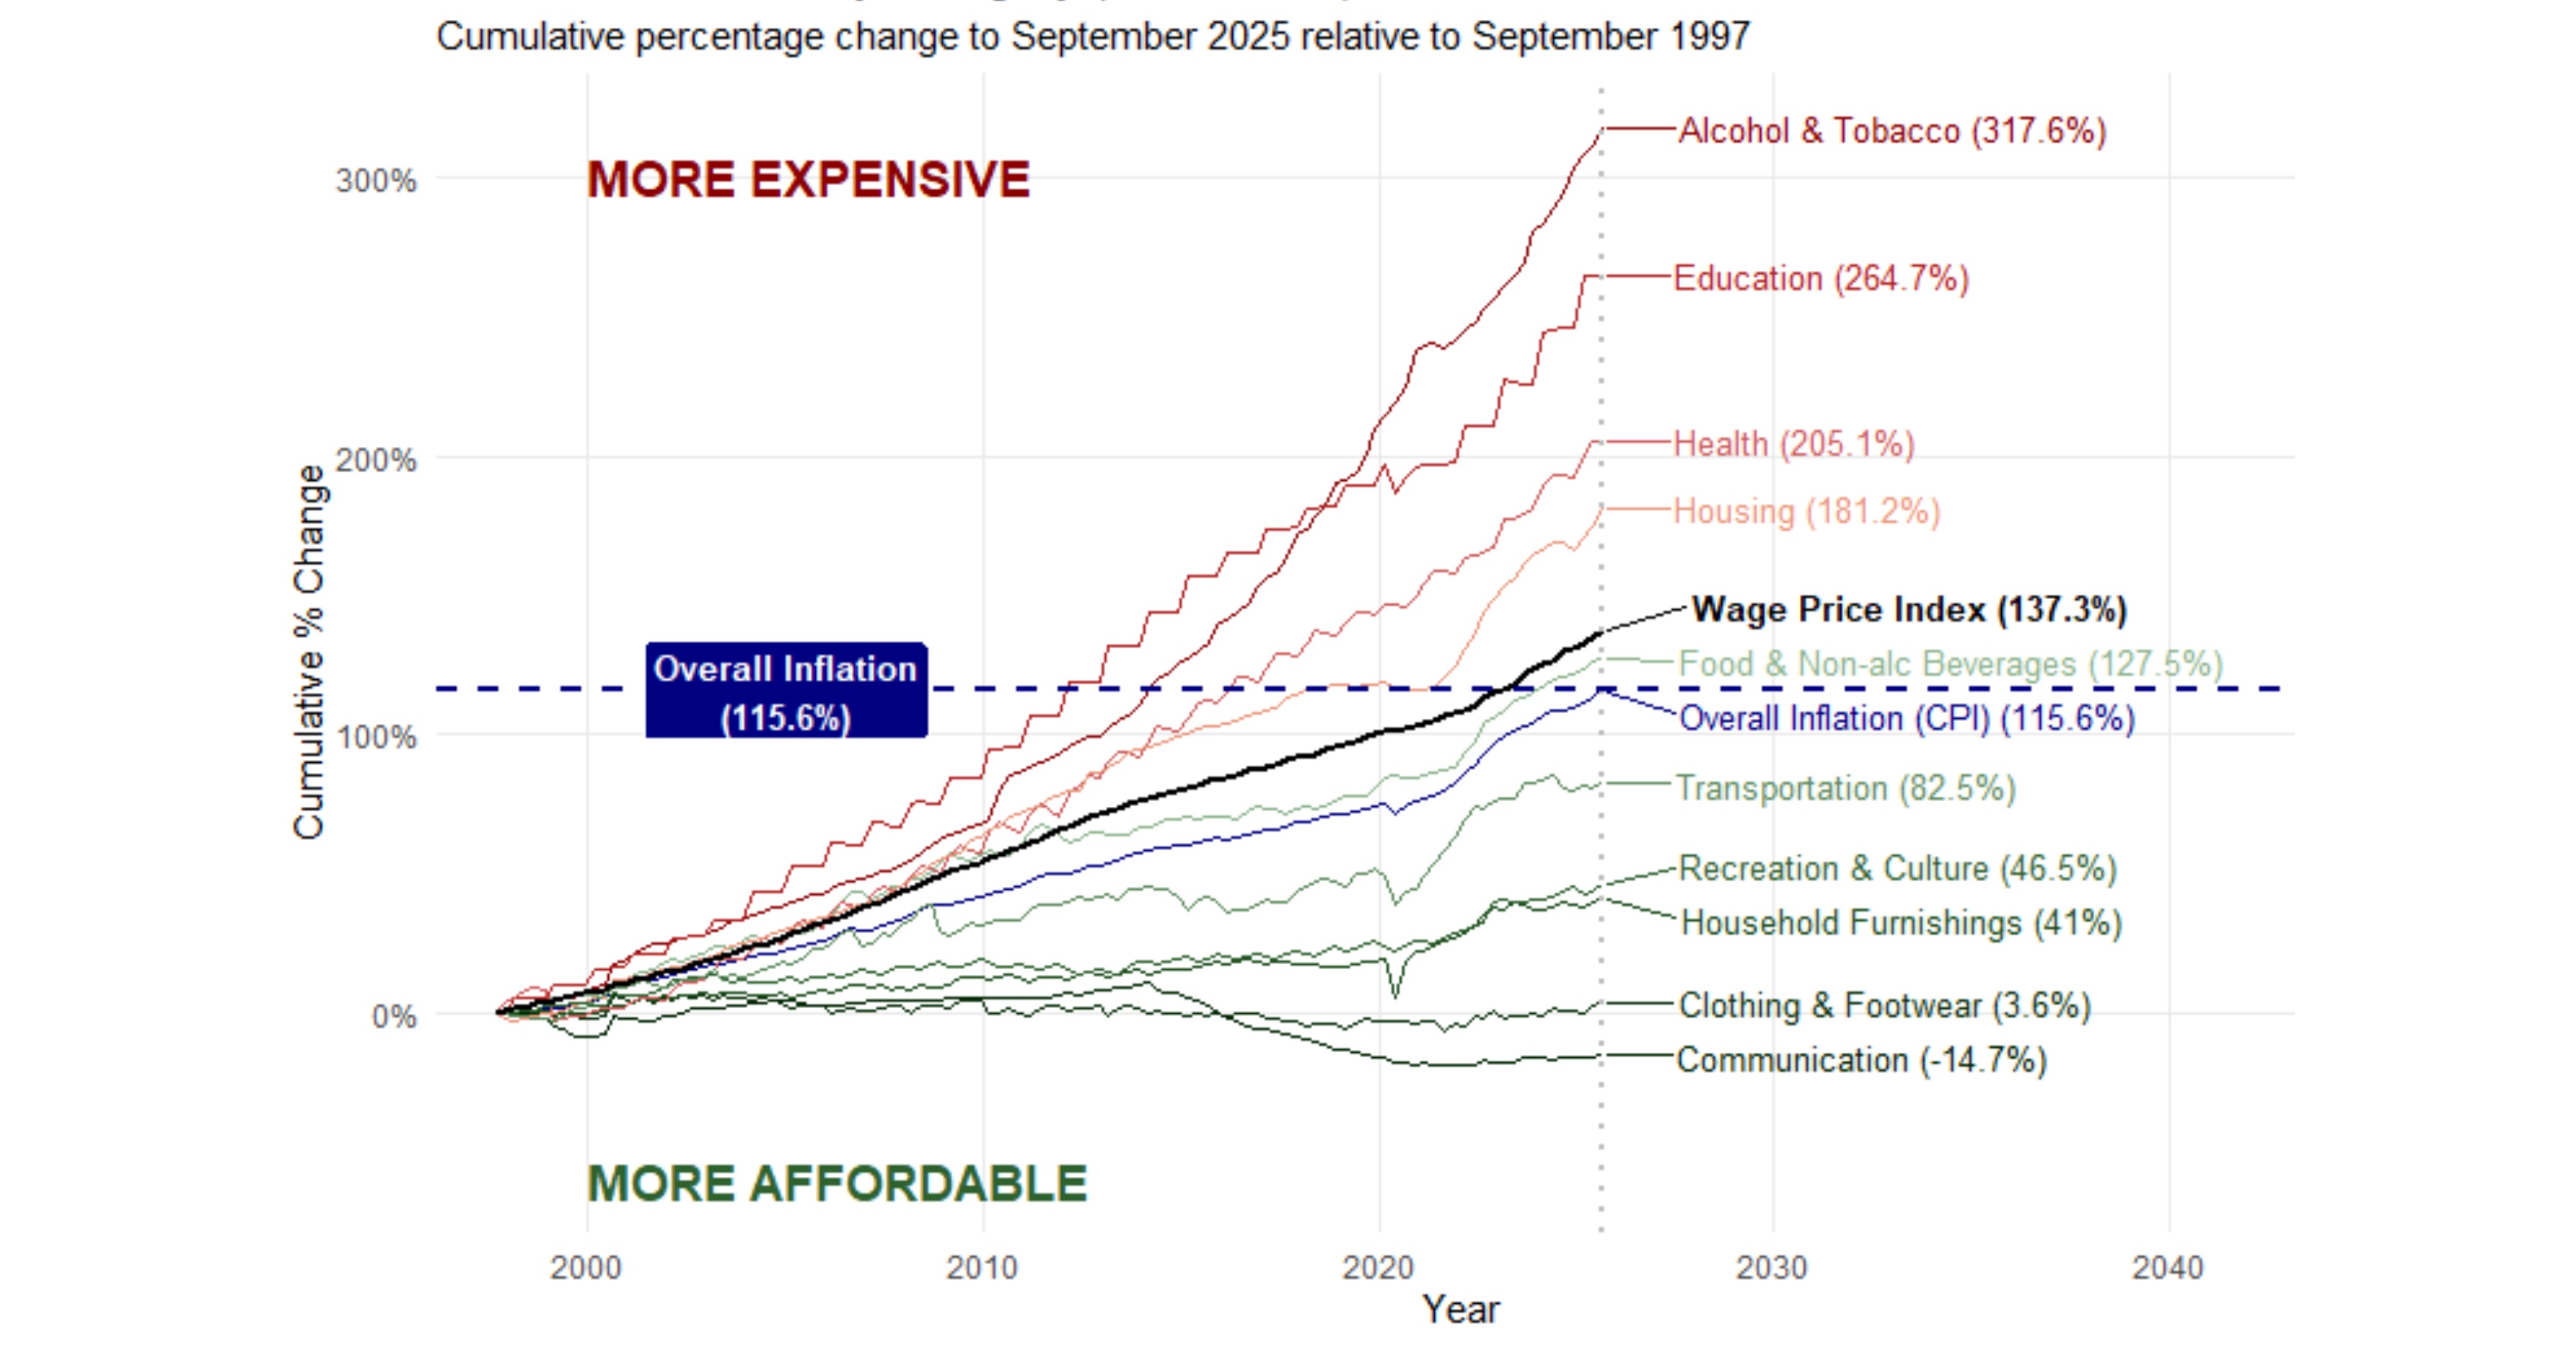
Between September 1997 and September 2025, the Australian CPI rose 115.6%, with education rising 264.7%, health 205.1%, housing 181.2% and food and non-alcoholic beverages 127.5%. Transportation, recreation and culture, household furnishings, and clothing and footwear rose 82.5%, 46.5%, 41% and 3.6% respectively. Communication fell 14.7%.
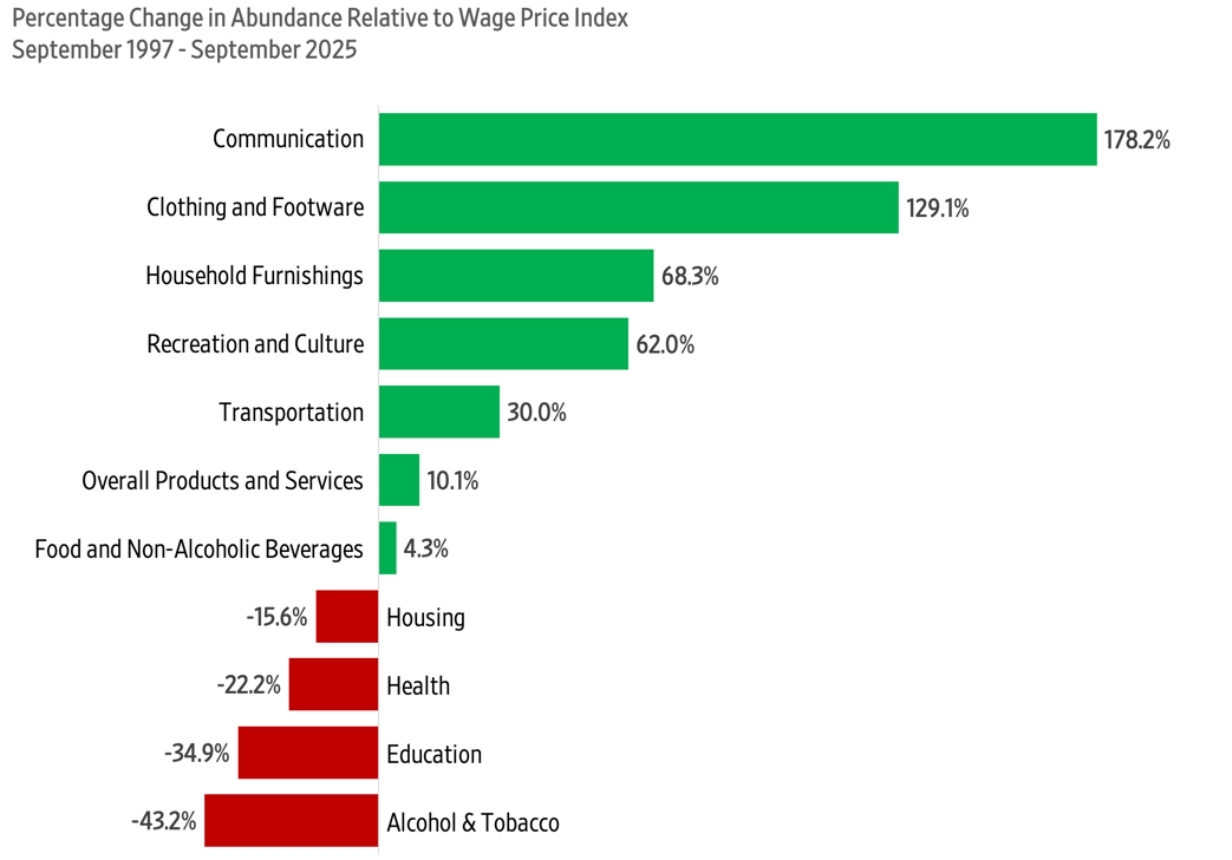
Figure 3: Australian inflation by category since 1997
Once you express these movements relative to wages, the picture becomes more optimistic. The abundance of communication rises 178.2%, clothing and footwear 129.1%, household furnishings 68.3%, recreation and culture 62%, transportation 30%, and food and non-alcoholic beverages 4.3%. Conversely, the abundance of housing falls 15.6, health 22.2% and education 34.9%.
Figure 4: Selected Australian consumer goods and services
If you have been following the American ‘affordability crisis’ debate, those results should feel familiar. Abundance tends to rise in sectors where productivity can compound and where competition is hard to suppress for long. The categories losing abundance tend to be sectors where supply is constrained, payment is insulated from the consumer, or rules protect incumbents. In both countries, the affordability problem is not a general failure of markets; it is a sectoral failure of policy design.
Abundance losers and winners
Where abundance expands: competition and productivity
Start with the abundance winners, because they teach the underlying mechanism. Communication is the standout in Australia. The best explanation for the growing abundance of communication is not mysterious. Telecommunications equipment follows the logic of modern technological change: rapid productivity growth, standardisation, fixed costs spread over global markets, and relentless innovation. When policy allows competition, the gains pass through.
Trade and global supply chains matter here, even for countries that do not see themselves as export platforms for electronics. A large economics literature shows that import competition can restrain prices. One careful study using U.S. price microdata estimates that rising trade with China reduced the U.S. CPI by 1.97% between 2000 and 2007. The Australian economy participates in the same global production networks, so the basic mechanism still applies. When firms can source inputs globally and when consumers can buy globally produced goods, the price discipline is real.
Clothing and household furnishings in Australia fit the same story. They are tradable, scalable, and exposed to competition from lower-cost production regions. They benefit from logistics, containerisation, retail technology, and the unglamorous efficiencies of inventory management. When you hear that clothing rose only 3.6% over nearly three decades, you are mostly looking at productivity and competition doing their job.
Where abundance contracts: policy-constrained sectors
The abundance losers teach the mirror-image lesson. Housing is the classic case because it is the largest budget line for many families and because it is the sector where local policy has the most leverage. In the U.S., the mainstream view among urban economists is that land constraints raise prices by restricting supply in high-demand areas. One influential line of work frames these constraints as a ‘regulatory tax’ embedded in housing prices. Another estimates that constraints in productive cities reduce national output by limiting migration to high-productivity places.
Australia’s housing debate features the same core mechanism. According to research by Keaton Jenner and Peter Tulip, planning restrictions create substantial markups in apartment markets. In Sydney, the price paid by buyers for a new apartment exceeds the estimated supply cost by around 68%. The corresponding figures are approximately 20% in Melbourne and 2% in Brisbane. Similarly, Ross Kendall and Tulip found that zoning rules significantly elevated detached house prices above the marginal cost of production, with markups of about 73% in Sydney, 69% in Melbourne, and 54% in Perth. These studies attribute the persistent price-cost gaps primarily to regulatory barriers that limit new development and housing supply.
Our time-price chart shows that Australia’s housing prices rose 181.2% since 1997. Once we account for wage growth, housing still ends up 15.6% less abundant relative to wages. That is the signature of a supply-constrained sector: demand rises with incomes, population, and credit conditions, while supply moves slowly because local rules treat new construction as a nuisance rather than as a response to scarcity. The bottom line: you do not need a conspiracy to get a shortage; you need a permitting system that turns each additional home into a political battle.
Education behaves similarly, though through a different channel. In the U.S., large third-party subsidies interacting with limited supply responses and institutional pricing power conspire to increase costs well above inflation and wage growth rates. According to Stephanie Cellini and Claudia Goldin, “the Title IV institutions charge tuition that is about 78% higher than that charged by comparable institutions whose students cannot apply for federal financial aid. The dollar value of the premium is about equal to the amount of grant aid and loan subsidy received by students in eligible institutions, lending some credence to a variant of the ‘Bennett hypothesis’ that aid-eligible for-profit institutions capture a large part of the federal student aid subsidy.”
Australia’s institutions differ, but the American logic carries over. According to the Australian researcher Andrew Norton, when students can borrow the full cost of tuition via HELP — with no upfront payment required for most and repayments deferred until they earn above a certain income level — they are less likely to shop around based on price or resist fee increases. Universities face weaker competitive pressure to keep fees low and raise fees to capture more revenue, knowing that HELP effectively subsidises or absorbs much of the cost for students in the short term. It is thus that education ends up being 34.9% less abundant relative to wages since 1997.
Healthcare has also grown less abundant. Why? When a third party, like an insurer, pays most of the bill, patients have less reason to shop, and providers have more room to raise prices. The evidence for this demand-side moral hazard is extensive. As Liran Einav and Amy Finkelstein found, “randomized experiments … [found that] individuals, on average, consume less healthcare when they are required to pay more for it out of pocket.” Barriers to entry compound the problem. The U.S. government repeatedly found that certificate-of-need laws, which require healthcare providers to obtain government approval demonstrating that a proposed new facility, service expansion, major equipment purchase, or similar development is necessary to meet community needs, tend to restrict entry and harm competition.
Australia’s health system is not America’s, but the incentives rhyme. When Medicare and private insurers cover most costs, patients are less likely to compare prices, and providers face less pressure to compete. At the same time, specialist markets can be concentrated, and private hospital contracts and billing practices can push up premiums and out-of-pocket gaps. The Grattan Institute traces how these dynamics encourage overservicing and embed inefficiency, and it outlines reforms to strengthen price discipline and cut low-value care. In the time-price chart, health is 22.2% less abundant relative to wages. That drift is what you would expect when prices are buffered from routine consumer choice.
Childcare does not appear as a separate Australian CPI group, but its cost ranks among the highest in the OECD countries. Let’s consider it briefly. In the U.S., the falling abundance of childcare can be ascribed to the so-called ‘input mandates’ or rules that require certain staffing ratios, credentialing, or facility standards, which raise costs per child and restrict supply. Likewise, Gigi Foster found in a paper for CIS found that childcare costs stem from government distortions. Demand-side subsidies like the Child Care Subsidy inflate demand without expanding supply, enabling providers to capture benefits via fee hikes and limiting net affordability gains for families. Strict National Quality Framework regulations — ratios, qualifications, red tape — raise costs, block new entrants, constrain supply thus worsening regional shortages, and stifle competition without proportional quality benefits.
Put these pieces together and the U.S.-Australia parallel becomes clear. In both countries, abundance rises sharply where goods are tradable, scalable, and exposed to competition, especially in consumer goods. In both countries, abundance falls where supply is politically constrained, especially in housing, or where consumers are insulated from prices, especially in education and health. In both countries, the political temptation is to talk about ‘greed’ or ‘corporations’ in the abstract, because that rhetoric is easier than zoning reform, payment reform, or subsidy reform.
Time pricing makes that evasion harder. It forces a question that voters can understand: “How many hours do I have to work to get this?” If the answer is falling for most goods, then capitalism is delivering progress even when headlines are negative. If the answer is rising for a few big services, then reform should focus there rather than on sweeping ‘systemic changes’ advocated by the opponents of capitalism.
That is also why I think Pooley’s adjustment is not a gimmick but an educational tool. Economists often talk in ‘real’ terms, but ‘real’ is still abstract for most people. Hours translate purchasing power into a human scale. Hours also expose trade-offs. A country can enjoy explosive abundance in electronics and still struggle in housing because the two sectors face different constraints. A time-price chart makes it possible to see both facts at once.
The Baumol Effect: partial explanation, not excuse
At this point, a skeptic usually raises a fair objection: maybe the expensive sectors are simply doomed to cost more because they are labor intensive. This is where the Baumol Effect enters the picture. The American economist William J. Baumol argued that when productivity rises rapidly in some sectors but slowly in others, wages tend to rise economy-wide, which pushes up the relative price of the slow-productivity sectors. The canonical example is live performance: a string quartet still needs four musicians, even as manufacturing learns to produce much more output per worker. Baumol’s point is not that anyone is doing anything wrong; it is that relative prices can shift even in a healthy economy.
Baumol’s logic explains part of why services such as education and health tend to rise relative to manufactured goods. A nurse can only treat so many patients per hour. A primary school teacher can only control and teach so many students at once. When wages in education and health rise because productivity elsewhere rises, these services get pulled upward.
The mistake is to treat Baumol as destiny. Relative-price pressure from uneven productivity does not imply that costs must explode as much as they have, or that policy is irrelevant. Service sectors can innovate in processes, adopt labor-saving technologies, and reorganise delivery, but those changes often require more flexibility, entry, and experimentation. The moment rules lock in legacy models, Baumol becomes an excuse rather than an explanation.
Here is a useful counterexample: cosmetic procedures. Unlike most healthcare, cosmetic surgery is often paid for directly, which creates price transparency and consumer shopping. Providers compete, new entrants have incentives to offer better deals, and process innovation matters because patients can choose. In my own work with Gale Pooley, I have pointed to the time price of cosmetic procedures falling over time, even though it requires surgeons, nurses, anesthesiologists and hospital stays. The existence of that counterexample suggests that the Baumol Effect should be treated as a baseline tendency, not as a policy alibi.
When people say the Baumol Effect makes rising service costs inevitable, they understate how much institutional design can amplify or dampen the trend. Third-party payment can turn patients into bystanders. Subsidies can turn prices into someone else’s problem. Entry barriers can turn local providers into protected incumbents. Zoning can turn an economy’s most valuable land into a museum exhibit. Those are policy choices, not natural laws.
Policy implications: removing chokepoints to abundance
The practical lesson for both America and Australia is not ‘everything is fine’ and not ‘everything is broken’. The lesson is that modern economies generate abundance (leading to lower time-prices) where markets are allowed to work, and they generate scarcity (leading to higher time-prices) where policy blocks adjustment. That is not a romantic argument about markets; it is an empirical observation that shows up in the sectoral data.
Of course, averages never capture every household. Wage indices and CPI baskets are national constructs. People at the bottom of the wage distribution, or people with high exposure to rent, tuition, or medical bills, can feel squeezed even when the average time price falls for most other goods. That is precisely why this research matters: it separates the broad story of rising abundance of goods from the narrower story of policy-driven bottlenecks in a few sectors.
If you want abundance, the to-do list is relatively simple. Let housing supply respond to demand by reforming zoning and speeding approvals. Make healthcare prices visible, while removing entry restrictions that protect incumbents. Treat higher education subsidies with skepticism when supply is constrained and pricing power is strong. Be cautious about regulations that mandate costly inputs in childcare without expanding supply.
The Australian situation mirrors the American one in the ways that matter for reform. Both countries show extraordinary abundance growth in competitive, tech-driven categories. Both countries show declining abundance in sectors shaped by third-party payment, subsidies, or supply restrictions. Perry’s chart gives the public a clean visual of relative prices. Pooley’s time-price adjustment tells the public what those prices mean in work time.
Put together, Perry’s and Pooley’s data show that the path to higher living standards rests in removing the specific barriers that keep the most important services from delivering the kind of abundance that the rest of the economy already knows how to produce.
Conclusion
The evidence outlined above points to a conclusion that is both reassuring and demanding. It is reassuring because it shows that modern market economies continue to generate remarkable gains in abundance. Goods that once consumed substantial portions of household budgets — communication services, clothing, electronics, furnishings — now require dramatically fewer hours of work. These improvements are not accidental. They are the result of productivity growth, competition, global integration, and innovation.
But the evidence is also demanding, because it shows that scarcity persists where institutional design prevents adaptation. Housing becomes less abundant when zoning rules restrict supply in high-demand areas. Education becomes less abundant when subsidy structures weaken price discipline while protecting incumbent providers. Healthcare becomes less abundant when third-party payment dulls consumer incentives and entry barriers shield suppliers from competition.
The divergence across sectors demonstrates that the affordability debate should be disaggregated. The relevant question is not whether ‘capitalism’ is working, but where policy prevents markets from working effectively.
Time pricing sharpens that distinction. It translates abstract inflation statistics into a measure that voters intuitively understand: hours of work. When those hours fall, abundance grows. When they rise, something is impeding adjustment.
If policymakers wish to improve living standards, the agenda is clear:
- Reform land-use regulation to allow housing supply to respond to demand. Increase price transparency and competition in healthcare.
- Re-examine higher education finance in light of supply constraints and pricing power.
- Scrutinise childcare regulations and subsidies to ensure they expand supply rather than merely inflate demand.
Abundance is not guaranteed, but it is the normal outcome of competitive, innovative systems. Where scarcity persists, it is rarely fate. More often, it is the cumulative result of policy choices that can, with sufficient political will, be reconsidered.
The path forward lies not in dismantling the system that generates abundance in most sectors, but in extending its principles to the sectors where scarcity still reigns.