
Executive Summary
The electricity system in Australia is adjusting to an increase in the overall amount of risk brought about by the increasing pace of the so-called ‘energy transition’. This will inevitably result in higher prices for everyday Australians.
The mechanism through which this risk becomes cost is electricity retailing.
The business of selling power has become fundamentally more expensive. Electricity retailers operate under a ‘fixed-for-float’ model — offering customers stable prices while sourcing energy from an extremely volatile wholesale market. This model relies on financial derivatives to hedge against wholesale price fluctuations. However, every major factor underpinning the cost of electricity supply is trending unfavourably for retailers.
- Wholesale price volatility is rising sharply, with extreme price spikes becoming more frequent, at all times of the day. The average wholesale price has also increased, driven by fuel costs, supply disruptions, and the integration of renewables.
- The so-called ‘duck curve’ — a distortion in daily demand and price patterns caused by high rooftop solar penetration — makes hedging more complex and expensive.
- Rooftop solar has created a hidden cross-subsidy: non-solar households are effectively paying more for their electricity, as retailers are forced to pass through losses from solar customers.
- Compounding the challenge is a declining supply of derivative contracts, primarily due to the retirement of dispatchable coal generation, which historically underpinned these hedging instruments. Intermittent renewables such as wind and solar are unable to provide firm derivative products, leading to higher costs for derivatives at the same time as demand for hedging increases.
Though some retailers have faced suppressed profit margins, the real loser is the Australian electricity consumer, to whom all these costs must eventually be passed. Those responsible for the problem are now attributing the blame to ‘market failure’.[1] The Australia Energy Regulator has resorted to scapegoating retailers and removing the competition allowance in the Default Market Offer (DMO),[2] with changes to further cap prices signalled by Energy Minister Chris Bowen.[3]
If the energy transition continues, Australia will continue to see higher prices for consumers, more retailer failures, and less market competition. The problem is due to the intermittent generation that is being forced into the system, and the retiring of dispatchable thermal generation — driven by the government’s Net Zero ambitions and the ‘82% by –2030′ renewable energy target. Powering a nation with intermittent wind and solar is proving to be far more expensive than the Australian people were initially told, especially after counting the costs of the second and third-order effects considered in this paper. Until these policies are reconsidered, problems in the market will persist.
1. Introduction: retailing is a fixed-for-float business
Australians might be annoyed about rising electricity costs, but they don’t think about power as volatile. Every quarter, their bill comes in and it’s relatively predictable. Yet the concept of a fluctuating market price is not foreign to Australians. Fuel prices are different every time they fill up their car, and the average grocery shopper is used to seeing seasonal price changes on supermarket fruit and vegetables. But most Australians view power in a similar way to Weet-bix: it’s always there, and it doesn’t really change that much.
This is due to the relatively fixed nature of electricity bill charges. A typical retail electricity bill contains a fixed charge for each kWh of electricity consumed, plus a fixed daily supply charge. For customers with smart meters, there are often peak, off-peak, and shoulder rates; based on the time of use of the electricity. A customer with a simple spreadsheet and their meter data could calculate exactly how much their energy use cost them.
Yet behind the scenes, retailers must procure this power from the wholesale electricity market, where prices change every five minutes. They act like a greengrocer agreeing to offer fixed prices on all vegetables, regardless of what they can get the goods for in the wholesale farmers markets. However, power is a considerably more volatile market. In fact, the Australian power market is the most volatile power market in the world.[4] For every given five-minute interval, dozens of generators bid to supply power, responding to a host of factors like fluctuating demand, weather, and fuel cost. Retailers assume all this risk when supplying a customer with electricity. This is effectively the service they provide to the consumer. However, it presents a huge challenge to manage this risk effectively; a challenge that historically has been both achievable and profitable.
If they don’t directly own generation assets, the typical way retailers manage this risk is with derivatives contracts. To the average consumer, these are seen as arcane financial wizardry, and perhaps associated in people’s minds with the Global Financial Crisis. But in fact they are extremely important instruments used in almost every market around the globe to manage risk.
Derivatives are essentially tradeable insurance contracts. They come in a variety of forms with different names (options, swaps, futures, forwards, etc.) and vary from standardised to bespoke. Their typical basic structure is an agreement to exchange a fixed dollar amount in return for some uncertain amount, which is determined by (or derived from) the movement of future prices. Once the future becomes the past, this amount can be calculated, and the appropriate funds are paid. It is important to recognise that the main point of a derivative contract is to transfer risk from one party to another. For every contract signed, someone is aiming to get the fixed or less-risky end of the deal, and someone is willing to take the floating or riskier end. Of course, this is a service, so carries a cost premium to perform.
Ideally, in a well-functioning derivatives market, there are offsetting counterparties, each interested in opposite sides of the deal. An example from agriculture might be a cotton grower who is worried about the price of cotton going down in six months, and a textiles manufacturer who is worried about the price of cotton going up. The parallel for electricity is a coal-fired generator concerned about low prices, and a retailer concerned about high prices. A broker of derivatives can issue a contract to both parties, effectively offsetting the payouts and leaving the broker with no risk.
There are two main types of contracts traded on the ASX for Australian wholesale electricity: futures, which are typically used to hedge average prices; and options (caps), which are typically used to hedge momentary periods of high prices. There is also a range of bespoke options offered by banks and hedge funds, including demand-shaped or load-following hedges.
2. Every factor in retailing is moving in the wrong direction
A retailer who has offered a fixed-price contract to a customer is obviously primarily concerned with the cost of procuring this power. This is calculated as the sum over every period of the product of:
- The wholesale price for each period ($/MWh); and
- The customer demand for each period (MWh).
There are several factors that can influence this overall outcome.
- The volatility of the power price; including momentary large spikes in price, which, while not necessarily affecting the average very much, can cause huge losses quite quickly. It also matters how predictable the timing of these events are: whether they occur at any time of day or only during peak demand times;
- The average price of wholesale power;
- The time of the day when price is highest. If power is generally more expensive at the time of day when people use the most, this will increase overall costs. This is called the ‘price curve’; and
- Instances of negative prices or demand, which can create complicated dynamics;
Every one of these factors is trending in the wrong direction, all contributing to a rising cost to supply electricity.
2.1 Volatility is increasing
Australia has the dubious honour of having the most volatile power market in the world.[5]
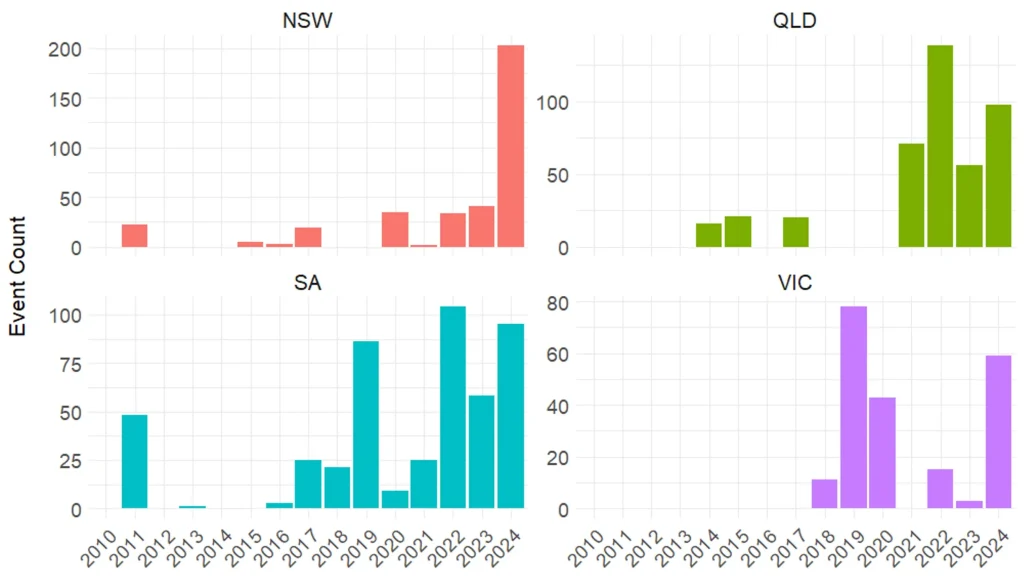
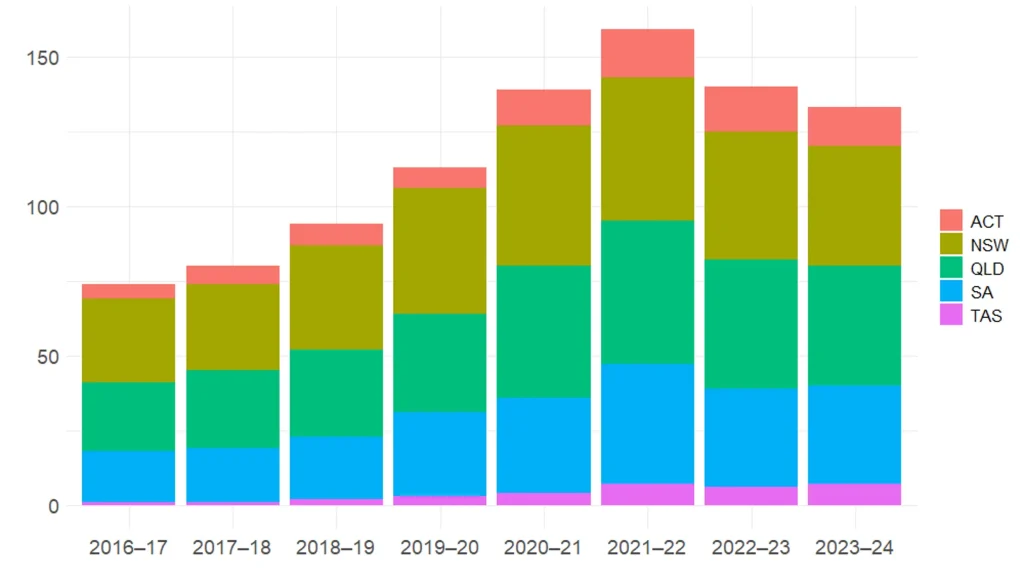
Not only has the maximum price cap been lifted from $10,000/MWh in 2010 to $20,300/MWh in 2025,[6] but the price is hitting the cap more often, coinciding with more extreme price events per year (Figure 1). Prior to 2018, many states had entire years where the price did not hit the cap. In recent times, hitting the cap has become commonplace.
Figure 1: Frequency of extreme price events (price > $10,000) by state
Even aside from extreme events, the power price is still extremely volatile. The quarterly standard deviation of prices in recent years has been consistently higher than prior to 2018 (Figure 2).
Figure 2: Quarterly standard deviation of wholesale prices by region
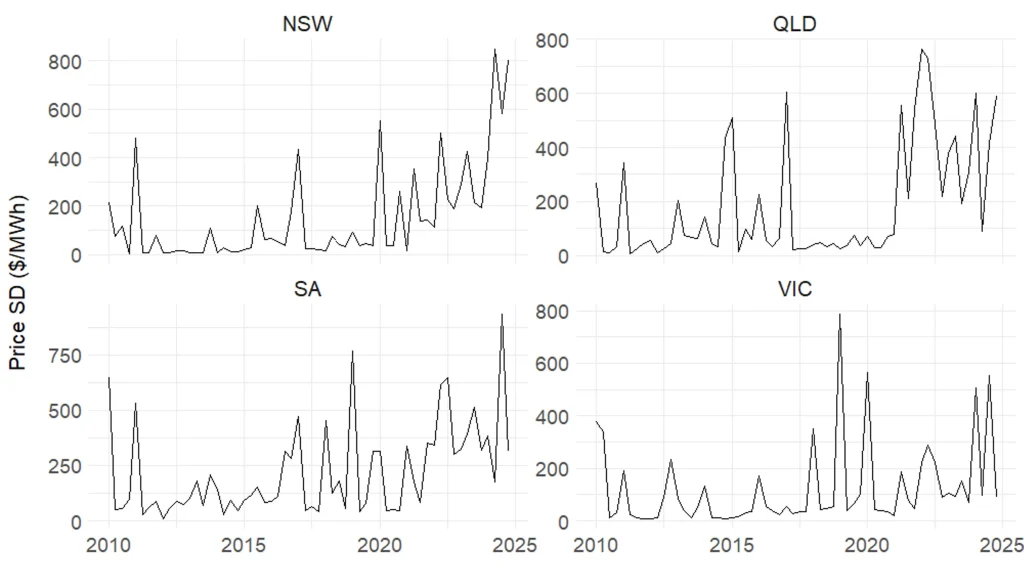
If retailers do not adequately hedge against the risk of large price spikes, their profitability can be eroded very quickly. This increases the need to remain more tightly hedged at all times.
Retailers face a choice of two types of hedges. They can protect themselves from the average price increasing, or from large spikes in price. These are generally done with products like swaps/futures and caps/options, respectively. It is difficult to do both these jobs with one product, because the demand curve is not flat, meaning that if a futures contract was bought at the level of peak demand, this would be over-hedging the demand for the rest of the day. But if it was sized smaller, to average demand, this would leave price spikes at peak demand under-hedged. Hence, a combination is typically used: futures to hedge average prices, and caps to protect from extreme prices.
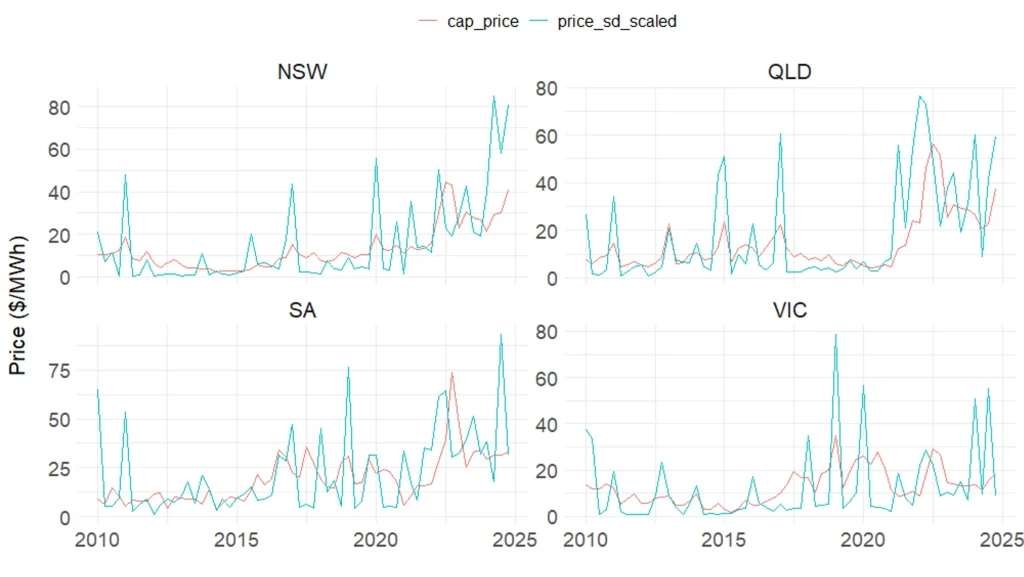
Caps are options that pay out whenever the power price spikes above $300/MWh. Unfortunately, cap price is heavily correlated with volatility (Figure 3). In the current environment, this means that the cost to hedge has increased at the same time as the need to hedge. In more volatile times, volatility protection becomes more valuable and more essential.
Figure 3: Cap price vs wholesale price volatility
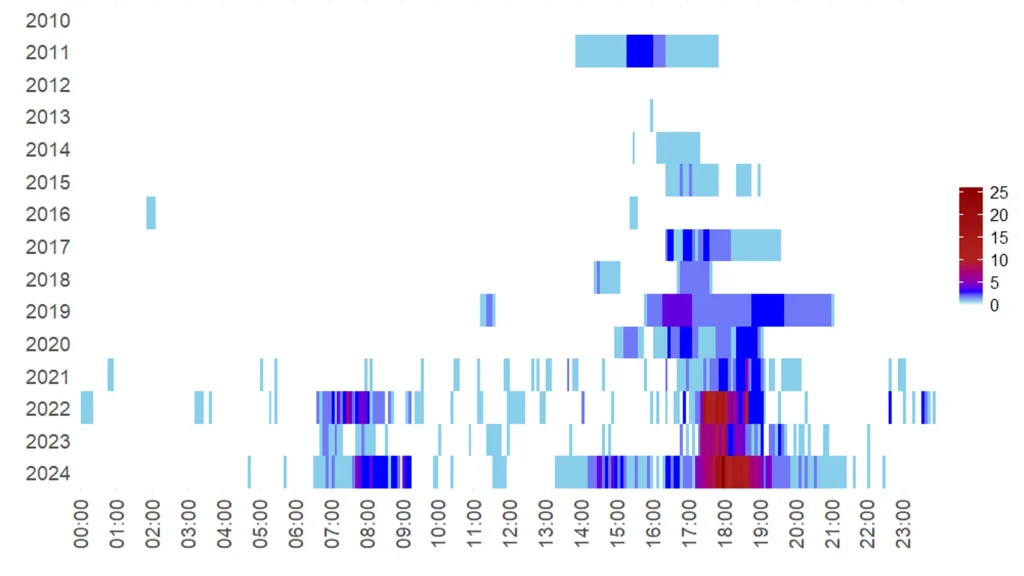
Not only have extreme price events become more frequent, the timing of this volatility is becoming less predictable (Figure 4). For many years, these could be almost guaranteed to occur during the late afternoon and evening peak. They are now occurring much more frequently at random times throughout the day, with another cluster developing in the morning mini-peak.
Figure 4: Time-of-day of extreme price events (price > $10,000) by year
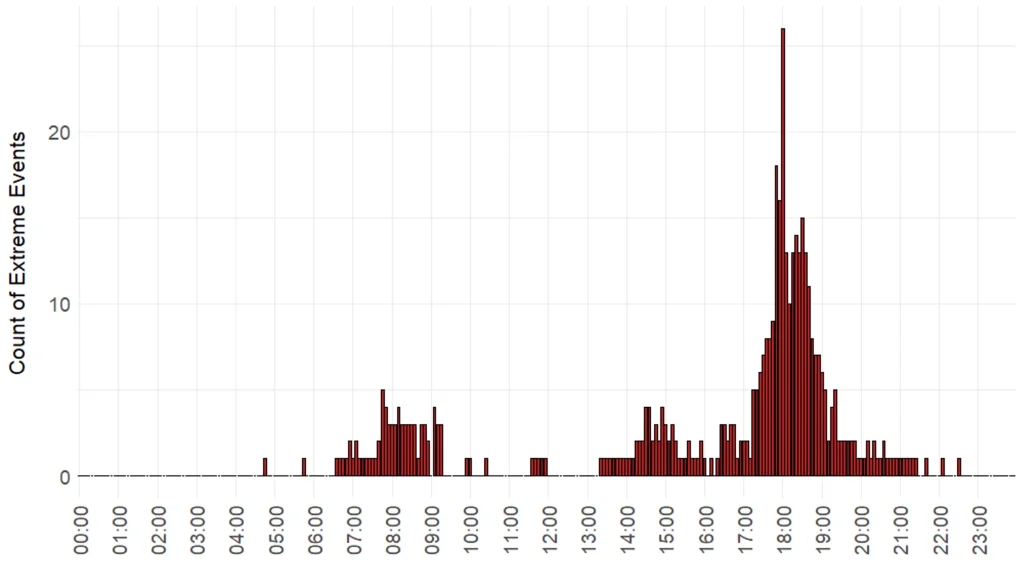
In 2024 in particular, the price spiked more often in the afternoon shoulder at 2 to 3 pm (Figure 5).
Figure 5: Time-of-day of extreme price events (price > $10,000) in 2024
As the power market continues to become riskier, retailers will face increasing hedging costs against these extreme price events.
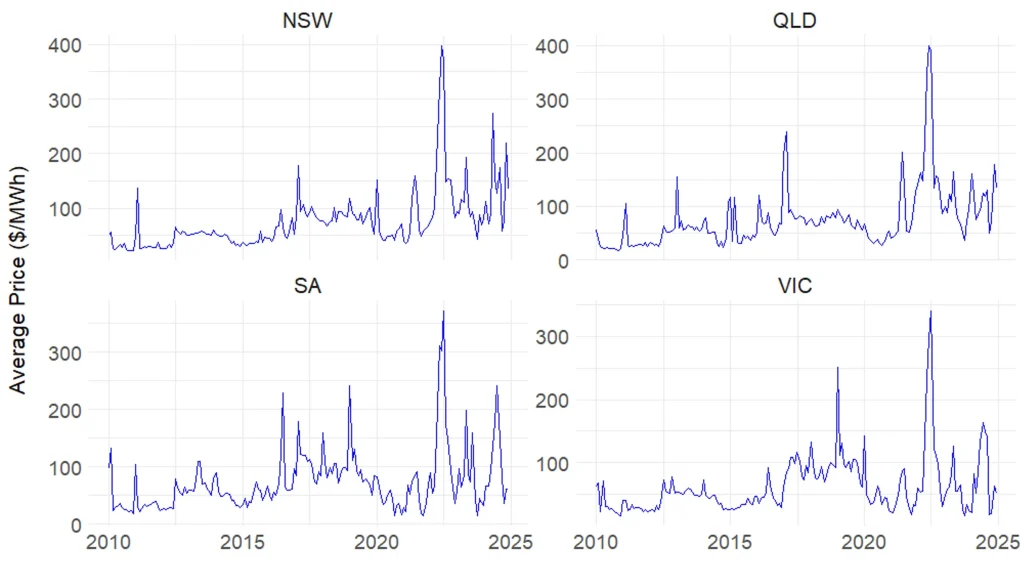
2.2 Average price is increasing
Aside from a small dip in 2020-2021 (due to the Covid-19 pandemic), the average power price has increased almost every year (Figure 6). Prices below $50/MWh were once normal, whereas they are now consistently above $100/MWh.
Prices in 2022 were momentarily much higher than average, due to high coal and gas prices, disruptions to coal generation, and unfavourable weather. Yet since then, prices have continued to remain high and are showing no signs of dropping.
Figure 6: Monthly average wholesale prices
This has two effects, one obvious and the other more subtle:
- Power becomes more expensive to supply every year;
- Retailers must now hedge their exposure to intra-period price rises. Whereas they may have previously been primarily concerned with capping their losses from extreme price events, they now must hedge even the baseline prices as well.
This was a major factor in the exit of dozens of retailers in 2022. Though it was a particularly volatile year, their financial stress was largely due to the rising overall prices, rather than the volatility. The ACCC, in its 2022 inquiry into the NEM, stated that, “High and volatile wholesale electricity spot prices, coupled with high contract prices, reduced access to hedging contracts … are impacting the financial viability of retailers”.[7]
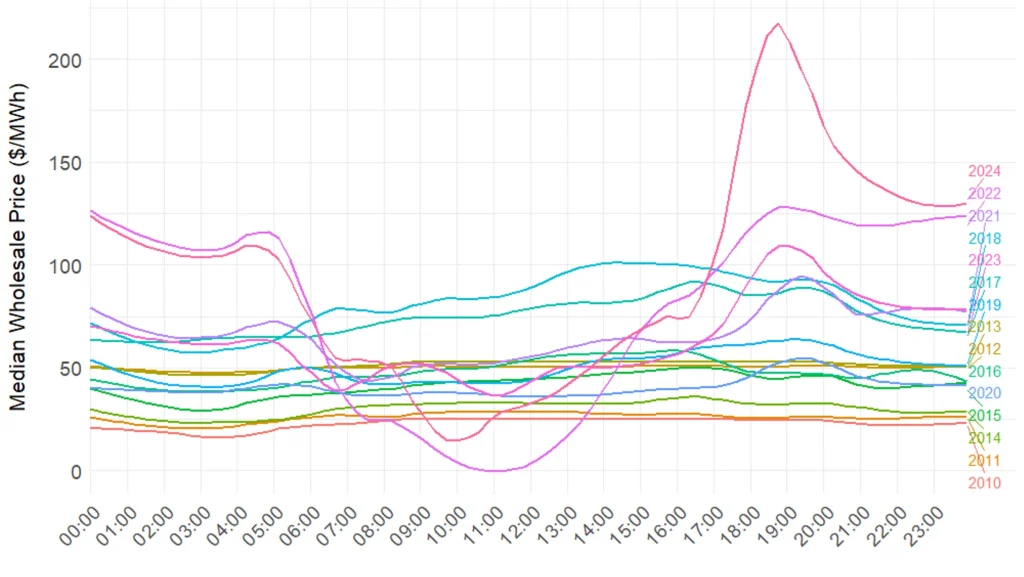
2.3 The duck curve is intensifying
The increasing penetration of solar generation in the grid is changing both the price and demand characteristics.
Solar power is generated in the middle of the day when the sun is shining, but this doesn’t align with the timing of peak demand (usually in the early evening). This means that huge volumes of power must compete to enter the grid, forcing prices close to zero and frequently negative. However, once the sun goes down, people come home from work and switch on appliances, creating a much higher demand, and raising prices for the few remaining non-solar generators online.
This is a well-documented phenomenon known as the ‘duck curve’, which has emerged worldwide in renewables-dominated grids, and is intensifying year on year in Australia (Figure 7).
Figure 7: Duck curve – December daily median electricity price profile
Because cost is price multiplied by demand, an intensifying duck curve heavily skews the daily cost toward the critical evening peak time, which results in higher total costs (Figure 8). The highest demand coincides with the highest prices.
Figure 8: Typical price, demand, and cost profile
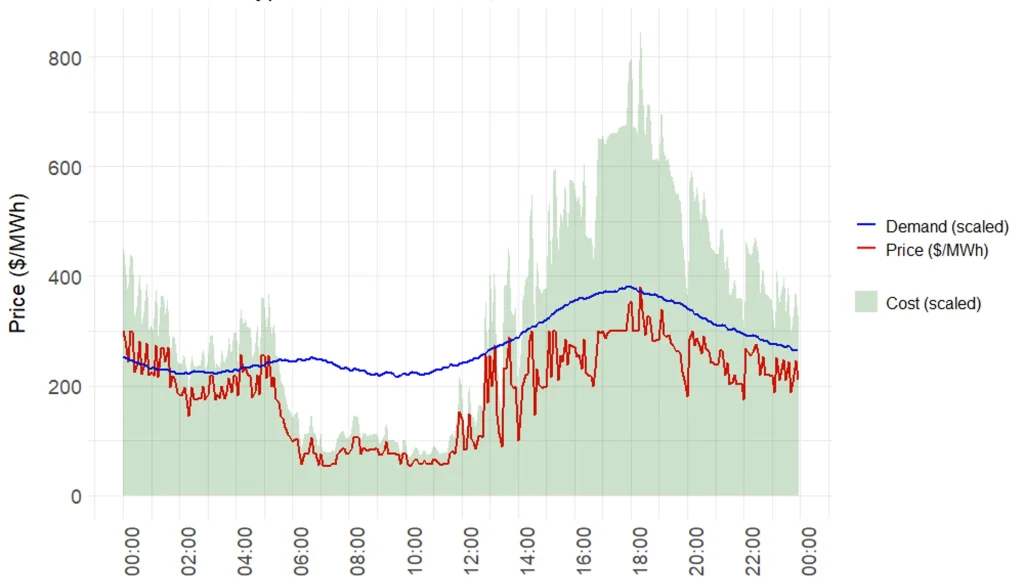
This is also a more difficult profile to hedge. A flat profile can be easily hedged with futures (see the 2010 line in Figure 7), but a profile with large peaks and troughs makes it harder to appropriately size a hedge. A simple futures or swap contract sized at the average demand leaves a lot of risk unhedged in peak times. Hence, more products must be used to replicate this risk profile. Banks and hedge funds have stepped in, offering ‘demand-shape’ or ‘load-following’ hedges, which of course, carry higher cost premiums. In July 2025, new Morning and Evening Peak contracts were released on ASX Energy[8], which are intended to help ameliorate this issue. But the fundamental point remains that more hedging with more complicated contracts must be performed due to this emerging shape.
2.4 Rooftop solar trends
The Centre for Independent Studies recently has written about the uniquely Australian phenomenon of extremely high levels of rooftop solar[9] and the impact this is having on the grid. In particular, CIS exposed the fact that households without solar panels are effectively subsidising those with them. These cross-subsidies arise because rooftop solar does not reliably reduce peak demand, and hence does not materially reduce grid costs. In fact, if anything, rooftop solar increases grid costs through lowering minimum demand, which increases grid stress. Network tariffs are structured in such a way that largely-fixed network costs are passed through to consumers as largely-variable per-kWh network charges. Since rooftop solar self-consumption offsets grid consumption, solar households receive outsized savings by not having to pay their fair share of network costs.
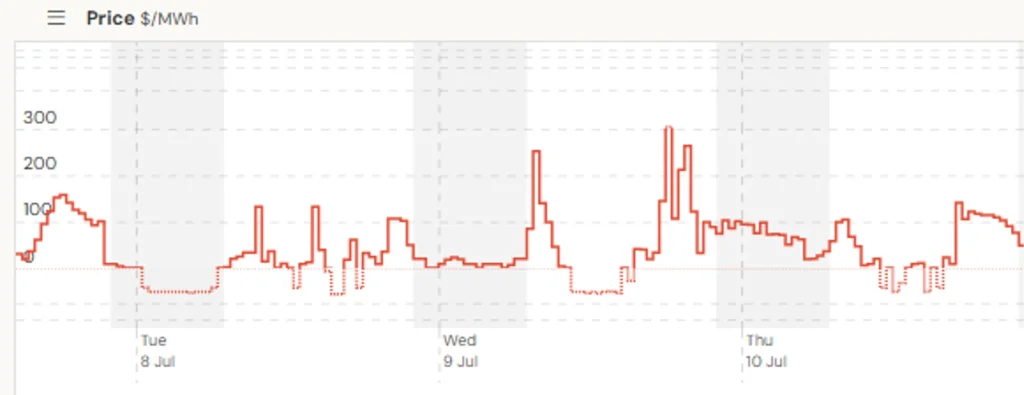
The commentary provided in Rooftop Solar: Paradise Lost was restricted to network charges, but there is a similar cross-subsidy that operates on the actual generation costs. A solar demand profile is more expensive to supply than a non-solar profile. Prices are frequently negative at the same time that demand is negative (when a household is exporting power), so a retailer will have to pay the feed-in tariff to the customer, and pay to offload that power in the wholesale market (Figure 9).
Figure 9: A few days of Victorian power prices, showing frequently negative prices
We modelled the total cost to procure power for a typical household with rooftop solar and one without over a range of historical price data.
Figure 10 shows the difference across states for a typical 6.6 kW solar system, with feed-in tariffs set to 3c/kWh. See Appendix 1 for more details on the model. The modelling is highly sensitive to feed-in tariffs. Reductions to zero diminish but do not eliminate the effect, which is presumably why many retailers nationwide are reducing their offered rates. Note that the states with regular negative prices (QLD, VIC, SA) show much greater divergence than NSW, where prices are not as depressed during the middle of the day.
Figure 10: Cost-to-supply of electricity for solar and non-solar households
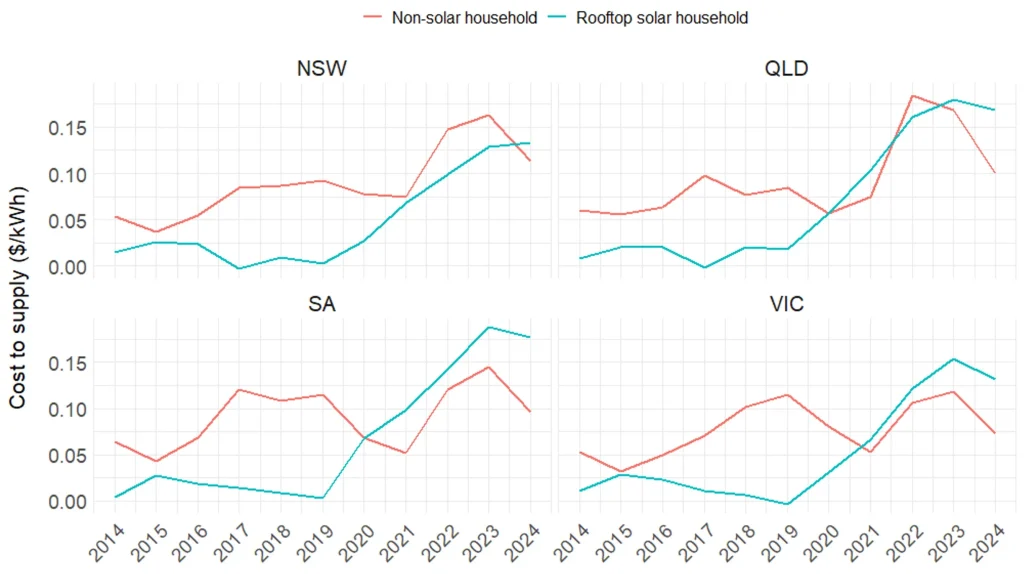
In the past few years, solar households have become more expensive to supply than non-solar households. Yet it is not standard market practice to offer these customers different rates. In Victoria, retailers are legally prevented from offering different rates.[10] This means retailers must make a greater margin on non-solar customers, and use this to offset the thinner margin from solar customers.
The net result is that households without solar are paying more than they should for their power in two ways: through the network charge cross-subsidy, and through the energy supply cross-subsidy.
There has been much talk of “consumer protection”,[11] “equity”[12] and a “just transition”,[13] yet the opposite result is being achieved.
A more equitable arrangement would see households with and without solar panels offered different rates, with any costs associated with each cohort distributed only among that cohort, including both wholesale and network costs.
2.5 Derivative supply is decreasing due to less dispatchable generation
All of the above trends point to increasing risk in power markets. Risk across average price, volatility and intraday shape. We now turn to examine the ill-health of the major risk-management tools used by the market: derivatives.
Although increasing risk drives demand for derivatives up, their supply is shrinking, resulting inevitably in increased prices. The same phenomenon is at play: risk management costs are increasing at the same time as the risks needing to be managed are increasing.
A crucial element of power derivative markets is the presence of dispatchable generation.
In the introduction, we mentioned the naturally offsetting counterparties in derivatives markets; each interested in opposite sides of a deal. Brokers generally offload risk (temporarily assumed when writing a contract) to someone willing to take the other side of a deal. Failure to do this can leave brokers and trading firms with excessive amounts of risk, which, due to the very high notional volumes being traded, can easily have catastrophic consequences if the market moves against them.
For the power market, the two sides of a derivative deal are usually generators and retailers. We will now examine the most common and simple type of contract: the swap.
A generator typically signs a swap contract exchanging the floating or uncertain returns from the spot market for a fixed return (Figure 11). This obligates the generator to pay the variable power price and receive some fixed price. Yet this is a paper contract with no bearing on the physical world. Once signed, the obligation to pay would exist even if the generator shut down and did nothing. Therefore, a generator must actually operate and produce the amount of power agreed to in the contract. It sells that power in the spot market, as usual (at variable prices), so that it can pay the variable price in the derivative contract.
Figure 11: Cashflow exchanges in a swap contract
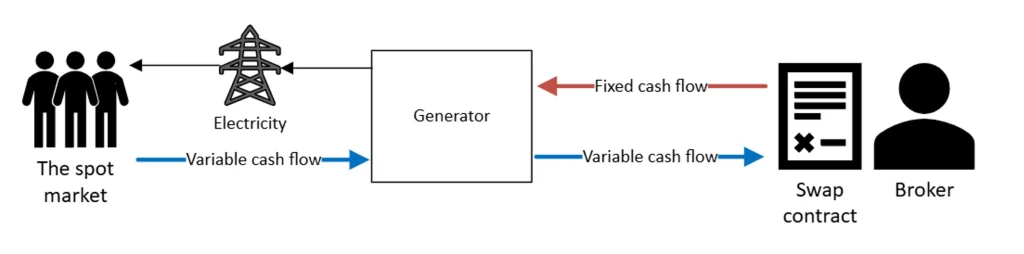
If the generator experiences an outage, it is exposed to the obligations in the swap contract. This is the key: the generator must be able to physically generate power at all times of the day in order to sign a swap contract with confidence. This therefore automatically excludes any non-dispatchable power sources from contributing supply to the derivatives market. Wind and solar simply cannot generate with enough constancy to sign these contracts. Even coal plants are contracting less of their capacity as they age and become less reliable, for fear an outage could leave them exposed.[14]
When coal-fired power previously dominated the grid, the buyers and sellers of swaps were roughly balanced. The same amount of power was produced from dispatchable generation as was required to be hedged by retailers. Today, with variable renewables at ~33% of the grid,[15] the providers of swaps have dramatically decreased, but the demand for swaps from retailers has stayed the same: their business model has not changed, and they need to hedge as much power as they always have.
The recent National Electricity Market Review draft report specifically notes the decrease of thermal (dispatchable) generation capacity as the cause of the reduction in hedge liquidity.[16] Likewise, an ACCC inquiry concedes that “as coal power plants retire, there will likely be a reduction in the number of generators that can offer traditional contract types, such as flat swaps”, and as a result, that “small standalone retailers and new entrants may find it increasingly difficult to manage spot market price risk in the future”.[17]
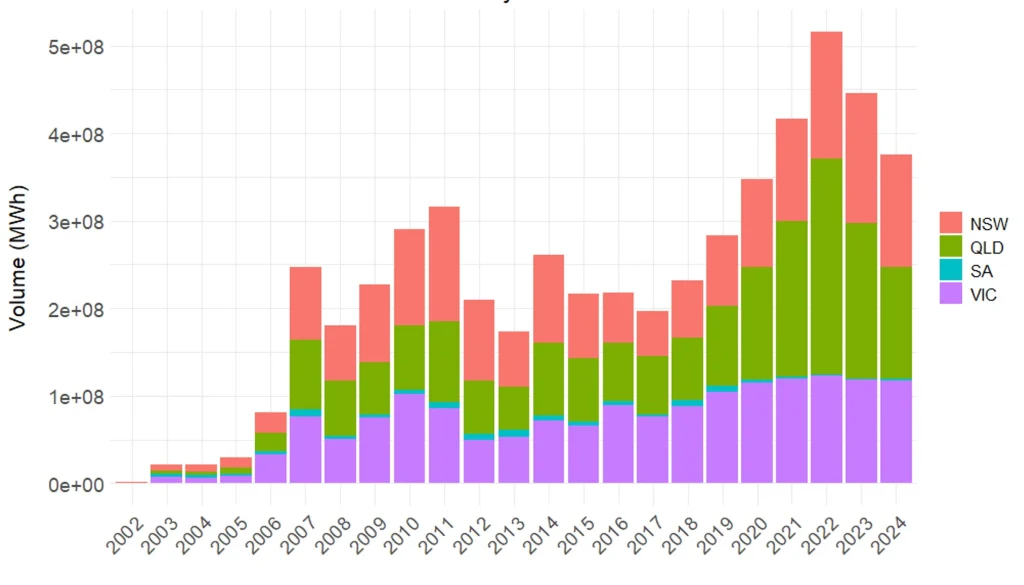
Note that South Australia, with no coal fired power stations, has the lowest (basically non-existent) liquidity (Figure 12). The AER affirm this view: “The region’s high proportion of renewable generation and relatively concentrated ownership of dispatchable generation has likely contributed to this weaker liquidity, with renewable energy less suited to underwriting the standard contracts listed on the ASX”.[18]
Figure 12: Futures volume by location and year
As mentioned above, the demand for hedging remains strong due to the high levels of risk in the market. There is also increasing regulatory pressure and oversight on hedging. The AER has implemented enhanced monitoring and reporting in the wake of the 2022 crisis to ensure retailers are sufficiently hedged.[19]
Meanwhile, high average costs and high volatility add further upward pressure to derivative prices (Figure 13 & 14).
Figure 13: Monthly average prices: Futures vs Wholesale
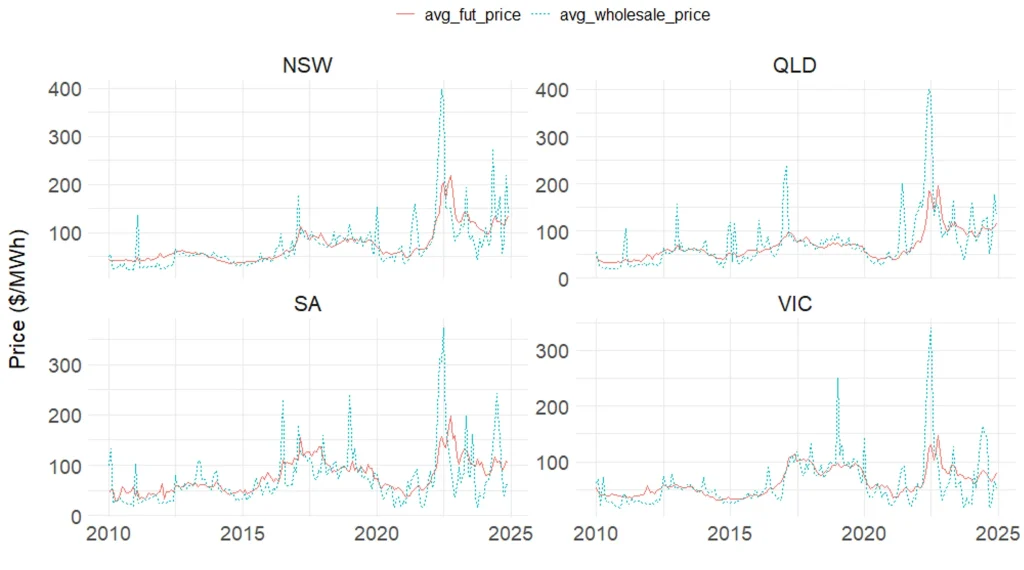
Figure 14: Monthly average cap price by location
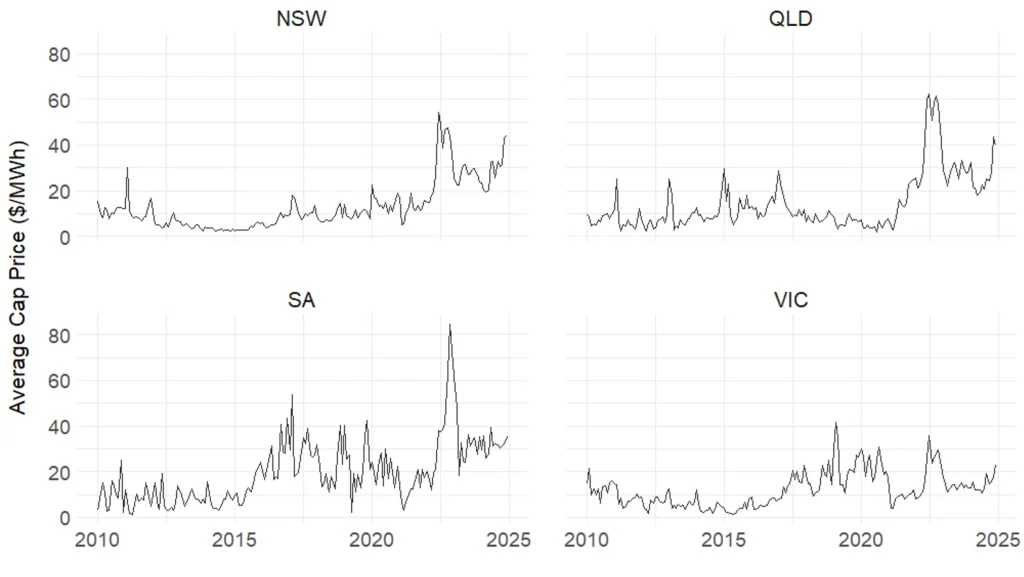
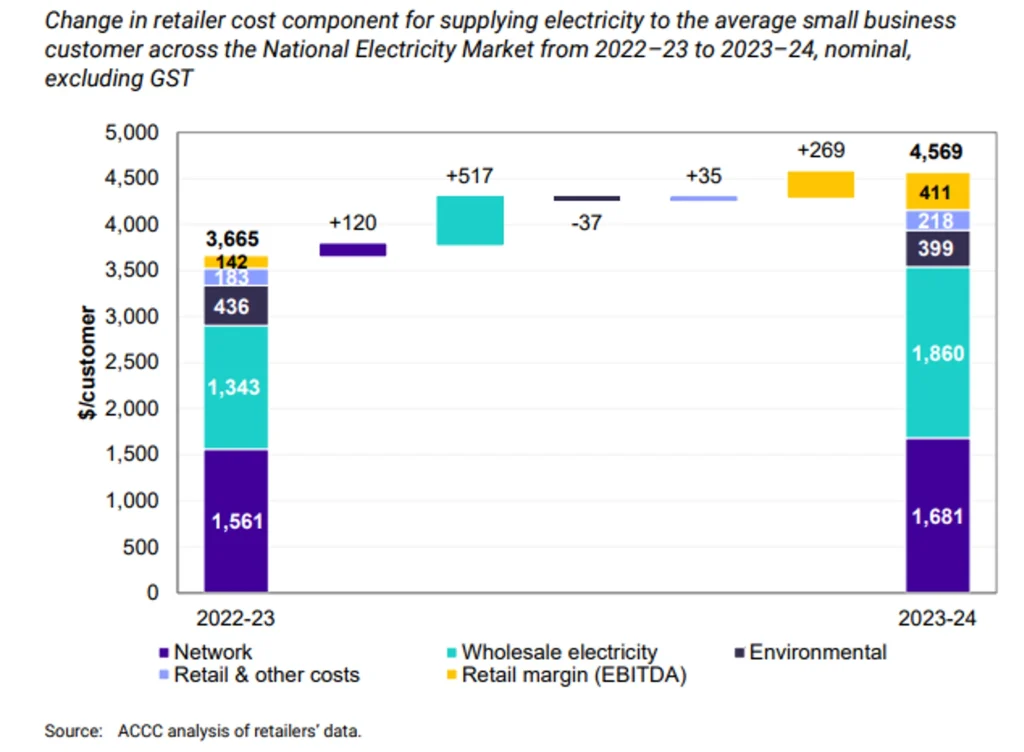
The net result is that retailers will continue to experience cost increases in procuring hedged wholesale power (Figure 15[20] & 16[21]). The ‘wholesale power’ component (which includes hedging) of the retail cost stack will continue to increase.
Figure 15: Retailer wholesale costs increased in all regions in 2023-24
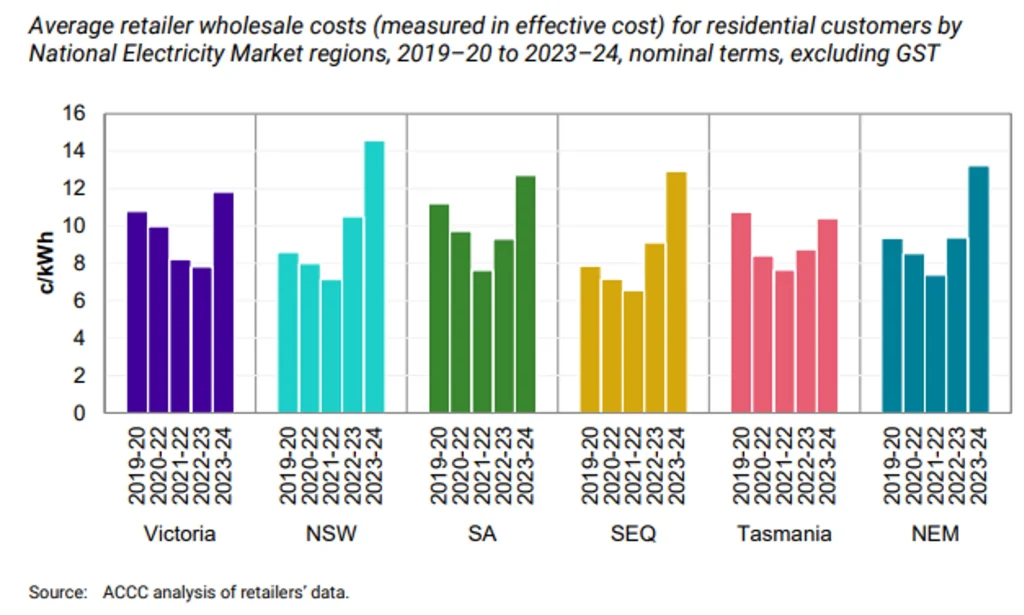
Figure 16: Retailer wholesale costs for small business customers increased significantly in 2023-24
The ACCC confirms that hedging is the dominant factor in the wholesale cost: “While spot prices can immediately impact a retailer’s costs, it is typically the hedging contract market that most strongly influences retailers’ wholesale electricity costs.”[22]
3. Where will this end?
If costs are increasing, this must result in either higher prices for customers, lower margins for retailers, increasing retailer failure — or some combination of all three.
3.1 Increased prices from risk premiums
As with all businesses, risk demands reward. For capital to be deployed in increasingly risky ventures, higher margins must be earned. Where the returns are not commensurate with the levels of risk perceived to be taken, companies will exit (or not enter).
The fixed-for-float arrangement where retailers agree to take all of the risk on behalf of the customer, will become an increasingly expensive service. This is rational market behaviour, but could be seen by some as ‘price gouging’. The same effect was observed in supermarkets grappling with the inflation caused by fiscally expansionist COVID-19 measures, which faced similar accusations of ‘price-gouging’[23] and ‘shrinkflation’.[24]
Echoing this, federal Energy Minister Chris Bowen recently announced the government would be “stripping out the competition allowance” as part of the Default Market Offer (DMO) review.[25] He claimed “competition … was not working”, so as a response, plans on “putting further restraints on what retailers can claim back from consumers in their bills”.
This comes after two successive years in which the competition allowance was not applied in DMO 6 and DMO 7. The AER cited “economic conditions, cost-of-living pressures and energy affordability issues experienced by consumers”,[26] which is effectively compensating for the failure of government policy to lower system costs by reducing the retail margin, even though retailers were not in any way responsible for cost increases across the system.
The DMO is a type of price cap enforced by the regulator for ‘standing offer’ customers, although it functions only as a comparison benchmark (not a cap) for normal market offers. Calculated annually, it is set at a level designed to reflect the actual cost of providing electricity, plus some extra margin, such that historically, most retailers have offered prices well below the price set by the DMO. This is in line with the original intention, which was not to serve as an overall market price cap, but as a fallback price to protect vulnerable consumers who are unable to easily change electricity plans, and who do not have the capacity to absorb unexpected bills.
However, with competition being blamed for price increases, there is a risk that the DMO becomes weaponised to serve as a de facto price cap on the whole market, which will simply constrain supply and decrease competition. Instead of blaming retailers, perhaps the blame is better placed at the feet of governments which have created a system so expensive and chaotic that competitive markets are starting to break down.
3.2 Less competition in the future is possible
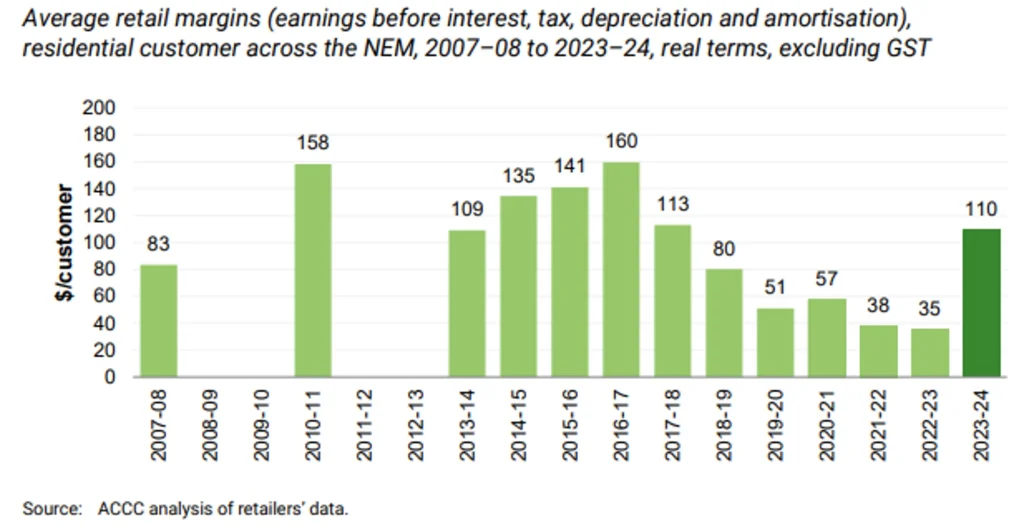
The ACCC has acknowledged in a 2024 report that retail margins have reached all-time lows in recent years (Figure 17[27]). It remains to be seen whether the recovery in 2023-24 is a one-off phenomenon or the start of a new trend. The report itself notes that “the sharp increase in retail margins could have been driven by unique circumstances in the 2023–24 financial year”, and acknowledges that “due to the combination of factors affecting the 2023–24 results, and relatively lower margins in recent years, it is unclear whether increased profitability will persist in the medium term.”[28]
Figure 17: National electricity market-wide retail margins
The years since 2022 have seen a steady decline in the number of retailers operating in Australia (Figure 18[29]), coinciding with, and caused by, increasingly difficult market conditions. While this is a concerning trend, it has stabilised in the past 12 months. Yet the market conditions remain difficult, and with increasing government and regulatory pressure, the recent rebound may prove to be transient.
Figure 18: Overall number of retailers in the market is decreasing
4. Conclusion
The electricity system in Australia is adjusting to an increase in the overall amount of risk brought about by the increasing pace of the so-called ‘energy transition’. This will inevitably result in higher prices for everyday Australians paying for electricity.
The mechanism through which this risk becomes cost is electricity retailing. The core service of retailers — turning volatile wholesale power into stable fixed-price contracts for customers — is becoming fundamentally harder and more expensive, as:
- Power markets become more volatile and less predictable;
- Periods of extreme or negative prices occur more frequently;
- The daily price and demand curves become more ‘duck-shaped’; and
- The cost of hedging continues to increase due to increasing volatility and decreasing supply.
The only possible result of these phenomena is higher prices for customers, lower margins for retailers, or increasing retailer failure — or some combination of all three.
In the long run, retailers will likely adjust by passing through increased costs to consumers.
Attempts by regulators to bury cost increases in retail margin reductions are misguided; they cannot be effective in the long term. Consumers deserve visibility about what the energy transition is costing them. Regulators and governments should resist scapegoating retailers for problems created well outside their purview.
Moreover, the retail market phenomena are merely second-order effects of the renewable energy targets set by state and federal governments. By forcing so much intermittent generation into the system and retiring dispatchable thermal generation, the system has become both more expensive and more risky. The ultimate loser, at the end of the day, is the Australian energy consumer.
Appendix 1
Rooftop solar cost-to-supply analysis
Three years of data is available from Ausgrid for a sample of 300 homes in NSW with rooftop solar.[30] The data is in half-hourly increments, and is split into demand, controlled load, and solar generation. This allows us to construct an aggregate demand profile of customers, with and without rooftop solar. We can then blend a hypothetical portfolio of customers according to the proportion of solar customers. We also scaled the generation data so that the average size of solar system is 6.6kW, the current average in Australian households.
Data is also available from AEMO for the 30-minute and 5-minute wholesale electricity prices over the last 25 years,[31] split by state.
Combining these two datasets, we are able to solve for the average cost to supply of these households, by finding the flat retail price at which the retailer earns no profit or margin from the wholesale component, i.e. the cost to supply power is exactly equal to the revenue.
The profit for each case is the sum over each 5-minute interval of the below terms.
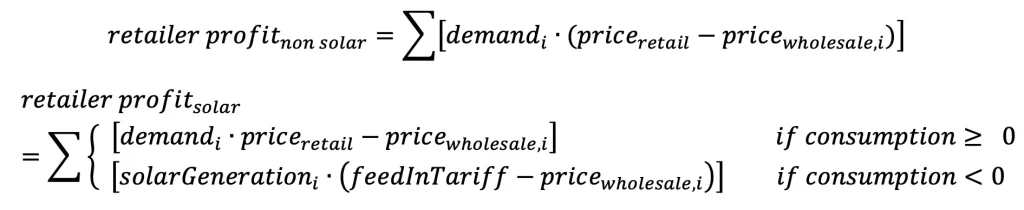
This analysis was conducted in R Studio, for each year from 2010 onwards. Once built, the model can be parametrised and tested for sensitivity to changes in solar system size, feed-in tariffs, and the proportion of solar customers in a retailer’s portfolio. The data can then be visualised and displayed over time and region.
Endnotes
[1] Packham, Colin, The Australian, ‘Chris Bowen’s default market offer crackdown will crush small energy retailers’, 18/6/25, https://www.theaustralian.com.au/business/chris-bowens-default-market-offer-crackdown-will-crush-small-energy-retailers/news-story/da1801c3dcd629a6e4f93011b09f1f8d
[2] AER, ‘AER – Final determination – Default market offer prices 2024-25’, 2024, pp. 65, https://www.aer.gov.au/system/files/2025-02/AER%20-%20Final%20determination%20-%20Default%20market%20offer%20prices%202024%E2%80%9325%20%28track-changed%20comparison%29%20-%207%20June%202024.pdf
[3] Packham, Colin, The Australian, ‘Chris Bowen’s default market offer crackdown will crush small energy retailers’, 18/6/25, https://www.theaustralian.com.au/business/chris-bowens-default-market-offer-crackdown-will-crush-small-energy-retailers/news-story/da1801c3dcd629a6e4f93011b09f1f8d
[4] Rystad Energy, ‘Trouble down under: Australia’s electricity market is the most volatile in the world’, 2023, https://www.rystadenergy.com/news/australia-electricity-market-most-volatile-in-the-wor
[5] Ibid
[6] AEMC, ‘AEMC updates market price cap for 2025-26’, 2025, https://www.aemc.gov.au/news-centre/media-releases/aemc-updates-market-price-cap-2025-26
[7] ACCC, ‘Inquiry into the National Electricity Market’, 2022, https://www.accc.gov.au/system/files/Inquiry%20into%20the%20National%20Electricity%20Market%20-%20November%202022%20report.pdf
[8] ASX Energy, ‘Launching Morning and Evening Peak Electricity Futures Contract’, 2025, https://www.asxenergy.com.au/newsroom/industry_news/launching-morning-and-evening
[9] Centre for Independent Studies, ‘Rooftop solar: paradise lost’, 2025, https://www.cis.org.au/publication/rooftop-solar-paradise-lost/
[10] This rule is located in Section 23C of the Electricity Industry Act 2000, and the ESC’s Guidance note 9 (2021): Solar discrimination, https://www.esc.vic.gov.au/electricity-and-gas/codes-guidelines-and-policies/energy-retail-code-practice/guidance-note-9-2021-solar-discrimination
[11] AEMC, ‘AEMC delivers enhanced consumer protections to help customers find better energy deals’, 19/6/2025, https://www.aemc.gov.au/news-centre/media-releases/aemc-delivers-enhanced-consumer-protections-help-customers-find-better-energy-deals
[12] Ibid
[13] Bowen, Chris, ‘COP28 Umbrella Group Closing Statement’, 13/12/2023, https://minister.dcceew.gov.au/bowen/speeches/cop28-umbrella-group-closing-statement
[14] WattClarity, ‘The forgotten market and its critical role in Australia’s transition to clean energy’, 2025, https://wattclarity.com.au/articles/2025/02/the-forgotten-market-and-its-critical-role-in-australias-transition-to-clean-energy/
[15] Clean Energy Regulator, ‘Quarterly Carbon Market Report December Quarter 2024’, https://cer.gov.au/markets/reports-and-data/quarterly-carbon-market-reports/quarterly-carbon-market-report-december-quarter-2024/state-total-renewables
[16] DCCEEW, ‘NEM Review Draft Report – August 2025’, p. 10, https://consult.dcceew.gov.au/nem-review-draft-report-consultation#consultation-documents
[17] ACCC, ‘Inquiry into the National Electricity Market’, 2023, pp. 8, https://www.accc.gov.au/system/files/accc-inquiry-national-electricity-market-december-2023-report_0.pdf
[18] AER, ‘State of the energy market 2024’, 2024, pp. 29, https://www.aer.gov.au/system/files/2024-11/State%20of%20the%20energy%20market%202024.pdf
[19] AER, ‘Wholesale Market Monitoring and Reporting Guideline’, 2024, https://www.aer.gov.au/system/files/2024-11/AER%20Wholesale%20Market%20Monitoring%20and%20Reporting%20Guideline%20-%20Version%201%20-%205%20November%202024%2817486868.1%29.pdf
[20] ACCC, ‘Inquiry into the National Electricity Market report – December 2024’, 2024, pp. 70, https://www.accc.gov.au/system/files/accc-national-electricity-market-december-2024-report.pdf
[21] Ibid, pp. 68
[22] Ibid, pp. 70
[23] Albanese, Anthony, ‘Media release: Labor will ban supermarket price gouging in another move on cost of living’, 30/03/2025, https://anthonyalbanese.com.au/media-centre/labor-will-ban-supermarket-price-gouging-in-another-move-on-cost-of-living
[24] ABC News, ‘Supermarket ‘shrinkflation’ to be targeted through fairer, more comparable pricing rules’, 2/10/2024, https://www.abc.net.au/news/2024-10-02/supermarket-shrinkflation-rules-unit-pricing-code-change/104423774
[25] Packham, Colin, The Australian, ‘Chris Bowen’s default market offer crackdown will crush small energy retailers’, 18/6/25, https://www.theaustralian.com.au/business/chris-bowens-default-market-offer-crackdown-will-crush-small-energy-retailers/news-story/da1801c3dcd629a6e4f93011b09f1f8d
[26] AER, ‘AER – Final determination – Default market offer prices 2024-25’, 2024, pp. 65, https://www.aer.gov.au/system/files/2025-02/AER%20-%20Final%20determination%20-%20Default%20market%20offer%20prices%202024%E2%80%9325%20%28track-changed%20comparison%29%20-%207%20June%202024.pdf
[27] Ibid, pp. 74
[28] ACCC, ‘Inquiry into the National Electricity Market report – December 2024’, 2024, pp. 76, https://www.accc.gov.au/system/files/accc-national-electricity-market-december-2024-report.pdf
[29] AER, ‘Annual retail markets report 2023–24’, https://www.aer.gov.au/publications/reports/performance/annual-retail-markets-report-2023-24
AER, ‘Annual retail markets report 2020–21’, https://www.aer.gov.au/publications/reports/performance/annual-retail-markets-report-2020-21
Navigate to the ‘Charts and Data’ Excel files.
[30] Ausgrid, ‘Solar Home Electricity Data’, 2013, https://www.ausgrid.com.au/Industry/Our-Research/Data-to-share/Solar-home-electricity-data
[31] AEMO, ‘Aggregated price and demand data’, https://aemo.com.au/energy-systems/electricity/national-electricity-market-nem/data-nem/aggregated-data