Executive summary
- Australia’s Initial Teacher Education (ITE) sector has been under review for much of the past few decades — in large part due to persistent under-preparedness of graduates for the classroom.
- While Australia’s graduating teachers report that there is sufficient content overall in their degrees, they also report being less prepared for the classroom than in similar countries.
- This makes clear that ITE has a quality problem that requires solutions to improve the performance of training providers, culminating in the government-appointed Teacher Education Expert Panel (TEEP) recently making sweeping recommendations to improve the sector.
- Compared to school systems in the United Kingdom and United States, Australia’s policymakers are years behind in ITE reform efforts across a wide range of policy settings, including the content in ITE qualifications, the structure of the ITE market, financial incentives to support policy objectives, and enhancing the accountability of the ITE sector.
- It is necessary to raise performance and ITE outcomes for graduating teachers to be better prepared for the challenges of contemporary Australian classrooms.
- There is evidence the investment in effective ITE can deliver strong returns, because teacher preparation is highly formative in shaping early career development and effectiveness of graduate teachers.
- Teachers who start strongly in their careers contribute to better achievement of their students; while better preparation can alleviate some of the many pressures faced in early teaching careers.
- But reform directions in Australia have not always been targeted to the right places.
- Far too much emphasis has been placed on input-based approaches to ITE and too little on outcomes-based approaches.
- This has resulted in excess focus on regulating which students can enter ITE, without sufficient quality assurance of ITE providers to ensure that all potential teachers are given the training they require and deserve.
- There has been much debate about the undersupply of new teachers in Australia in recent years, including a lack of potential candidates starting teaching degrees. However, the data show the biggest problem is not a lack of potential teachers starting degrees, but a lack of those who finish them.
- Too many people drop out or don’t complete teaching degrees (among the lowest completion rates of all fields of study), especially at universities that enrol large proportions of students for online and/or part-time study.
- Even without policy intervention, there is expected to be a significant increase in the number of students entering ITE over the coming years — particularly domestic undergraduates. This is because the graduating class of Year 12 students entering post-school study will be much higher for several years, resulting from an above-trend number of births associated with the Australian government’s Baby Bonus initiative in the mid-2000s.
- As a result, there is little reason to believe that across-the-board financial incentives to enter ITE — at least for domestic undergraduates — are justified or strictly necessary as a strategy to increase teacher supply.
- Specific financial incentives targeted to in-demand fields of study and in-demand geographies could be worth further pursuing. However, decades of initiatives to date have failed to address these workforce challenges. One potentially effective approach is to offer phased bursaries for graduate teachers in in-demand fields. This would provide a salary supplement to trainee teachers, but is delayed into the early years of a graduate’s employment in the field. This may provide further incentive for in-demand trainee teachers to not only enrol in a teaching degree, but to enter and remain in the profession for at least their first few years.
- There is currently a relatively low utilisation of teaching degrees across Australia; meaning there are many adults with teaching degrees who do not currently work as teachers. Only a little over one-third of Australian adults with a post-school qualification in teacher education are currently working as a schoolteacher. Addressing supply challenges to the teacher workforce may be most fruitful if there is more successful re-integration of teaching-degree-qualified individuals into (or returning to) teaching careers.
- The content in many teaching degrees is regularly not aligned with evidence about best practice or current scientific knowledge about how students learn best.
- Recently proposed clarity for ITE providers concerning core content for programmes to include — such as essential knowledge about the scientific underpinning of much of human learning — should be welcomed.
- Ongoing monitoring of the content of ITE programmes could be best assured through direct inspections of programmes and greater longitudinal monitoring of the practices of graduate teachers during preservice training and once in-field.
- There is not consistent support in the partnership between ITE providers, host schools, and preservice teachers. The result is that many trainee teachers do not benefit from high-quality practicum placements in schools in this formative period in their preparation.
- There is little evidence to justify the market protections enjoyed by university teacher training providers. International experience in comparable education systems indicates that a more diverse pool of ITE providers could improve competition, the range of potential models for teacher preparation, and choice for trainee teachers.
- There are few quality markers in the accountability system for Australian ITE providers. There is significant opportunity for a robust and transparent performance reporting approach that could create incentives for providers to improve alignment with policy objectives and sector needs, as well as improve market signals for employers and preservice teachers.
Introduction
Initial teacher education (ITE) is responsible for providing beginning teachers with the knowledge, skills, and characteristics to prepare them for the classroom. Typically, ITE involves beginning teachers enrolling and completing an undergraduate or postgraduate degree at a university by an approved ITE provider. In an ITE course, preservice teachers complete a combination of courses that include pedagogical, subject matter, and — where applicable — subject-particular pedagogical knowledge. Enrolments are typically for either primary or secondary education.
As at 2019, there were 367 programs, 48 ITE providers, and 91 locations preparing around 92,000 enrolled ITE students across Australia. Teaching graduates typically complete a standalone Bachelor of Education, or complete an undergraduate degree followed by a teaching course. Others pursue two-year postgraduate teaching degrees, with 39% of graduating teachers having completed a postgraduate degree, while some jurisdictions permit partially shortened postgraduate qualifications.[1]
Over recent years, Australia’s ITE sector has been under near-constant review. At least in part, this has been due to persistent concern about the preparedness of graduate teachers,[2] along with broader challenges in ensuring there is a sufficient quantity and quality of graduates to meet workforce needs.
While it’s true that graduate teachers in all school systems are less effective when they first enter the workforce than they are a few years later, most enjoy a steep learning curve over their first few years in the classroom. Given that direct supervision of early career teachers is more limited than is typically observed in other professions, this requires considerable preparation for independent practice to be provided during initial training before entering the workplace.
Mitigating the ‘novice penalty’ of graduate teachers is an important opportunity to ensure better outcomes for students, as well as reducing the considerable pressure on teachers in their early years. Moreover, evidence shows that teachers who start out being relatively effective when they graduate become increasingly more effective over time.[3] [4]
Altogether, this makes raising classroom-readiness of teaching graduates a priority across school systems. But while this concern about classroom-readiness is a preoccupation of many countries’ ITE sectors,[5] there’s evidence that Australia’s school systems have particularly underperformed in this area,[6] especially in the formative area of classroom and behaviour management.[7]
Against this context, this paper provides a detailed analysis of Australia’s ITE sector’s current challenges and opportunities for reform. It starts with a review of the recent history and policy developments in Australia and comparable countries. It is then followed by analysis of the performance and structure of Australia’s ITE sector. In considering the ITE pipeline, it follows with assessment of the drivers of both the commencements to, and completions from, ITE qualifications. It then examines the current content of ITE qualifications and options for improving the accountability of Australia’s ITE providers. The paper concludes with recommendations for Australian policymakers in undertaking ITE sector reform.
Australian and international policy approaches to ITE reform
Previous reform efforts have focused on regulating ITE students by creating barriers to enter teaching.ITE has undergone a series of significant reforms over the past decade. Though much public debate has centred around supposedly loose entry standards to ITE (including scare campaigns that Australia’s prospective teachers have lower academic capabilities than similar countries), such concerns are typically overblown or misinterpreted.[8] [9] Indeed, rather than a need for additional regulation of ITE candidates,[10] there is now greater emphasis on reducing excessive barriers to enter the profession[11] and a recognition that greater quality assurance is instead required of ITE providers (rather than of ITE students). [12]
ITE reform efforts have typically focused on how to regulate who can enter ITE and meet accreditation standards. A major development in this process was the Teacher Education Ministerial Advisory Group (TEMAG) in 2014, which committed to improvement in five key areas:[13]
- stronger quality assurance of ITE programs;
- rigorous selection of entrants into initial teacher education;
- robust assessment of graduates;
- improved professional experience for pre-service teachers; and
- national research and workforce planning capabilities.
In 2015, the Australian government established the Literacy and Numeracy Test for Initial Teacher Education Students (LANTITE)[14] — introduced to ensure all beginning teachers meet the standard of achievement equivalent to the top 30% of the adult population. While most teachers successfully pass LANTITE (84 per cent), 11% fail to meet one of the standards and 5% meet neither. While LANTITE was introduced as a hurdle for teachers to complete prior to graduation, prospective ITE students can now undertake the test prior to commencing their studies.
Another reform initiative is focused on attracting ‘high-quality’ teacher candidates. In 2020, the High Achieving Teachers Program was introduced to offer alternative, including employment-based, pathways for individuals pursuing a career in education.[15] Further efforts are currently under consideration within the context of the National Teacher Workforce Action Plan (NTWAP).
Some measures within TEMAG specifically targeted the preparedness of ITE graduates. Teaching Performance Assessments (TPAs), introduced from 2019, are intended to assess ‘classroom readiness’ of preservice teachers. The TPA requires all pre-service teachers to demonstrate appropriate skills, knowledge, and practices prior to graduation.
Further, TEMAG, and the national accreditation requirements, set out an expectation that evidence should underpin the teaching practices taught within the ITE programs — though current national standards and procedures provide only a broad direction for quality teaching (such as demonstrating expert content knowledge and pedagogical content knowledge), without a specific articulation of what effective pedagogical approaches entail.[16]
Independent reviews have supported the case for focusing on reform of ITE providers rather than students, and focused on increasing rather than limiting the number of new teachers
The recent reform process led by successive Australian governments has been generally in line with calls from other stakeholders to focus on raising the practice of providers more clearly in the ITE market.
A 2021 CIS analysis found little evidence that ITE providers were providing sufficient coverage of evidence-based practice through their preparation programs — including some examples of apparent efforts to promote approaches that are unaligned with current evidence and standards of practice. Further, a 2022 CIS report identified significant opportunity to improve preparation of new teachers through extending and better coordinating school-based practicum during training, especially by enabling trainees to commence within their first year — a recommendation subsequently endorsed by the NSW government.
Finally, a late 2022 CIS report recommended the reintroduction of the one-year Graduate Diploma of Education as an alternative postgraduate pathway into the teaching profession — which was similarly endorsed by the then NSW government and in 2023 the Australian government had commissioned the Australian Institute for Teaching and School Leadership (AITSL) to assess the feasibility of a change to accredited ITE qualifications to enable widespread recognition of a one-year Masters program..
The Productivity Commission’s review of the National School Reform Agreement in early 2023 argued that there are better potential outcomes for policymakers in seeking to improve the quality of ITE than further efforts to screen for ‘high-quality’ candidates, and that the quality of TPAs would require monitoring from policymakers to ensure that this initiative successfully raises standards of classroom-readiness among new graduates.[17] And a 2023 NSW Productivity Commission report identified significant impediments to the number of graduating teachers resulting from added regulatory burdens placed on those completing postgraduate degrees.[18]
International reform provides a potential pathway for Australian policymakers
Australia is not alone in undertaking a series of reviews into the sector, and in seeing ITE reform as core to improving outcomes across the wider teaching profession.
In the United Kingdom, then Secretary of State for Education, Michael Gove, initiated a wide-ranging series of ITE reforms from 2014, including appointing Sir Andrew Carter to chair an independent review of ITT courses. The subsequent 2015 Carter Review of Initial Teacher Training (ITT) found considerable variability in ITT content and preparedness of graduate teachers. Among its recommendations was to clearly establish a shared understanding about standards and expectations from ITE. A subsequent working group developed a core content framework for ITT to provide clearer guidance to providers and to assist quality assurance measures (including to guide inspections from the Office for Standards in Education, Children’s Services and Skills (OFSTED)) and allocation of ITT student places.
The ITT core content framework (CCF) was bolstered by the introduction of an Early Career Framework (ECF) and reforms within the ITT marketplace. These reforms aimed to diversify teacher training pathways and providers, streamline the consumer experience, and implement quality assurance measures such as a robust inspection and rating system for ITT providers. To consolidate the ITT core content, OFSTED inspections include a set of indicators that measure the alignment of ITT providers with the core content — helping ensure consistency in providers’ understanding of the content and the delivery to trainee teachers.
In the United States, system accountability is established under Title II of the Higher Education Act, which requires states — as a condition of receiving federal funding — to submit data to the federal Department of Education; including with significant initiatives from the Obama administration. This data collection supports state and overall program-type comparisons against high-level performance statistics. An annual report published by the Department of Education provides national and state reporting of performance of teacher preparation providers, including enrolment statistics, graduate numbers, and credentialling exam pass rates. States are also required to identify programs determined to be low-performing or at risk of being classified as low-performing.
In addition to federal reform, additional grassroots and industry leaders have contributed toward improvement in ITE practice and accountability.
The National Council on Teacher Quality (NCTQ) — a non-profit, non-partisan organisation established in 2000 — has provided repositories of data that benchmark the performance of states and ITE providers across the nation. Its Teacher Prep Review, in particular, provides a comprehensive dataset on ITE programs including program practices, down to the course level, on a range of factors associated with classroom-readiness.
Leading educators, including the Deans for Impact and the Council of Chief State School Officers —which established the Network for Transforming Educator Preparation (NTEP) — have also made significant contributions in advancing outcomes-based accountability across the sector.
More recent reform now focuses on regulating ITE providers rather than ITE students
In 2021, the Australian government initiated a new Quality Initial Teacher Education (QITE) Review, with a two-fold focus: first, better attracting and selecting high quality candidates into teaching, and second, better preparing graduates to be more effective teachers.
Its report, handed down in 2022, provided further evidence that the ITE sector is not sufficiently meeting the needs of graduate teachers, especially in providing training in evidence-based reading practices and in classroom management. It also identified opportunities to improve the moderation, comparability, and standard-setting of TPAs.
Most importantly, the QITE review highlighted the need for reform of policy settings of ITE providers, particularly in strengthening the link between performance and funding of ITE providers, including by:
- establishing a national body or expert group to advise on how ITE Commonwealth-supported places (CSPs) should be allocated amongst higher education providers, based on quality and other relevant factors;
- developing a quality measure for ITE courses that enables performance-based assessments of ITE programs and assists in student choice;
- rewarding those providers who score highly on the measure;
- increasing transparency by making publicly available information on how each higher education provider scores on the quality measure;
- allocating CSPs based on ITE performance; and
- tendering a portion of CSPs to higher education providers that meet specific program criteria.
It also recommended establishing an ITE Centre for Excellence to deliver high-quality, evidence-based ITE and support research into best-practice teacher preparation. Similarly, a 2021 NSW Productivity Commission White Paper recommended a public-facing Centre for Teaching Excellence within the NSW Department of Education, to be led by a new Commissioner for Teaching Excellence.[19]
In response to the QITE review, a new Teacher Education Expert Panel (TEEP) was appointed to identify potential quality measures for ITE providers and how policymakers could better provide quality assurance within the sector. Its terms of reference requested the TEEP to report to policymakers in mid-2023 on reform options to:
- Strengthen the link between performance and funding of ITE;
- Strengthen ITE programs to deliver confident, effective, classroom ready graduates;
- Improve the quality of practical experience in teaching; and
- Improve postgraduate initial teacher education for mid-career entrants.
In early 2023, the TEEP circulated its discussion paper, that provides ambitious scope for reform against each of these items, including proposing:
- Potential core content for ITE programs (specifically focused on a combination of essential concepts including: the brain and learning; effective pedagogical practices; classroom management; and enabling factors for learning);
- Indicative potential performance indicators for ITE providers (including: selection of ITE candidates against workforce needs; retention rates of students; classroom-readiness of graduates; and the post-graduation outcomes of graduates);
- Improved role for, and coordination of, practical experience during ITE (with more comprehensive partnership agreements, a national framework for high-quality placement approaches, and encouraging centres of excellence); and
- Greater pathways to teaching for mid-career entrants (including a shortened 12–18-month Master’s program, more flexible ITE delivery, and models of best practice).
At the 2023 federal budget, the Australian government further pledged to introduce more teaching places, including up to 5,000 bursaries of $10,000 per year to students with an ATAR of 80 or above who undertake a teaching degree in an 8-year funding package, a 5-year investment in the High Achieving Teachers program to support an additional 1,500 high achieving professionals to transition into teaching through employment-based pathways, and implementation of QITE review recommendations to improve teacher training in classroom management and phonics.
The TEEP handed down their final report in July 2023 and Australia’s education ministers agreed in principle to its recommendations. A wide range of proposals were recommended, spanning: the strengthening of ITE programs; drawing a stronger link between performance and funding in ITE; improving practical teaching experience; and enhancing postgraduate ITE programs for mid-career entrants. Significant reform directions include revising new national standards and accreditation of ITE programs by the end of 2023, with the integration of new content in ITE degrees to be embedded by the end of 2025, to be monitored by a new ITE quality assurance board.
The performance of the ITE sector
Available international comparisons show that Australian graduate teachers are less prepared than their peers in similar countries, across nearly every measure.[20] Compared to high-performing countries, the greatest gaps in teacher preparedness are related to the categories of student behaviour and classroom management, and monitoring students’ development and learning.
Moreover, Australian teachers today report being less prepared than in recent years — with significant declines observed in international survey data between 2013 and 2018 in teachers’ reported preparedness with respect to subject content, subject pedagogy, and subject practice.[21]

Source: OECD TALIS 2018. In this context, high-performing countries refers to Singapore/Japan/Taiwan.
Disappointingly low levels of classroom-readiness of ITE graduates have been observed despite international comparisons showing that Australian ITE covers a relatively large amount of content and is of a longer duration than similar systems, increased public spending on ITE (with annual taxpayer funding per full-time equivalent student in Education degrees reported at $17,944; in excess of reported costs to provide tuition of $15,312),[22] and more stringent regulatory standards on who can enter ITE and become an accredited teacher.
Yet, compared to other fields of study in higher education in Australia, ITE students generally report a similar experience and graduating outcomes. According to the Student Experience Survey,[23] overall satisfaction is similar or slightly higher among ITE students than students from other fields (77% vs 73% among undergraduate students, 72% vs 73% among postgraduate students), although learner engagement — that is, interactions with staff and other students — is typically lower in some programs (48% vs 49% undergraduate, 32% vs 42% postgraduate). At the same time, the Employer Satisfaction Survey[24] shows similar employer satisfaction is 86% for education graduates, compared to 84% for all graduates. Finally, the Graduate Outcomes Survey[25] shows graduate salaries in education are on average higher than other fields among undergraduates ($72k vs $68k), but slightly lower among postgraduates ($89k vs $92k).
However, it is not clear that current broad-based indicators used across the wider higher education settings are fit-for-purpose for ITE specifically — particularly given the unique implications associated with teacher preparation (including the need that graduates possess not only general skills, but specific vocational skills in order to be classroom-ready at graduation and to achieve accreditation). In common with many other school systems, that has meant additional considerations may be needed for monitoring student experiences, graduate outcomes, and the like, for ITE. To an extent, the Australian Institute for Teaching and School Leadership’s (AITSL) Australian Teacher Workforce Data (ATWD) has offered some related key metrics over recent years — though these displays currently largely aggregate existing data collections.
Concurrently, researchers and policymakers have increased their emphasis on outcomes-based data that may help inform ITE program design.[26] [27] [28] [29] This is contrasted with decades of emphasis that has been placed on both the structural inputs to ITE (such as the number of content-area courses, pedagogical courses, and student teaching hours that may inform teachers’ potential preparation) and teacher inputs (particularly teachers’ academic capabilities, dispositions, and the like).
The structure of the ITE market
The ITE market in Australia is relatively complex — in part because it is governed across both state and federal governments.
The suppliers of ITE are accredited providers —mostly universities, along with some non-university higher education providers — who are regulated and funded by the federal government, while the governance of ITE is largely a shared, intergovernmental responsibility.
While the Australian Institute for Teaching and School Leadership (AITSL) sets national ITE accreditation standards,[30] each state or territory’s Teacher Regulatory Authority (TRA)[31] ultimately decides which ITE programs are recognised within their jurisdiction. At present, each of these TRAs (for example, NESA[32] in NSW or VIT[33] in Victoria) has adopted AITSL’s national standards, while in some cases supplementing them with their own additional requirements, such as minimum school grades for entry into ITE courses.[34] [35]
The supply of ITE is dominated by a small number of university providers
ITE enrolments in Australia are clustered within a relatively small number of university providers. Ten universities make up nearly half the enrolments in education degrees. Regional universities account for nearly one in five (19%) enrolments, the Group of Eight universities account for nearly one in eight (12%), with the remaining two-thirds in non-Go8 metropolitan universities.
Universities enjoy near-monopoly provider status. Non-universities and private universities account for less than 1% of enrolments.[36] This monopoly status is because regulation limits competition through imposing barriers to other providers from potentially providing approved teacher preparation qualifications.
Unequal approaches to funding can further limit the role of non-university providers. For instance, until 2023,[37] Alphacrucis College, a non-university higher education provider, was unable to offer Commonwealth Supported Places in teaching degrees,[38] [39] despite comparable outcomes in completions and student satisfaction to university ITE providers.[40]
There is relatively little product differentiation for consumers in Australian ITE markets
The ITE offers available to prospective students in Australia are relatively limited. Whilst there has been some recent policy attention and university administrators’ effort to respond to market needs, almost all ITE students complete a ‘traditional’ university-based-credentialling pathway.
Alternative pathways into teaching exist at many universities and tend to be defined by some shared characteristics, including abbreviated preparation in terms of content, methods, and program duration. However, the proportion of teaching places made up of flexible and non-traditional pathways are much smaller than in English and United States school systems.
In the US, around one in five graduating teachers (and around one in three ITE providers) undertake an alternative route in ITE (though many are engaged with a higher education provider for at least some of the content of their program). [41] [42] Comprehensive data collection is made by each ITE provider and is collated in annual public reporting to the federal government that clearly indicates the number of students enrolled in traditional and non-traditional ITE programs (and the relative outcomes of ITE students, as discussed later in this paper).
In the English school system, there are a range of alternative options available to prospective teachers — with multiple and differentiated pathways to acquire Qualified Teacher Status (QTS), if providers meet the standards set out by the National Professional Qualifications (NPQs).
Over recent decades, English ITE has evolved from being an essentially centrally-managed, university-led system, toward a supply-side, devolved and more locally responsive model — a consequence of which has been greater local decision-making on the number of teachers needed in each area.[43] Particularly since 2010, there has been increased school involvement in trainee recruitment and training delivery, with ITE students increasingly becoming accredited through school-centred initial teacher training partnerships (SCITT; designed and delivered by groups of schools that have been given government approval to run their own ITT), or as a delivery partner of an accredited provider through a School Direct partnership (designed by schools in partnership with a university). Courses generally last for one academic year full-time and result in QTS. Many also award a Postgraduate Certificate in Education (PGCE) from a university. Unlike Australia’s ITE market that is mostly made up of undergraduates (more than two-thirds of enrolments), 80% of English ITT students are enrolled in postgraduate programmes of study, with more than half of these enrolled in school-led pathways.
Teaching graduates are as well or better prepared for teaching from non-traditional training pathways
A significant segment of teacher preparation research — particularly in the US (but also to a lesser extent in the UK)[44] — has focused on between-programme outcomes for graduates of traditional and non-traditional programs (a broad range of routes to teaching generally for candidates who already have an undergraduate qualification and/or some prior work experience, but did not earn an education degree or complete a teacher preparation program), especially the Teach for America program (and in more recent years, also forms of primarily school-based training programs, among others).[45]
The research shows no consistent evidence that traditional ITE programs are more effective than non-traditional training pathways,[46] [47] [48] while growing evidence leans toward some preparedness advantages for those in non-traditional programs.[49] [50] [51] [52]
While critics of alternative certification pathways have correctly highlighted that teachers from some non-traditional pathways can be more likely to leave teaching sooner than those from traditional ITE programs,[53] [54] this can be overstated and is largely explained by differences in teacher and school characteristics (namely because Teach for America graduates, in particular, are disproportionately likely to work in especially challenging schools in which attrition is already higher than in less challenging environments).[55] [56] [57] Moreover, recent international research that assesses both the costs of lower retention and the short- and longer-run performance advantages of TFA graduates concludes that the performance advantage is sufficient to offset turnover costs. [58]
There has been relative success, in particular, in recruiting and preparing mathematics teachers through non-traditional pathways.[59] [60] [61] [62] This has been partly attributed to these graduates entering with additional subject matter expertise,[63] coming from a generally more diverse population than from traditional ITE programs, and disproportionately work in hard-to-service schools.[64] [65] There is also evidence STEM teachers in fast-tracked programs score higher on practical versus theoretical approaches to teaching and demonstrate a more realistic idea of how to measure success in high‐needs classrooms.[66] They also are found to better promote students’ mathematical interest[67] and students taught by TFA math teachers go on to have higher grades in math courses and are less likely to miss school due to being absent or suspended.[68]
Entry to the ITE pipeline
Despite some concern about a modest decline in new ITE commencements of recent years — particularly as observed in 2018 and 2019 — the number of potential teachers starting the ITE pipeline has since more than recovered. In 2021, the number of commencing ITE students (31,338) was just short of the peak number set in 2017 (31,532) and around 10% higher than the average number of commencements over the previous 15 years (28,401).
Previously, it was noted that the temporary decrease in ITE commencements is mainly linked to a smaller cohort of Australian year 12 completers, who are the potential university enrolees. This decrease can be attributed to a demographic trend of delayed births before the introduction of the Australian government’s Baby Bonus initiative in the mid-2000s.
While the ITE sector overall has generally been able to meet the demand of systems’ overall number of teachers (available data shows that entrants to teaching comfortably exceed exits), it’s also true that there have been ongoing challenges in meeting the need for more diverse cohorts of populations in teaching, and to ensure that some discipline-specialisations are met.
As part of the QITE review,[69] the Behavioural Economics Team of the Australian Government (BETA) surveyed nearly 1,500 professionals not currently enrolled in ITE, to quantify various options for incentives. BETA found that most mid-career professionals underestimated the duration of an ITE degree, were concerned about its length, and that a condensed one-year ITE course was as attractive as a $20,000 increase in top pay, “…suggesting there is significant value attached to shortening the time spent out of the workforce for mid-career changers.”[70]
Financial incentives to enter teaching can be inefficient, unless cleverly designed
A key recommendation of Australia’s National Teacher Workforce Action Plan (NTWAP) [71] (and recent Australian government commitments) has been to attract more people into ITE degrees, through a range of measures including additional Commonwealth Supported Places, and bursaries to attract high-achievers and mid-career professionals. In addition to this, in recent years, the then Australian government introduced its Jobs Ready Graduates reforms that have resulted in significant reductions (around 42%) to the tuition fees for ITE students through a reallocation of Commonwealth subsidies. This is despite some NSW Audit Office evidence that incentive schemes — particularly scholarships — had largely been ineffective in meaningfully boosting the supply of in-demand teachers.[72]
Some international evidence suggests that bursaries can result in an increase in ITE applications.[73] For instance, analysis in England estimates that an increase of £1,000 in bursary value resulted in a 2.9 per cent increase in applications. [74] Yet, it has been noticed that certain bursaries might have been inefficiently used by offering financial incentives to candidates who would have chosen teaching regardless. Additionally, some bursaries encouraged ITE training without necessarily increasing recruitment and placement into teaching positions.[75] Other analysis in the Australian context has generally been sceptical about the efficiency and outcomes from financial incentives — particularly scholarships — intended to attract and retain teachers. [76]
In more recent years, English policymakers have also introduced a ‘phased bursary’ for in-demand maths and science teachers — meaning, in effect, a deferred financial incentive that is paid to graduates as a salary supplement (equivalent to around an 8% pay increase) in their first few years of teaching. This has also been extended with a Phased Maths Bursary (PMB) that pays an additional £5,000 or more to eligible maths teachers in the third and fifth years of their career. At least in part, this approach is intended to support STEM graduates and mid-career-changers, who often face a salary gap in teaching compared to the wider labour market opportunities.
There is some evidence to suggest the phased bursary approach has assisted in not only attracting, but also retaining, maths and science teachers. Furthermore, policy evaluations show that the increased investment in targeted salary supplements for early career teachers is justified by reduced attrition. The cost per additional teacher retained through this policy is 32% lower than training an equivalent replacement teacher.[77]
Similar analysis in the US indicates that a one-off salary bonus for hard-to-staff teaching graduates is more cost-effective than incentives from loan forgiveness.[78] Other studies suggest that while bonus payments for in-demand maths teachers can reduce attrition for early career teachers, there is little increase in the likelihood of potential maths-specialist ITE students to start teaching degrees. [79]
Within the context of Australia’s income-contingent loan system for higher education, it is unlikely that incentives in the form of tuition fee reduction or loan forgiveness would produce any meaningful improvement in the supply of ITE students or in-field teachers. To this end, Australian research shows the behavioural effects of tuition fee reductions are typically minimal[80] — finding there is a low elasticity of demand to price in Australia’s university education system.
A favourable demographic outlook means that there will be more students entering ITE in coming years irrespective of policy intervention
The increase in the birth rate associated with the Baby Bonus (commencing in 2004) is likely to significantly improve the incoming teacher pipeline. The Baby Bonus increased the number of annual births from around 252,000 per year in the 10 years prior to introduction, to around 291,000 in the 10 years from its introduction — an annual increase of around 16%. Children born since the introduction of this scheme are now approaching school-leaving age.
Each year, around 8% of children who were born in Australia 18 years earlier start an undergraduate ITE degree. Whilst the lagged number of births is not an ideal measure for generating projections about future entrants to ITE degrees (partly because not everyone who is born 18 years prior goes to on to complete Year 12, many may not remain in Australia, and there are additional entrants through net migration, and not all undergraduate ITE entrants come directly from school to university, and not all ITE commencements are domestic students), there is a degree of consistency in this measurement over time. Namely, because it produces similar estimates to other potential proxies, such as the number of 18-year-olds in Australia in each year (the number of whom equates to around 7% of those who commence an ITE degree) and the number of students enrolled in Year 12 of schooling (the number of students in Year 12 one year prior is around 9% of the number of undergraduate ITE commencements in the following year).
Taking the long-run association between the proportion of Year 12 completers from the lagged births into the coming years, there is reason to be very optimistic about the number of students entering post-school education, and ITE in particular.
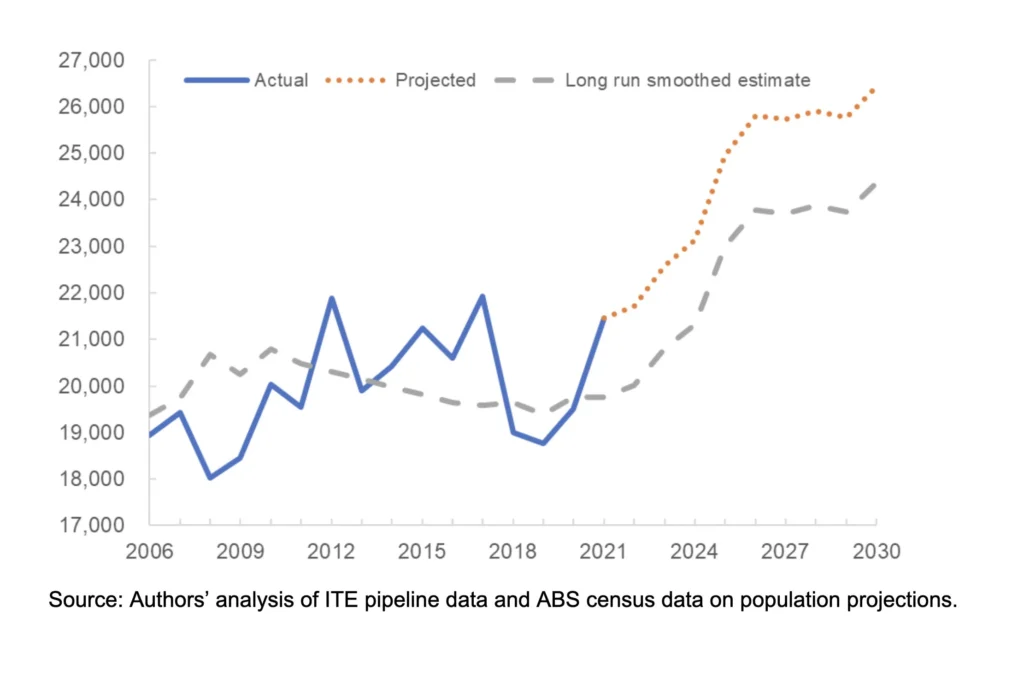
For instance, if the same proportion of the birth cohort who graduated Year 12 in 2020 (entering ITE in 2021) was replicated over the forward years, this would result in over 26,000 annual ITE commencements in 2030. Between 2006 and 2016, the number of annual commencements increased by around 9%, but between 2016 and 2026, this would be estimated to be around 25% — or around 5,200 commencing ITE students per year. Even on a more modest estimate — based on the long-run proportion of Australian-born children who go on to start an ITE degree — the annual number of commencing ITE students from 2016 to 2026 would be around 16% higher, or around 3,800 more commencing ITE students per year.
ITE commencements are projected to increase markedly over the next decade.
AVERAGE ANNUAL UNDERGRADUATE ITE COMMENCEMENTS, ACTUALS 2006 TO 2021, PROJECTED 2022 TO 2030 (BASED ON REGISTERED BIRTHS IN AUSTRALIA 18 YEARS PRIOR).
Graduates from the ITE pipeline
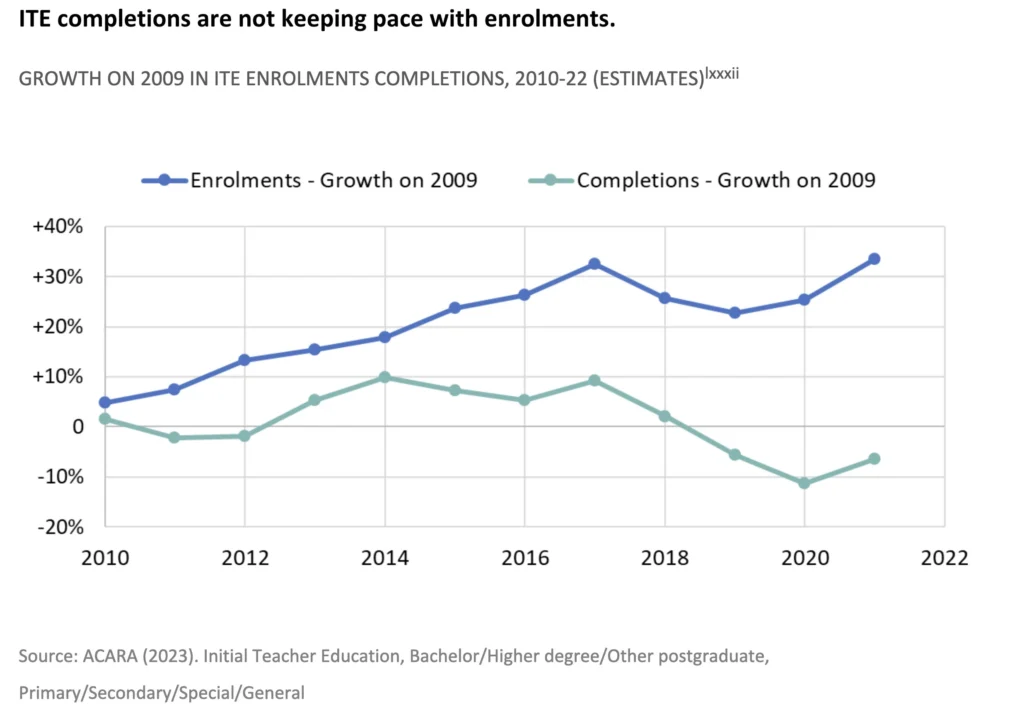
More concerning for the ITE pipeline is not necessarily a decline in the number of students starting ITE degrees, but the declining share of those who are finishing them. Since 2009, annual enrolments have grown but completions have flatlined.[81] (Reference for graph below [82]
Policy attention has focused on increasing entrants to ITE rather than graduations from ITE
Despite the emphasis on attracting potential teachers through financial incentives and other schemes, there has been insufficient attention paid to addressing poor overall completion rates of ITE degrees. While the number of students starting an ITE degree has been growing, the number of students finishing an ITE degree has been far less steady. Thus, the natural priority for policymakers should lie in helping more students finish an ITE degree, rather than only in encouraging more to begin one.
Within ITE degrees, worrying trends are present in both completion rates (the share of commencing students who finish a degree), and attrition rates (the share of commencing students who drop out of their degree entirely, without switching to a different course or provider). Attrition rates are the most common measure used for assessing university performance in this area, with a six-year rate typically used for undergraduates, and a four-year rate used for postgraduates.
Of note, among TEQSA’s responsibilities, is ensuring higher education admission processes are rigorous, and that “The higher education provider is able to demonstrate appropriate progression and completion rates…”.[83] Yet, despite the crisis of attrition in education degrees — where some programs have attrition rates above 50% — it does not appear that ITE providers have been sufficiently corrected in this regard.
Improvements in ITE completion can significantly improve the teacher pipeline
While the problem of student attrition is found across many fields of study in Australian universities, it is particularly severe within education. Only a little over half of domestic students who enrol in an undergraduate ITE degree go on to complete it within six years.
Differences in completion rates can have a significant impact on the incoming teacher pipeline. For instance, if the same proportion of domestic undergraduates who completed their degrees within six years was replicated for the 2016 cohort, there would have been more than 4,800 domestic ITE undergraduates completing their degrees by the end of 2021. Since around three-quarters of ITE graduates are working in schools in the year following graduating, this suggests that a higher ITE domestic undergraduate completion rate (of around 70%, as it was in 2005) could have resulted in around an additional 3,300 graduate teachers (from domestic undergraduate degrees) in 2022 alone (equivalent to close to 1% of the overall teacher workforce).
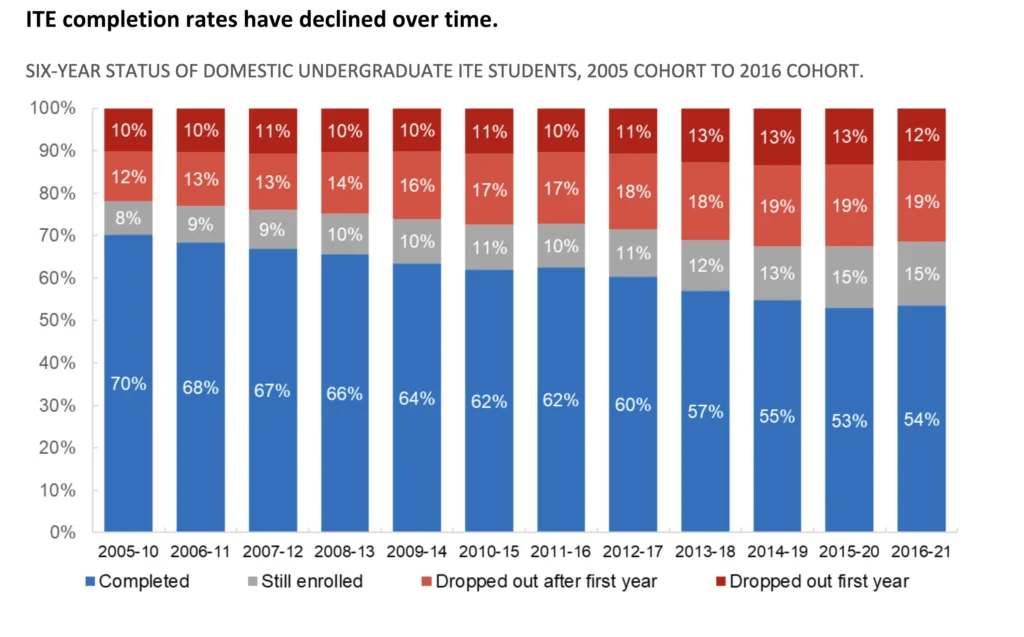
Source: Department of Education, 2022. Domestic only
Teaching degrees have higher attrition than similar degrees
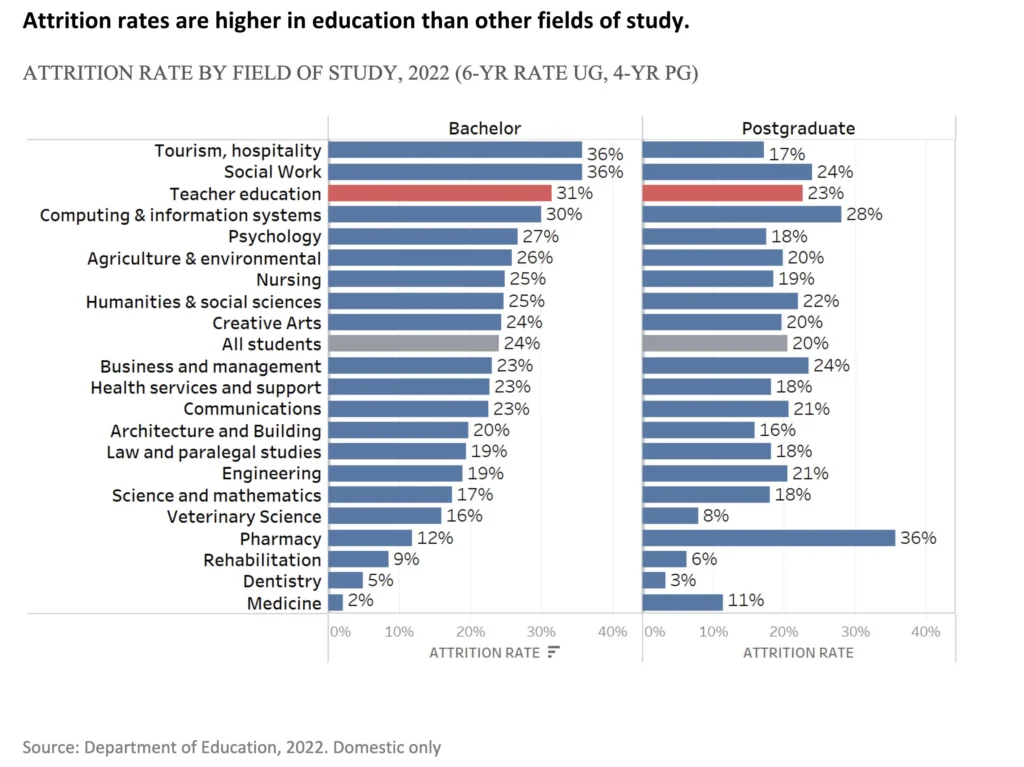
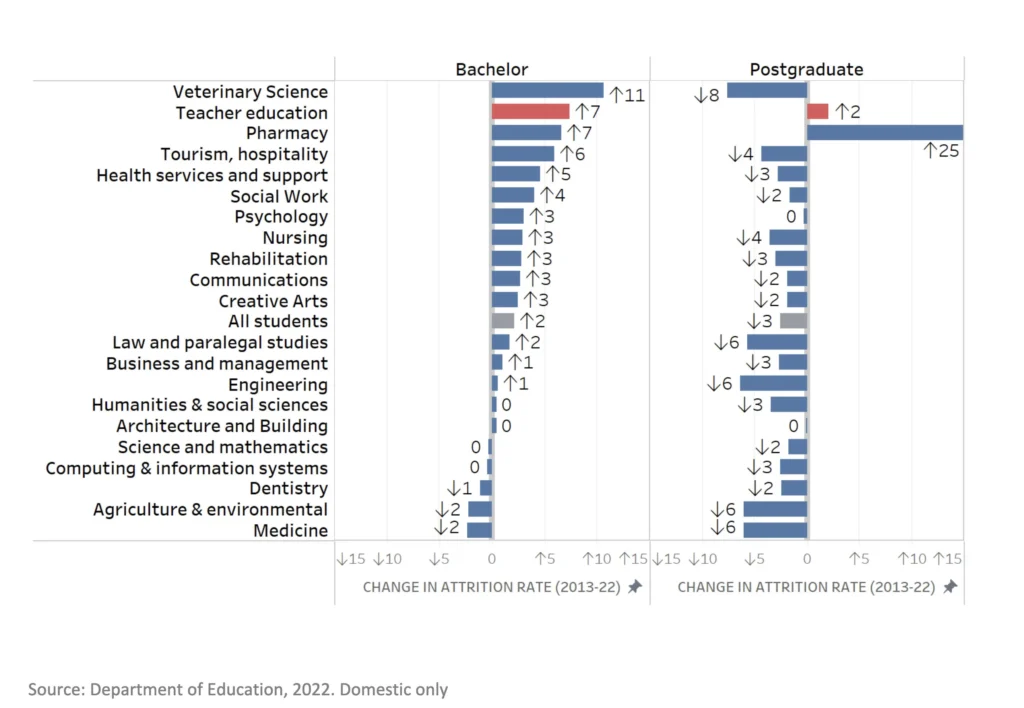
Attritions are much higher in education degrees than other fields of study. Education is ranked third out of 21 study areas for attritions among undergraduate students, and fifth out of 21 among postgraduate students.[84]
Moreover, over the last decade, attritions have risen faster in education than nearly any other study area — the third largest increase across all 21 study areas.
Among undergraduate students, attrition rates in education have increased by 7 percentage points since 2014, compared to 2 pts across all fields of study.[85] Among postgraduate students, attrition rates in education have increased by 2 percentage points since 2014, compared to a decrease of 3 pts across all fields of study.[86]
Attrition rates have risen more in education than in nearly any other field of study.
CHANGE IN ATTRITION RATE BY FIELD OF STUDY, 2013-22 (6-YR RATE UG, 4-YR PG)
This decade-long rise in attritions has occurred across most ITE providers; in around 22 of 33 undergraduate teaching programs, and in around 16 of 34 postgraduate teaching programs.
Over the last decade, attrition rates for education degrees have increased in nearly all universities
CHANGE IN EDUCATION DEGREE ATTRITION RATES BY UNIVERSITY, LEVEL, 2013-22 (6-YR RATE UG, 4-YR PG)

Source: Department of Education, 2022. Domestic only
ITE attrition is a problem for some, but not most, universities
While there is substantial public discourse on the problem of attrition in teaching degrees, the focus has been on systemic factors (issues across all universities) rather than local factors (issues in specific universities). This focus is misguided, as a deeper look at available data shows that the problem of attrition is more localised than it is systemic.
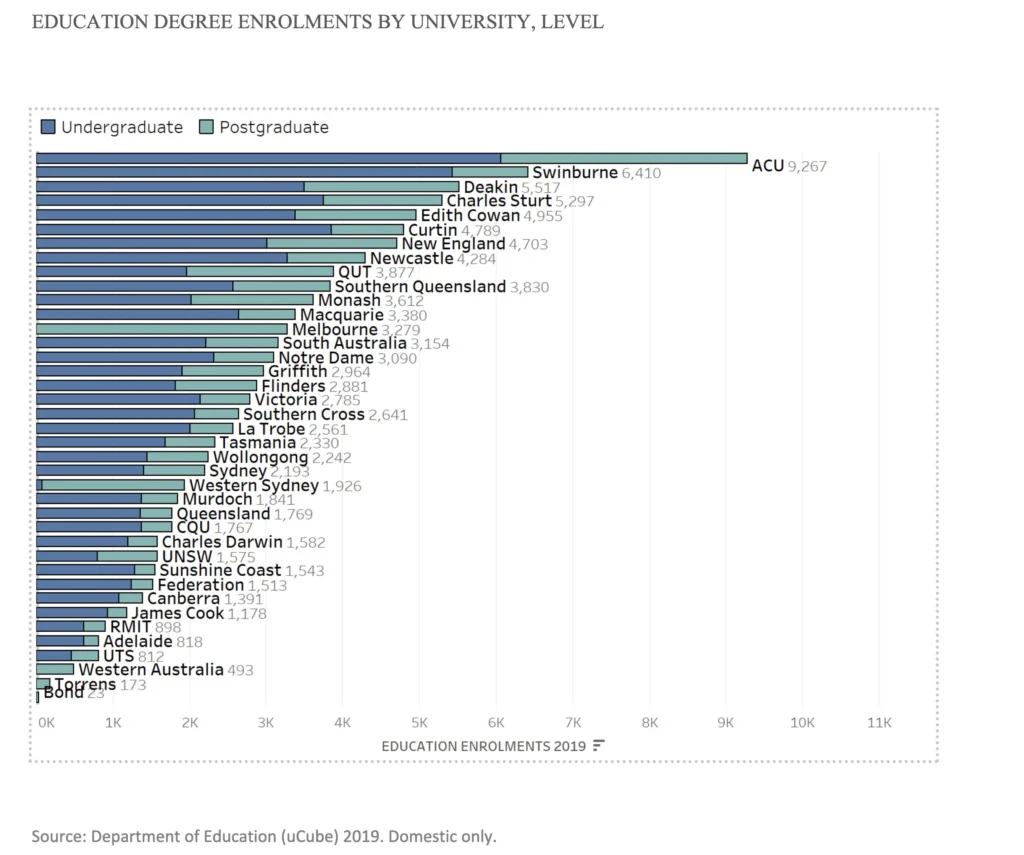
To begin with, enrolments in education degrees are much higher in some universities than others. Just 10 of the 39 universities offering education degrees make up nearly half (48%) of all enrolments.[87]
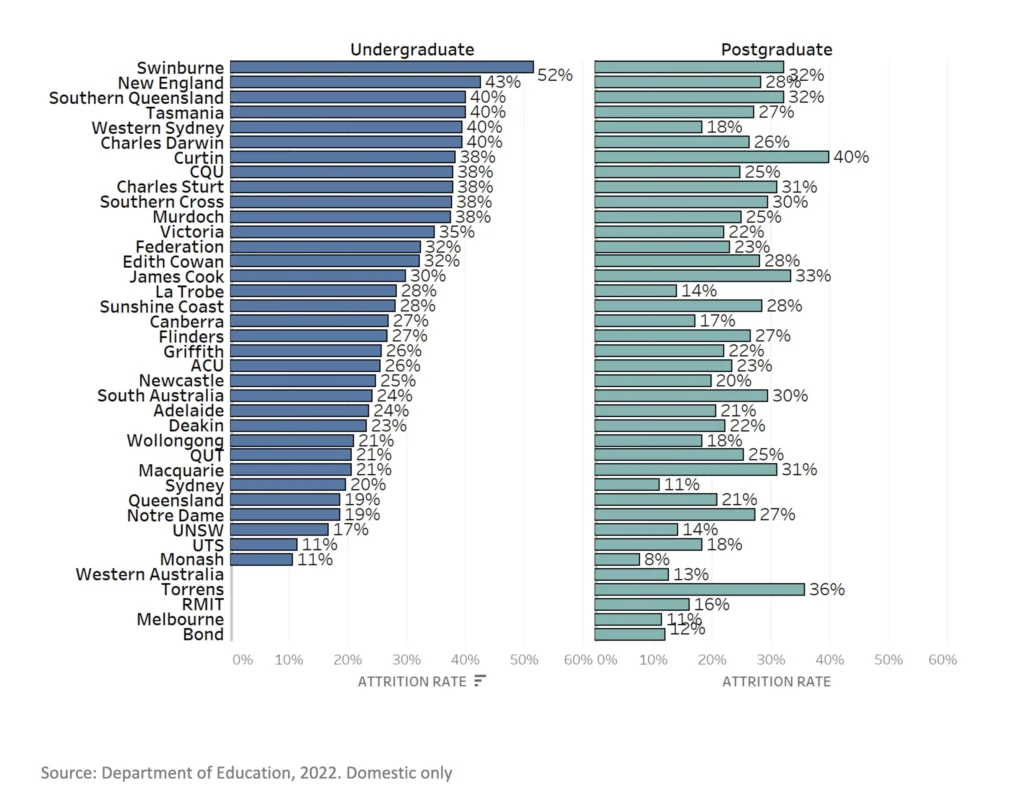
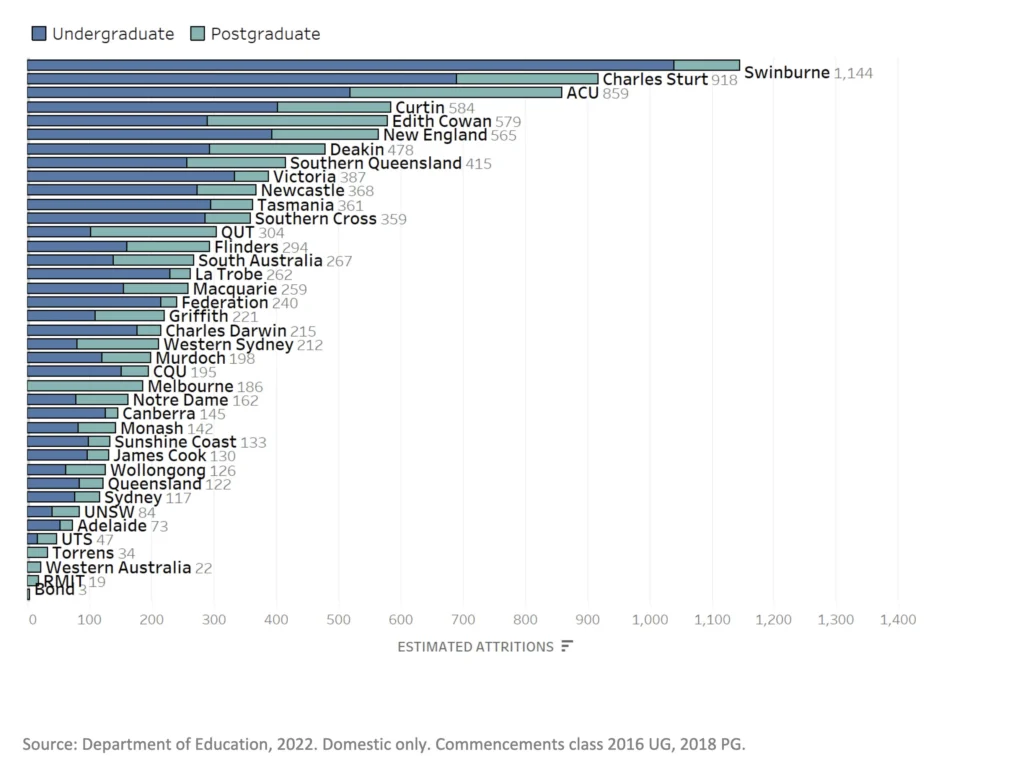
Furthermore, attrition rates in education degrees also vary substantially among universities; ranging from 11% to 52% in undergraduate courses, and 8% to 40% in postgraduate courses.[88] Just eight universities account for more than half of all attritions in education degrees — 5,500 of the 11,000 attritions each year.
Clearly, the problem of attrition is more localised within these eight universities, than systemic across all 39 providers. Even for those students who do succeed in graduating, this problem of attrition will have flow-on effects. Employer reputations are lower for those universities with higher attritions; in statistical terms, employer reputations can explain around half of the variation in attrition rates between ITE providers.[89]
Ten universities make up nearly half of enrolments in education degrees.
Attrition rates for education degrees vary substantially by university.
EDUCATION DEGREE ATTRITION RATES BY UNIVERSITY, LEVEL, IN 2022 (6-YEAR RATE UG, 4-YEAR PG)
Eight universities account for half the attritions in education degrees.
ESTIMATED EDUCATION DEGREE ATTRITIONS BY UNIVERSITY, LEVEL, IN 2022 (6-YEAR RATE UG, 4-YEAR PG)
Higher attrition rates are associated with weaker reputations among employers.
ATTRITION RATE VS EMPLOYER REPUTATION IN EDUCATION (QS) BY UNIVERSITY, LEVEL (6-YR UG, 4-YR PG)

How students study, not just what they study, impacts attrition rates
The eight universities with particularly high attritions are distinctive for the typical study loads and study modes of their education students, who are much more likely to be studying online or part-time than their peers in other universities.
It is already known that those who study online or off-campus (‘external’) or part-time are much more likely to drop out of university, across all fields of study. Indeed, among domestic undergraduate students, external or part-time students are more likely to drop out than finish a degree.
Six-year attrition rates for undergraduate students are 44% for external students compared to 21% for internal, and 44% for part-time students compared to 20% for full-time. For postgraduate students, the equivalent four-year attrition rates are 28% for external students (vs 15% internal), and 28% for part-time students (vs 11% full-time).
Thus, external study and part-time study are among the very highest of risk factors for attrition. It is therefore not surprising that those ITE providers with high attrition rates tend to have extremely high rates of external and part-time study. Study mode (internal vs external) explains around half (47%) the variation between ITE providers in attrition rates, and study load (full-time vs part-time) explains more than half (53%).
Across all fields of study, the most common reasons cited by students for considering early departure are health or stress, study / life balance, workload difficulties, and expectations not being met.[90] For those students who dropped out, Cherastidtham’s and Norton’s 2018 survey found almost 40% regretted beginning their degree, and almost two-thirds believed they would have been better off if they had finished.[91]
Stress, balance, and workload are the most common reasons for potential attritions.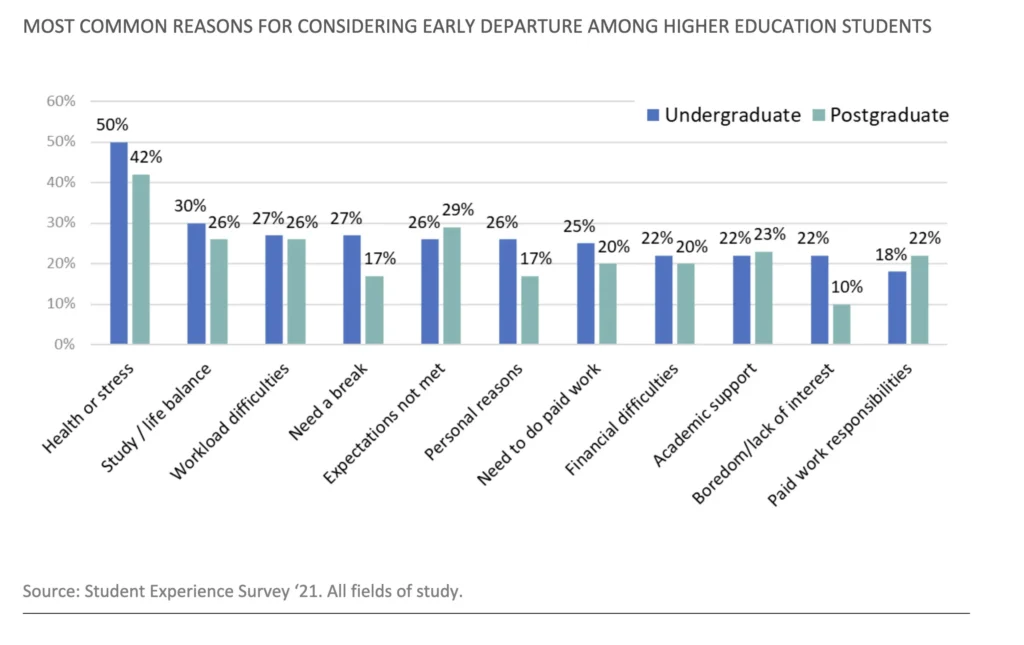
Australia has particularly high rates of part-time study among tertiary students — the fourth-highest in the OECD, at 38%, compared to the OECD average of 21%.[92] While increasing flexibility for students, it also more than doubles their risk of attrition.[93]
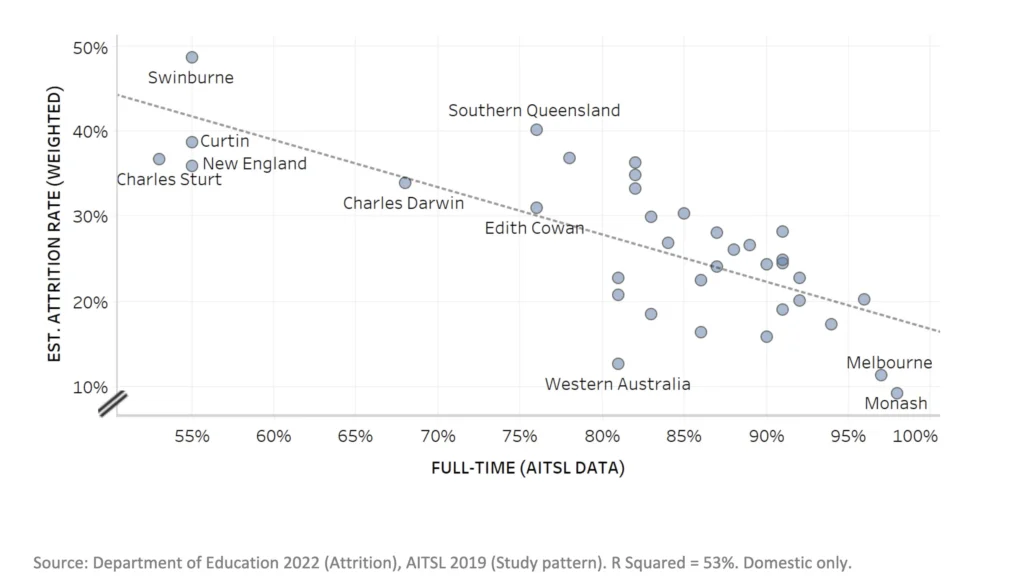
Study load explains the majority of variation between universities in attrition rates.
ATTRITION RATE VS FULL-TIME STUDY IN EDUCATION DEGREES BY UNIVERSITY, LEVEL (6-YR UG, 4-YR PG)
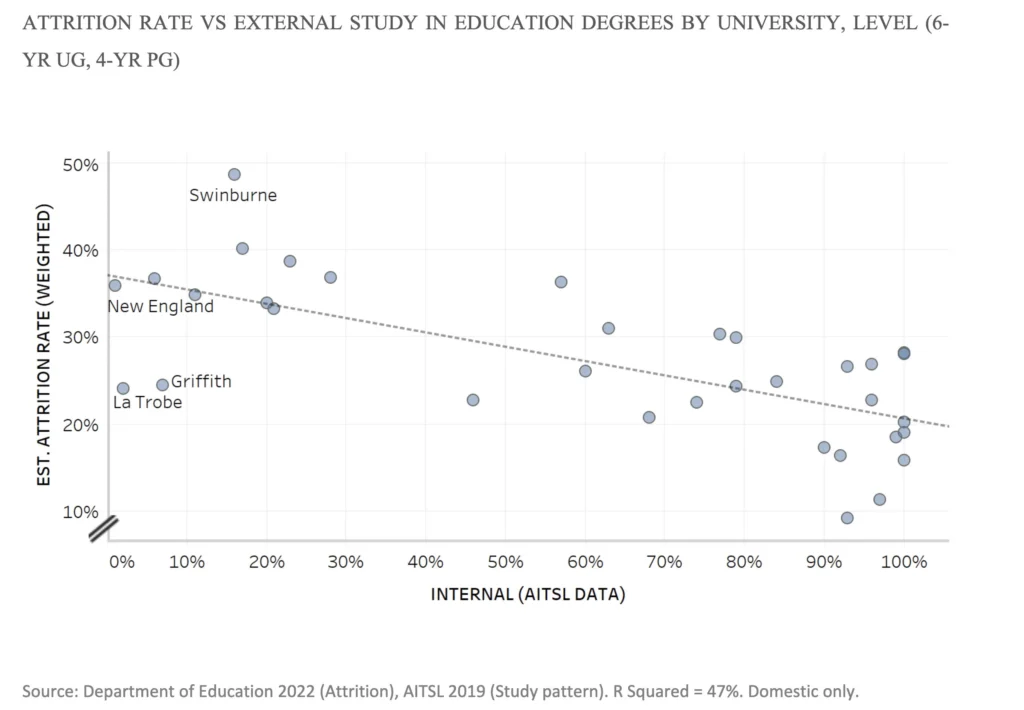
Study mode explains half the variation between universities in attrition rates.
How engaged students are impacts attrition rates
The rationale for this association is intuitive. Learner engagement (as measured in the Student Experience Survey) is typically much lower for those students studying externally, less than half that of those studying on-campus.[94] Thus, it is not surprising that among ITE providers learner engagement is substantially correlated with attrition.[95] Education typically has lower learner engagement than other fields of study — 48% vs 49% among undergraduate students, and 32% vs 42% among postgraduate students.
Higher Learner Engagement is associated with fewer attritions in education degrees.

In summary, evidence suggests the attrition crisis in education degrees is not systemic across universities, but rather is localised to a small subset. Attritions are concentrated within a small cluster of universities, characterised by their high shares of students studying part-time or off-campus. Indeed, just eight universities account for more than half of all attritions, and the share of students studying part-time explains more than half the variation in attrition between universities.
It follows that among the various policy responses being considered, a key focus should be reducing the rates of external and part-time study in education degrees. While not a simple endeavour, even small improvements would have significant benefits. Assuming the attrition rate of part-time students is twice that of full-time students for each ITE provider, if the part-time study rate could be halved, that would reduce attritions by 18%, or lead to nearly 2,000 extra graduations a year.[96]
The number and distribution of ITE graduates
The teacher workforce is growing at a historically fast pace and is meeting medium-term demand
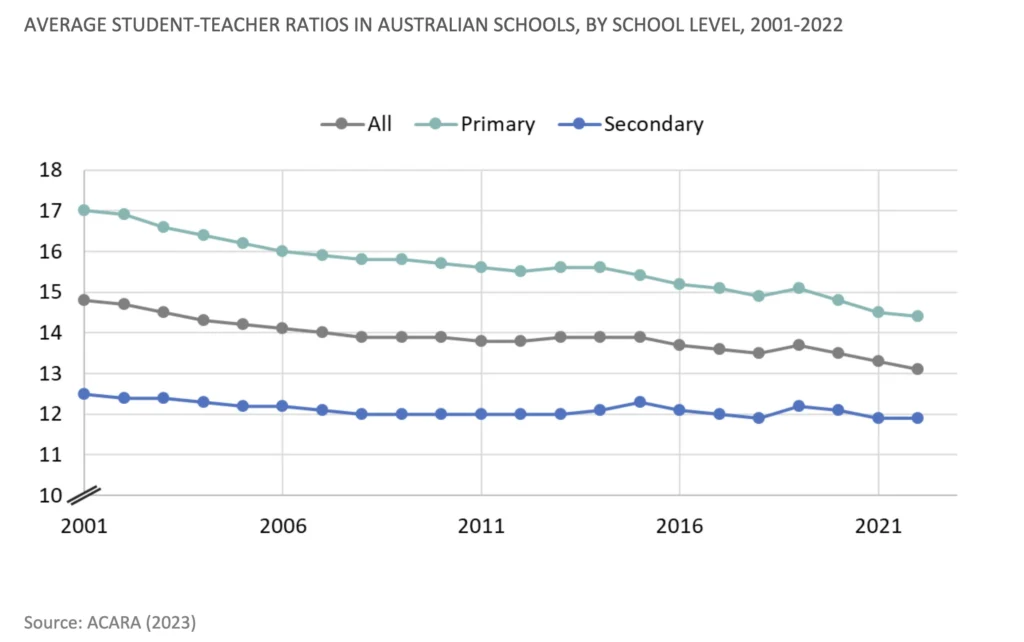
Despite there being greater numbers of teachers in school systems now than ever before (in 2022 there was 38% more full-time-equivalent teachers in Australia than in 2001), declining student-teacher ratios (reduced by 13% from 2001 to 2022) have contributed to increased demand for teachers — requiring more teachers to commence, and importantly, complete ITE.
Over the past several years there has been a rise in the number of vacancies in the workforce (and widely reported teacher shortages).[97] Namely, through the period of the Covid-19 pandemic and aftermath, there was a spike in schoolteacher vacancies (cumulatively, 84% from 2020 to 2020). However, this increase is less than the relative increase in vacancies across the wider economy over the same period (cumulatively, a 107% increase) and is similar to the increase across all professional occupations (an 80% increase).[98] In other words, the spike in teacher vacancies cannot be viewed in isolation of an overall historically-tight macroeconomic labour market (with overall economy vacancies in 2022 in line with the previous peak observed in 2008; a period in which teacher vacancies remained modest) than specific teacher labour market dynamics alone.
While the demand placed on the teaching profession from student enrolments has been mild in recent years — in part thanks to reduced immigration during the Covid-19 pandemic and falling fertility rates over the past decade or so — a return to higher immigration may place upward pressure on teacher demand in future years. Moreover, since around 5% of the teacher workforce exits the profession each year, this further adds to the demand for teachers in the ITE pipeline — though this is typically more than accommodated for by the number of new ITE graduates.[99]
Notwithstanding this, there is little reason to believe the number of teachers in the workforce is at significant risk into the medium term. Between 2021 and 2026, Jobs and Skills Australia estimates Australia will require around a cumulative 9.4% increase in school teachers over five years (itself an upper bound estimate, as it was made prior to the impact of Covid-19 on significantly slowing population demand).[100] While this has created some panic among policymakers and other stakeholders,[101] this pace of increase is actually slower than the current rate of growth in the workforce. Between 2016 and 2021, the number of teachers increased by nearly 12% and around 10% in full-time equivalent terms. In other words, the total size of the teacher workforce is currently meeting the pace required to meet medium term demand.
The teaching workforce has been growing on a headcount and on an FTE basis.
FIVE-YEARLY GROWTH RATE OF THE AUSTRALIAN TEACHER WORKFORCE (TOTAL HEADCOUNT AND FULL-TIME EQUIVALENT), 2001 TO 2021.

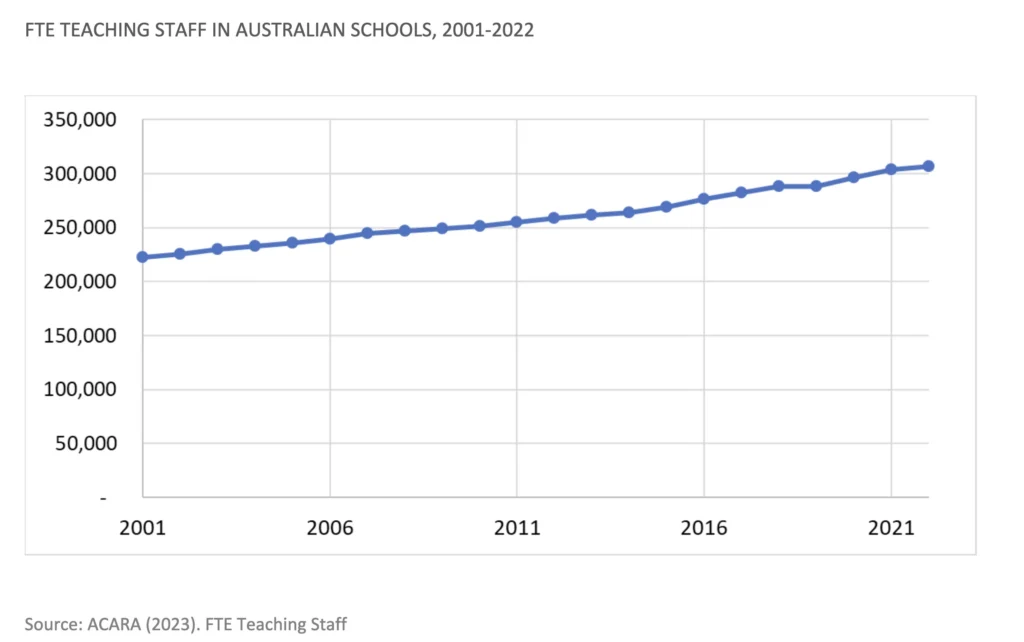
Source: ACARA (2023). FTE Teaching Staff
The number of teaching staff has grown steadily over the last two decades.
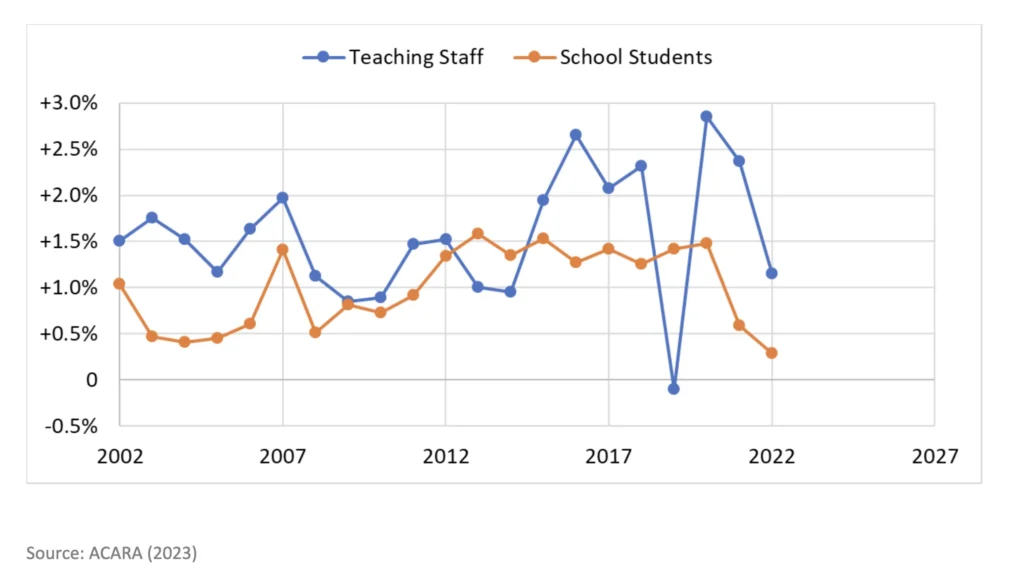
Growth in teaching staff has outpaced growth in students in 18 of the last 21 years.
ANNUAL FTE TEACHING STAFF & SCHOOL STUDENTS IN AUSTRALIAN SCHOOLS, 2002-2022
Student-teacher ratios have been falling over the last two decades.
There is significant variation in the distribution of teachers and potential teachers
Apart from the overall number of teachers within a school system, it is important there is a geographic matching of available teachers to fill positions in the locations in which these positions are available. There is, however, significant variation in the availability of teachers (relative to the student-age population) across Australia’s geography.
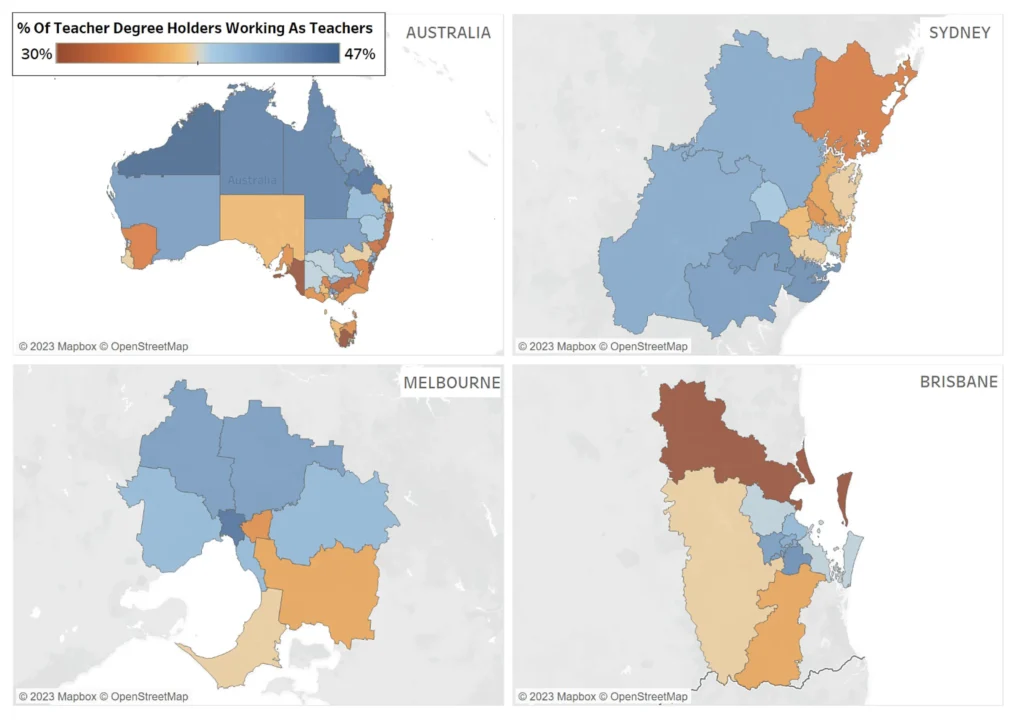
While there is greater availability in metropolitan areas, compared to regional and remote areas, this is not as clear cut as it may seem. For instance, there is far greater availability of teachers in many parts of regional New South Wales and Victoria than there is in the regional areas of other states and territories. In addition, within some metropolitan areas of Sydney and Melbourne, teachers can be less available than in some regional areas. Moreover, within a given city, there can be wide differences in teacher availability — there are nearly twice as many available teachers living in Sydney’s Outer West and Blue Mountains than in the neighbouring area of Sydney’s Blacktown (with a similar disparity between inner Melbourne and Western Suburbs of Melbourne). Across metropolitan areas, much of Brisbane shows generally poorer availability of teachers than in Sydney and Melbourne.
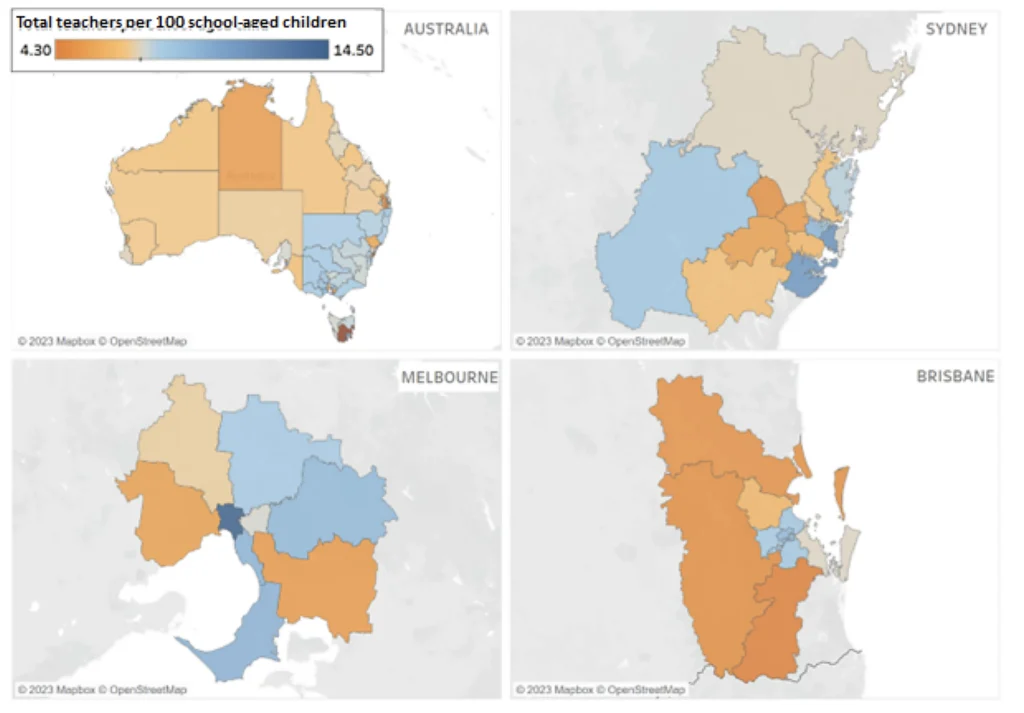
Source: Australian Bureau of Statistics Census data
There is a modest correlation between the availability of teachers and the socio-economic status of a geographical region. Namely, more disadvantaged areas generally have lower availability of teachers. However, even compared to areas with similarly disadvantaged populations, the outer suburbs of Brisbane, in particular, house relatively few teachers. Several areas where the availability of teachers is relatively high — even compared to similarly advantaged areas — include the inner suburbs of Sydney and Melbourne, and the Southern coastal suburbs of Sydney within the Sutherland region.
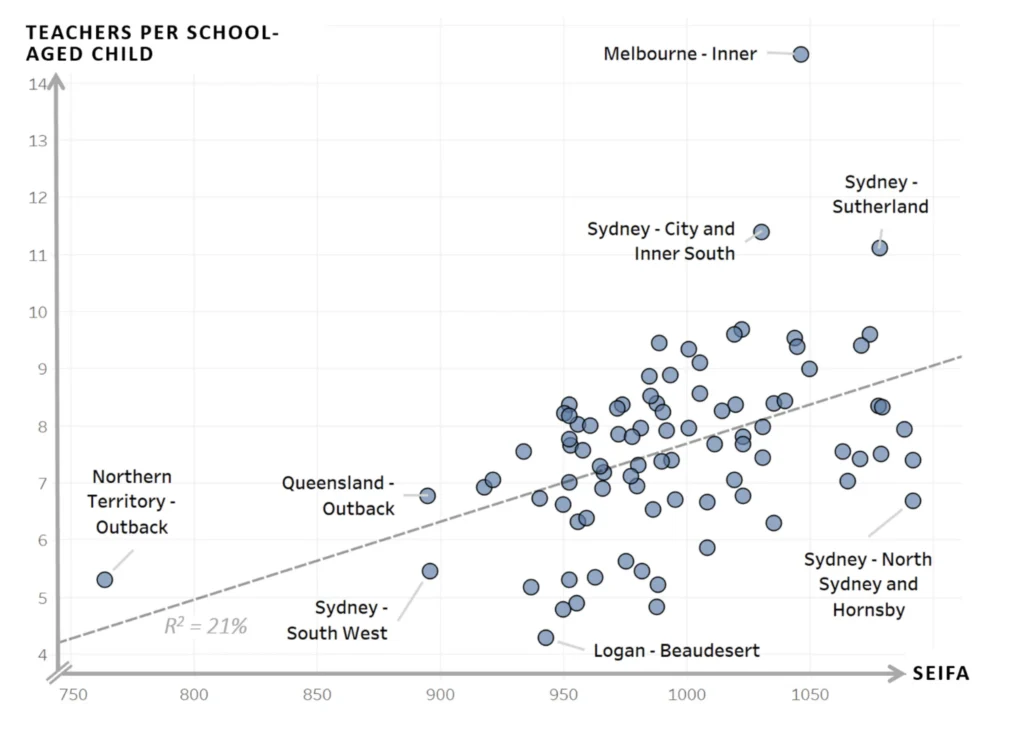
Source: Australian Bureau of Statistics Census data
Finally, maximising the potential teacher supply requires utilising the existing population who hold teacher education qualifications, but are not currently employed as teachers. In school systems where there is a relatively high proportion of degree holders currently working as teachers (high utilisation), this indicates there may be strong incentives for qualified teachers to actively work in the field (and vice versa). Low utilisation indicates geographical areas in which there is a relatively high latent supply of potential teachers, who may be suitable candidates for school systems to attempt to re-integrate into the teaching workforce.
Existing degree holders in the population can indicate potential supply of teachers who could fill vacancies, with only a limited time lag (at least compared with those who would need to proceed through formal qualifications and training before attempting accreditation).
Source: Australian Bureau of Statistics Census data
The content of ITE degrees
Much of the interest of researchers and policymakers in ITE has focused on what and how much content should be contained in qualifying certifications. This has typically been at relatively high level, too — broadly considering the relative weight to be placed on subject area content knowledge, general pedagogical knowledge, and subject-specific pedagogical knowledge — with emphasis on the instructional hours on each of these components. In part, this is because tracking hours and course compositions is a relatively observable and tangible feature of ITE, compared to more complex teacher preparation issues. To this end, a longer ITE programme has typically been considered a proxy for a programme’s rigour and standards.
Though international comparative data show that graduates in Australia report that content, pedagogy, and classroom practice are sufficiently contained in their ITE qualifications, they also report being relatively unprepared for the classroom across many relevant areas. This suggests that issues in ITE may be more related to quality, rather than quantity of content.
To this end, Australia’s TEEP has provided advice on amending ITE accreditation standards to better align with evidence-based practices and demand for classroom-readiness. Its report recommended guidance toward an ITE core content, including four categories: the brain and learning; effective pedagogical practices; classroom management; and enabling factors for learning.
Australia’s ITE accreditation is focused on quantity rather than quality of ITE content
ITE content is monitored and regulated by a range of federal- and state-based entities, including the Australian Institute for Teaching and School Leadership (AITSL), Tertiary Education Quality and Standards Agency (TEQSA),[102] and each state or territory’s Teacher Regulatory Authority (TRA). This regulation extends to the content, number of instructional hours, and assessment, for each ITE program.
Accredited ITE programs have mandatory content requirements to meet, based on the amount of coursework programs require ITE students to complete. For instance, at least half of the duration of a primary school teachers’ undergraduate qualification must be made up of “discipline and discipline-specific curriculum and pedagogical studies”, with the remaining duration of study for extension or specialist studies in areas of the institution’s interest.
However, there is little direct guidance to ITE providers concerning what content is most valued by employers or most closely aligned with expectations for evidence-based teaching practices of graduates. A clear contrast can be made, in particular, with the English system’s ITT Core Content Framework which makes an explicit link to the expectations for graduates to ‘learn that …’ (theory) and ‘learn how to’ (practice). Moreover, this framework provides clear connexion of teaching practices to a supporting science-informed evidence base.
In addition, Australia’s systems are not currently as clear as they could be in establishing a potential ITE curriculum model. For instance, the English approach effectively covers three core aspects, which help inform a set of curriculum indicators used by inspectors in assessing (as discussed further in the Accountability section of this report):
- learning to teach (generic pedagogy, including adaptive teaching and classroom management);
- learning to teach a subject (subject knowledge, subject pedagogies and curriculum); and
- learning to be a teacher (professional behaviours and values).
More and longer ITE can contribute to more confident and knowledgeable graduates, but does not necessarily result in better prepared teachers
It is a plausible expectation that more and longer ITE content may promote better preparedness of teachers — because presumably, with more study comes more knowledge about teaching, and with this better in-field practice.
However, many studies have examined teachers with additional years of study — including postgraduate qualifications — and found no difference in effectiveness compared with other graduate teachers.[103] [104] [105] [106] Similarly, while graduate teachers who have completed more preparation coursework tend to report feeling better prepared to teach, there’s little evidence they are in fact more instructionally effective; whether measured by classroom observations or student achievement.[107] [108] [109] [110]
There is also limited evidence that quantity of general coursework requirements alone during ITE predicts teachers’ effectiveness either[111] [112] — at best operating as a floor with respect to a minimum expected level of knowledge.[113] [114] [115] [116] This is further complicated because some research indicates that the content and knowledge relationship is better attributed not to the number of courses taken by ITE students, but to their achievement (such as their university course grades) in this coursework.[117]
By and large, while there is a broad consensus that there is an important role for graduate teachers to possess both strong content knowledge[118] [119] (a body of conceptual and factual knowledge) and pedagogical content knowledge[120] (understanding of how learners acquire knowledge in a given subject), there are few evidence-based conclusions about how teacher preparation programs can most effectively develop those characteristics.[121]
More subject content knowledge, especially in mathematics, is related to early career effectiveness
Teachers with a mathematics qualification,[122] [123] and those who have completed mathematics content at university,[124] [125] have been found to record higher achievement with their students. There is also evidence that teachers’ specialised mathematical knowledge and skills in teaching mathematics are positively associated with gains in students’ mathematical achievement.[126] [127] [128] [129]
Some research suggests that mathematics teachers with specialist mathematical knowledge provide greater instructional clarity in explaining the process of solving problems presented in classrooms.[130] [131] [132] There is also evidence that specialised mathematical content and teaching methods is beneficial for preservice primary school teachers.[133] Moreover, there’s some evidence professional development focused on helping teachers gain understanding of mathematics content and pedagogy[134] can significantly impact on student achievement.[135] Other research shows that teachers need sufficient content knowledge before effectively translating pedagogical knowledge.[136]
ITE degrees do not consistently provide a scientific understanding of how students learn and how to demonstrate science-informed teaching approaches
For many years, educationalists have disputed the fundamental grounding of the study of education. Historically, understanding about education was determined largely by philosophical theories, particularly inquiring abstractly about the nature and pursuit of knowledge and consciousness. However, over the past half century, there have been substantial increases in understanding about education that have been made possible through a science-informed approach.
The fields of educational psychology and evolutionary psychology have enabled an understanding about human cognitive architecture and implications for the nature of learning. Arguably the most important findings for education are ‘cognitive load theory’ and related research explaining limitations in presenting new information in educational settings. Another key distinction is between biologically primary information (naturally and unconsciously acquired over centuries) and biologically secondary information (culturally important but requires conscious effort to learn).
Cognitive science has further added to this through incorporating modelling of cognitive processes, particularly in terms of information processing, perception, attention, and memory studies. In addition, educational neuroscience has enabled some complementary understandings for educational purposes — including localisation studies, which identify brain locations associated with cognitive processes.
The resulting emphasis of the science-informed approach to education is essentially a growing understanding of learning and cognition that can be applied to approaches to teaching and self-study. The emergent interdisciplinary field of ‘the science of learning’ sits at the nexus of cognitive science, educational psychology, educational neuroscience, pedagogy (including assessment and instructional design), as well as fields as diverse as linguistics and artificial intelligence systems.[137]
Despite these important developments, it is not clear that Australian ITE providers — or university-based education research academics — adequately reflect current science-informed evidence consistently in courses available to trainee teachers. Several Australian studies have indicated little or no alignment between ITE offerings and evidence-based teaching practices.
In a study of 116 literacy units in 66 ITE degrees across 38 universities, one report found only 4% of ITE programs had a specific focus on early literacy and reading instruction. The vast majority allocated insufficient time and coursework to pedagogical strategies, leaving a substantial gap between knowledge and teaching in practice. Moreover, the review found that most commonly prescribed textbooks in ITE programs often failed to provide information on effective, evidence-based pedagogy. In particular, content rarely specified five core elements of reading instruction: phonemic awareness; phonics; fluency; vocabulary; and comprehension.
And a 2021 CIS analysis of 90 mathematics units from the Bachelor of Education (Primary) courses of 31 universities found there is virtually no evidence of ITE where explicit instruction is clearly emphasised. Of those universities, 27 clearly emphasise constructivist approaches, while 4 are either ambiguous or emphasise a range of teaching approaches. No mathematics units from any of the universities in the analysis appear to have a clear emphasis on explicit instruction.
A forthcoming CIS paper will provide evidence that many practicing teachers report ITE did not provide them with sufficient evidence-based practices, and in some cases promoted alternatives they later found to be ineffective or not aligned with scientifically-informed practice. In addition, the paper will show teachers reflected positively from gaining an understanding of, in particular, the popular ‘Rosenshine’s Principles of Instruction’ and the implications of cognitive load theory for classroom instruction.
The recommended components of ITE mathematics education from the 2021 CIS study areas include:
An effective Primary ITE program would provide a graduate teacher with at least one unit dedicated to explicit instruction in the context of mathematics, and provide the tools to design and deliver curriculum and explicit instruction lessons that manage cognitive load and embed knowledge in students’ long-term memories using strategies that are aligned with current evidence. Content that would support beginning teachers to implement explicit instruction includes:
- Cognitive Load Theory and its applications.
- Strategies for gaining, maintaining and focusing student attention during whole-class instruction (e.g., choral response, student whiteboards, pair share).
- Questioning and checking for understanding.
- Explicit lesson design, including the use of worked examples.
- Strategies to facilitate spaced retrieval practice (e.g., Daily Review, Warm Ups).
- Practice breaking down complex skills into smaller instructional units.
The quality of education faculty research is not currently associated with more or better prepared teachers
An implied assumption of education policymakers is that the better the quality of research within ITE faculties, the better the quality of teaching — the so-called “research-teaching nexus”.[138] Available data implies this is not necessarily the case.
Generally put, Australia’s education research is usually not of particularly high quality by world standards, despite a research income of at least $77 million each year.[139] Although Australia has some high-performing universities in education research (seven are ranked within the top 100 worldwide),[140] the sector’s research in education is rated lower than in other fields.
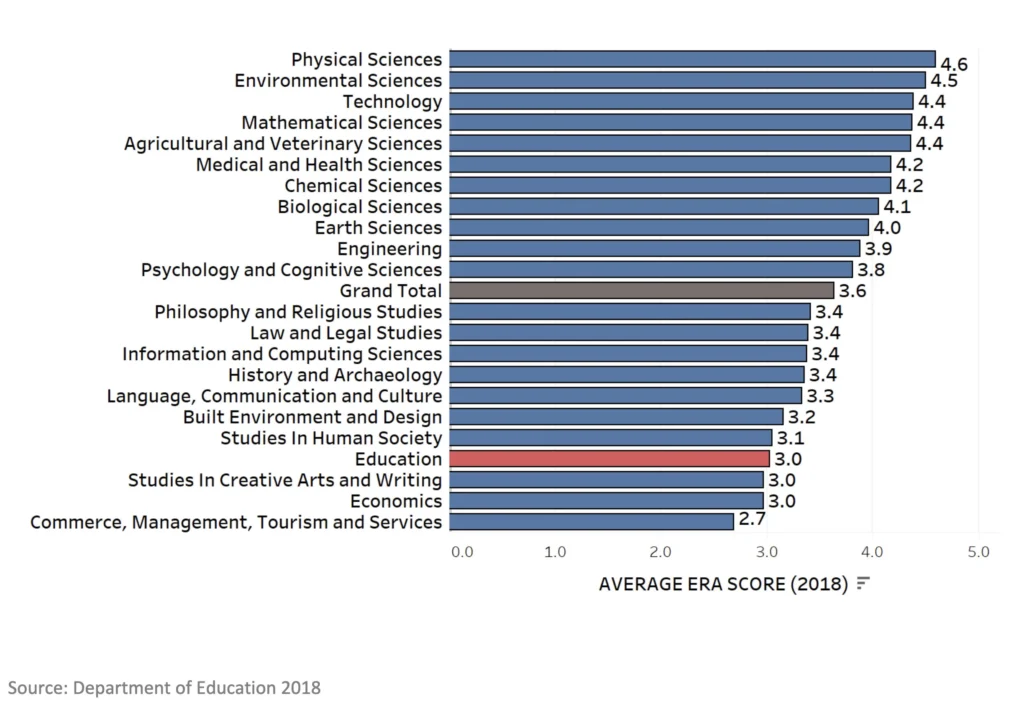
According to the latest Excellence in Research Australia (ERA)[141] scores, a measure of research quality produced by the Australian Research Council, is ranked 18th of 22 fields of research within Australian universities. Its average ERA score is 3.0 (“at world standard” rating), compared to the average across all fields of 3.6 (closest to “above world standard” rating).
Seven Australian universities are ranked within the top 100 in education.
QS RANKING 2023 IN EDUCATION OF AUSTRALIAN UNIVERSITIES
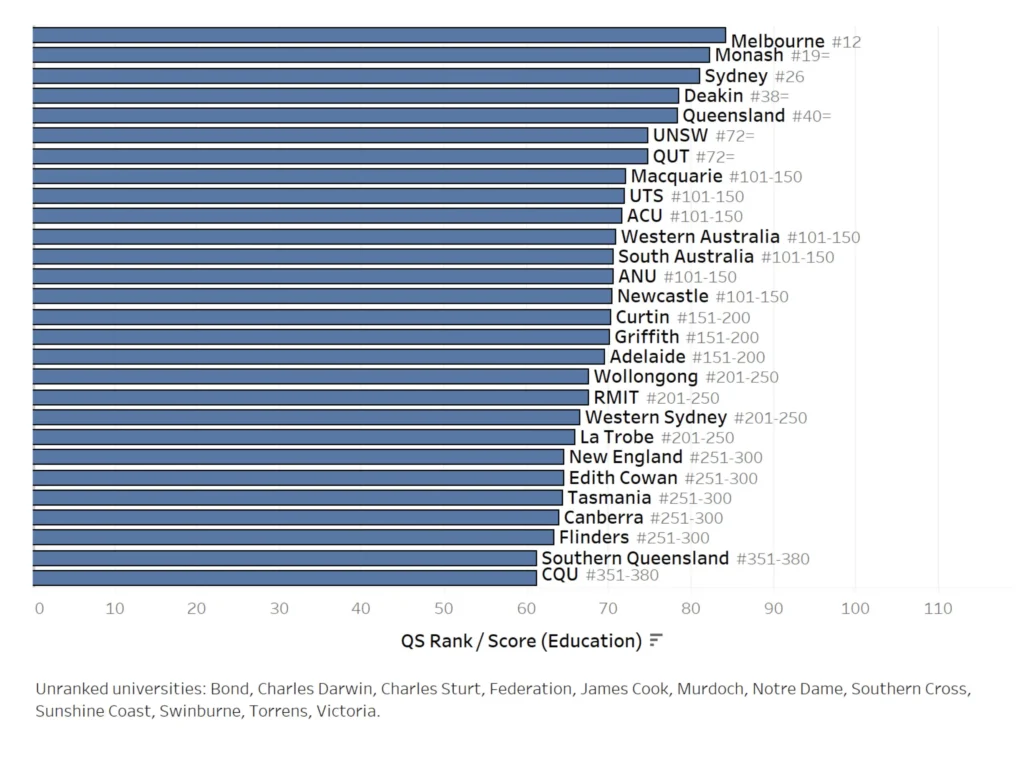
Source: QS Rankings (Education) 2023
Australia’s research in education is lower quality than in other fields.
AVERAGE ERA SCORES BY FIELD IN AUSTRALIAN UNIVERSITIES
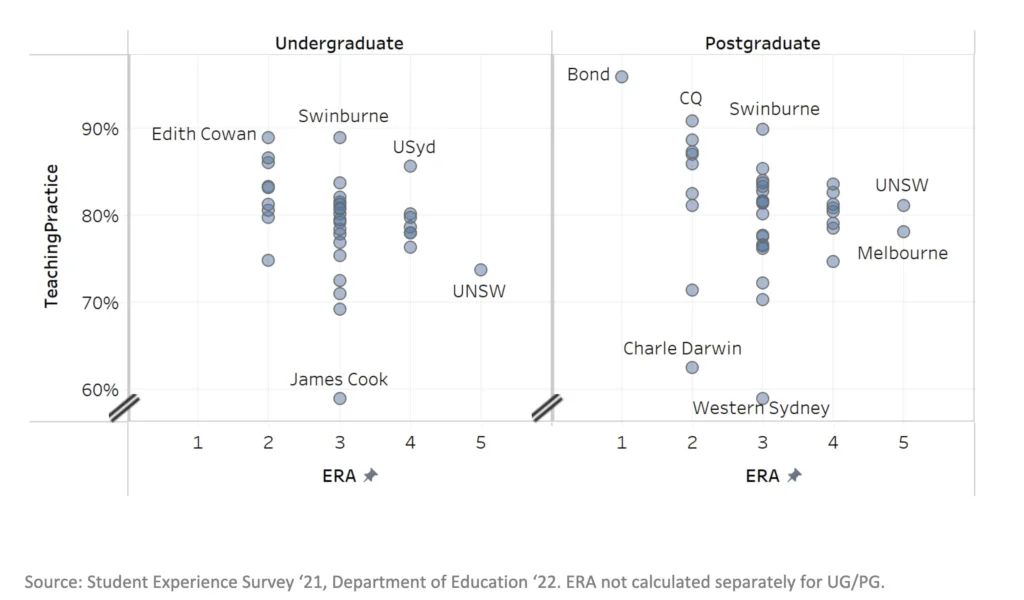
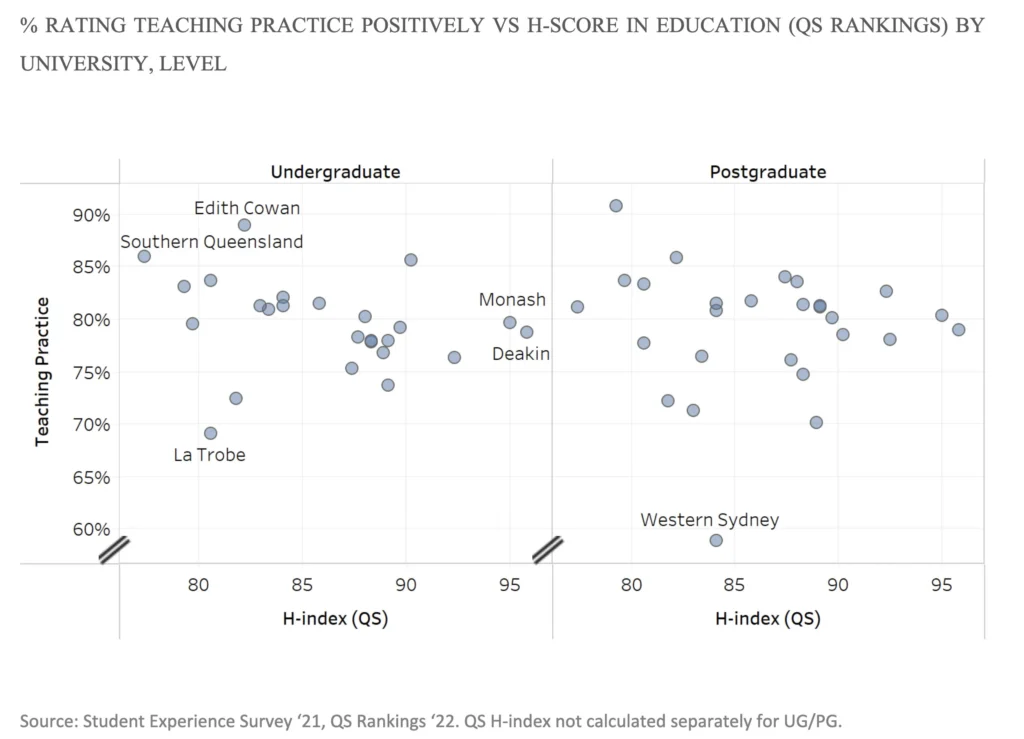
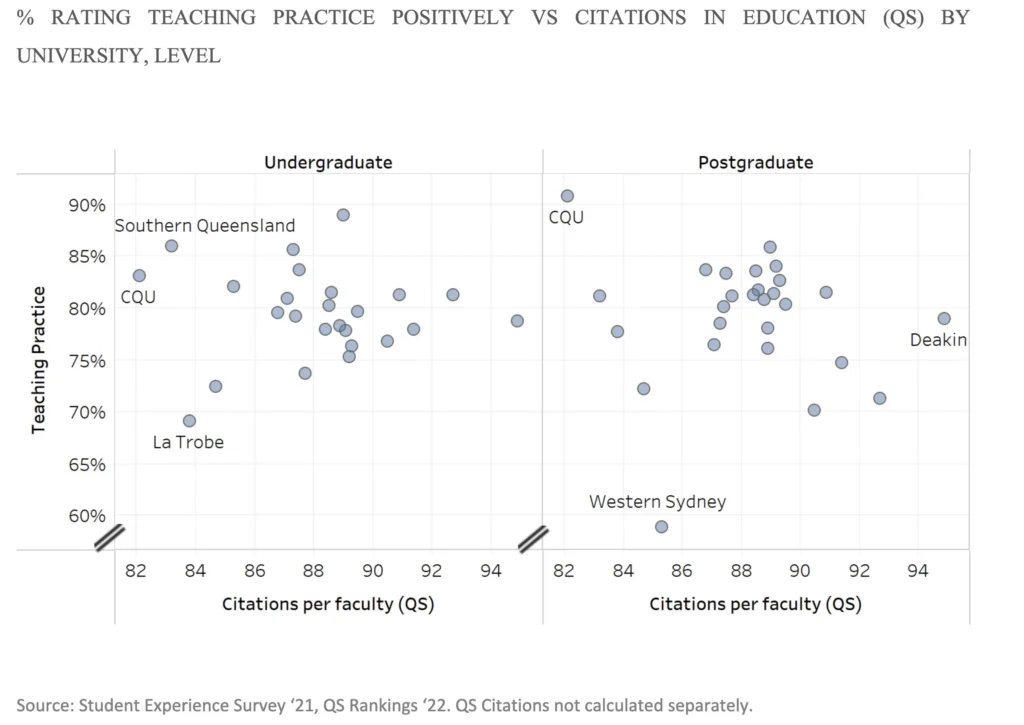
Moreover, within the field of education, there is no relationship between the quality of research and the quality of teaching. Namely, there is no association between the quality of teaching practice (as measured by the QILT Student Experience Survey),[142] and ERA scores, nor the number of research citations, nor international research rankings (as measured by QS).[143]
There is no relationship between quality of research and quality of teaching practice.
% RATING TEACHING PRACTICE POSITIVELY VS ERA SCORE IN EDUCATION BY UNIVERSITY, LEVEL
There is no relationship between research rankings and quality of teaching practice.
% RATING TEACHING PRACTICE POSITIVELY VS H-SCORE IN EDUCATION (QS RANKINGS) BY UNIVERSITY, LEVEL
There is no relationship between research citations and quality of teaching practice.
The research capability of Australian universities is one of the key justifications underpinning their near-monopoly status on the provision of ITE. As the data shows, this rationale is not supported by available evidence. While a ‘nexus’ between research and teaching may exist in other fields, it does not appear to be present within education and teacher preparation qualifications.
Australia’s ITE places relatively little weight on practicum time in the classroom, despite this being the greatest factor in predicting early career effectiveness
While school-based practicum placements have typically been valued by preservice teachers,[144] Australian school systems have long grappled with ineffective implementation and coordination of effective partnerships between ITE providers and placement host schools.[145] [146] As a result, many preservice teachers report a lack of opportunities to study, practice, and rehearse teaching.[147]
To promote classroom-readiness, it is necessary to ensure preservice teachers receive sufficient quantity and quality of time in their practicum.
Current Australian ITE accreditation requires programmes to include at least 80 days of in-school practicum for undergraduates and at least 60 days in graduate programmes. This is equivalent to around half the time that teachers in England spend during their practicum — where they are also required to be placed in two schools during their training.
The US NCTQ’s advice to ITE providers is less about an emphasis on the duration of practicum (though they recommend that ITE students receive at least 10 weeks of practicum time, with most programs providing around the equivalent of 70-80 days of practicum) but with two quality factors. First, ITE students are expected to receive written feedback from at least four classroom observations from their supervisor within their training semester (or year, depending on program). Second, when assigning preservice teachers to supervising schools and teachers, ITE providers are expected to ensure that the supervising teacher has the skills needed to support the preservice teacher and that there is evidence to affirm that they are themselves an effective instructor, as measured by student learning.
There is now very strong evidence demonstrating the importance of school-based practicum in teacher preparation,[148] [149] as it is well-established that the best predictor of early career teachers’ effectiveness is their early in-class performance.[150] [151] Research shows that pre-service training in schools is formative in teachers’ instructional practices once in-service[152] [153] [154] [155] as well as their likelihood to stay in teaching.[156] First-year teachers can be as effective as typical third-year teachers if those new teachers spend their student teaching experience in the classroom of a highly effective teacher.
Importantly, research generally finds it’s especially the quality rather than quantity[157] of preservice practicum that best explains graduate teacher effectiveness. Teachers who undergo longer student teaching periods may feel better prepared and are more likely to continue teaching. However, research indicates that longer student teaching does not necessarily make them more effective in their instruction compared to those with shorter durations of student teaching.[158] More generally, teachers’ perceptions of preparedness are not associated with actual effectiveness in the classroom,[159] [160] though they appear to be related to retention.[161]
There are several evidence-based factors that contribute to more effective preservice placements. Teachers who are placed in schools with a history of strong achievement gains, high-quality learning environments,[162] with instructionally effective teachers, high rates of teacher retention, and quality teacher collaboration, are more likely to become more effective themselves, and generally have lower rates of attrition.[163]
There is especially strong evidence that preservice teachers who are trained by instructionally-effective supervisors are themselves more effective.[164] [165] [166] This appears to be due to both more effective modelling of practices and more effective coaching.[167] Moreover, there is also evidence that professional development of supervising teachers in how to be better coaches can contribute to further improving preservice teachers’ performance. [168]
Classroom-readiness can be assessed and measured in appropriate methods
There are two broad measures used in Australia to assess knowledge and readiness of teachers.
The first is a basic skills test of preservice teachers’ literacy and numeracy, known as the Literacy and Numeracy Test for Initial Teacher Education (LANTITE). In many countries, no such screening tool is needed — either because competition for teaching places allows a market rather than regulatory mechanism to select high-quality teachers, or because the tertiary admissions process already sufficiently filters candidates based upon their academic capabilities. In Australia, concerns about weak admissions standards across the higher education settings — particularly trends to admit students without sufficient reference to school exit exam results — has lowered confidence in the capacity of universities to maintain high academic standards.[169]
The second assessment is the Teaching Performance Assessment (TPA) — a compulsory assessment of practical skills and knowledge of pre-service teachers, before they can graduate.[170]
In theory, TPAs ensure ITE graduates are applying what they have been taught over the course of their degree. In practice, TPAs vary in quality,[171] typically focus on teaching materials rather than classroom observations, and usually allow unlimited attempts, making them an insufficient measure of classroom readiness in their current form.
It is common practice in school systems across the United States to include a range of basic skills tests, content knowledge tests, pedagogical content knowledge tests, and in-field teaching performance assessments.[172] As discussed above, each of the knowledge bases can contribute toward teachers’ effectiveness in-field in various ways, but regulating the quantity of courses in each respective area is not generally reliable — which has partly necessitated monitoring performance in standardised assessments instead.
Evidence about the validity of teaching performance assessments is more recent within the research. While there is international evidence to suggest that at least some components of the teaching performance assessments (and similar instruments) are relatively predictive of teachers’ in-field effectiveness in the classroom,[173] [174] there have been mixed results in finding any statistical association with higher student achievement.[175] [176]
Nonetheless, generic classroom observations tend to mostly provide valid and reliable information. In addition, higher observational scores during preservice training are also related to lower rates of teacher attrition, after controlling for student teachers’ demographic characteristics and their academic achievement.[177] When well-calibrated, external, and independent, classroom observations are reliable measures of teachers’ effectiveness,[178][179] [180] including when used for high stakes evaluations of performance.[181] There’s also evidence that classroom observations are especially good for distinguishing between weak and sufficient teaching standards of early career teachers, compared to alternative approaches.[182] In classroom observations, classroom management is found to consistently be most strongly and consistently predictive of teachers’ value-added scores.[183]
An OECD analysis of top-performing education systems shows that their ITE programs focus less on preparing preservice teachers to be academics and more on preparing teachers for the classroom — finding that preservice teachers in high-performing countries begin practical teaching in schools earlier, spend more time in practicum, and receive more and better support in the process, compared to other countries.[184] Greater attention to classroom management,[185] preparation for the work of first-year teaching (including the amount of focus on practice and having a teaching placement),[186] [187] and promoting supportive learning environments[188] are consistently found in effective ITE programs.
How graduate teachers rate how well their ITE program prepared them is at least partly associated with observations of their practice. However, this is limited to the preparedness in terms of classroom management and providing supportive learning environments, but not to other features, such as preparedness for teaching diverse learners.[189]
Accountability of ITE providers
Across ITE systems, there are several pertinent accountability objectives that can support how the sector operates: monitoring program quality and providing reliable information to stakeholders and policymakers; assisting consumers (including prospective teachers and employers) to make informed choices about study and employment decisions; and providing valuable information about relative strengths and weaknesses of programs to support continuous improvement by ITE providers.[190]
However, accountability efforts in the ITE sector have generally failed to meet these objectives. Instead, policymakers have concentrated on quality measures that are based on what is most feasible to directly measure or observe, rather than necessarily the quality measures most related to the effectiveness of graduate teachers. This has resulted in mixed levels of confidence that the ITE sector is meeting a level of accountability that meets public expectations.
While various reform efforts have resulted in compliance-based standards to regulate quality of teacher preparation, concerns remain around the consistency of performance within the sector and a lack of confidence from the industry, employers, and policymakers.
As a result, some education systems and researchers have increased efforts to examine teacher preparation through shifting away from inputs-based approaches and towards outcomes-based ones.[191] Within the Australian context, the TEEP was tasked with reporting on how quality measures for ITE could be linked to funding arrangements. In the Panel’s report, it identified four potential broad indicators to inform performance monitoring and, potentially, funding of ITE providers:
- Selection: Based on participation rates of diverse and high-quality candidates in areas of workforce need (i.e., First Nations students, students from regional and remote locations and low socio-economic backgrounds, school leavers with a high Australian Tertiary Admissions Rank and students enrolled in Science, Technology, Engineering and Math subjects).
- Retention: Based on the proportion of students who leave their course.
- Preparedness of beginning teachers: Based on students’ perceived preparedness for entering the teaching profession and their satisfaction with the quality of their course.
- Transition: Based on the employment outcomes of recent graduates and early career teachers.
Variations in the performance of ITE providers can be significant
Researchers studying ITE programs have compared effectiveness of in-service teachers (as measured by indicators like classroom readiness, student achievement, and the like) based on the different ITE programs that they participate in or graduate from.
Surprisingly, however, some early studies did not consistently find significant differences on average among the graduates from different institutions or programs.[192] That is, while researchers consistently found large between-teacher differences, they found only modest between-ITE provider or between-program differences.[193] [194] [195]
This is important, because if researchers cannot observe differences between programs, it means they cannot distinguish highly effective and less effective ITE programs or providers. Instead, any differences in trainee teachers’ effectiveness during service are attributed to their personal attributes.
Though this finding has been replicated over several studies, it is not unanimous. Other studies have instead observed significant variations in between-ITE-provider beginning teacher effectiveness — especially when measuring outcomes through classroom observations,[196] [197] including with some differences in the impacts and variation across domains of study.[198]
In two studies that found relatively high between-ITE-provider variation, the difference between the average and the most effective ITE programs was estimated to be roughly equivalent to the difference in achievement between disadvantaged and not disadvantaged students,[199] while in another, graduates from top quartile ITE programs performed as though they had the equivalent of an additional year of initial teaching experience when compared with graduates from the bottom quartile.[200] Other research has estimated that the differences between the least effective ITE providers relative to the state average corresponded to between 5 and 10 weeks of student learning in mathematics and between 6 to 20 weeks of learning in English language arts (ELA).
Such studies demonstrate that differences in instructional quality of teacher preparation programs can potentially produce significant differences in outcomes[201] — particularly when measured in terms of average observation ratings of graduates (rather than student achievement results).[202] [203] In order to maximise the reliability of between-ITE-provider evaluation of programs, researchers encourage the use of multiple measures — including observation ratings, as well as a comprehensive on-site inspection process (where assessors visit teacher preparation program providers and collect evidence, including observing trainee teachers, course instructors, and stakeholder interviews).[204]
An important caveat in the research is that, generally speaking, only a minority of ITE programs appear to have a significant effect on teachers’ effectiveness, with most reporting little or no effect. For instance, one study found that ITE graduates from only 3 of the 23 programs graduated with any significant difference in their effectiveness than what was observed as the average level for graduates.[205] Another study identified 3 out of 10 programs that graduated teachers who consistently outperformed average new teachers.[206] And, in another, 10 institutions had more effective graduates on average, 2 institutions had less effective graduates, and 3 institutions had graduates who performed at statistically similar levels.[207] And, finally, a study in Washington State found that only 2 of 13 teacher preparation programs produced student achievement gains that were significantly different from a comparison group.[208]
Robust quality assurance models of performance monitoring can be informed by international best practice
While the regulation of ITE has traditionally focused on inputs alone, there are now some education systems who have extended this monitoring to the outputs and outcomes of ITE providers.
This is important, not only because inputs alone may not adequately describe the relative quality of ITE providers and programs, but also because regulators may not always be able to precisely control quality through inputs alone. Moreover, regulation of this kind can result in perverse changes in the behaviour of providers to strictly meet the compliance objectives, rather than the outcomes ultimately desired (which are far less fungible).[209]
Among the most ambitious approaches are those employed in some jurisdictions of the United States — including states such as Tennessee, Texas, Louisiana, Massachusetts, Colorado, and Illinois. While some common elements are observed across these systems, varying emphases are placed on areas of importance of policymakers.
For instance, in Louisiana’s Teacher Preparation Quality Rating System, ITE providers receive an overall rating score, as well as specific ratings for:
- Preparation Program Experience (based on on-site reviews and measures of content knowledge and teaching methods, feedback and candidate performance, and continuous improvement processes);
- Meeting Educator Workforce Needs (particularly whether teacher candidates are being placed in high-need schools, or being accredited in high-need areas); and
- Teacher Quality (based on value-added data of graduate teachers).
In Massachusetts, quality assessments are made across domains — namely:
- The organisation (asking if the organisation is, overall, set up to support and sustain effective preparation of teachers);
- Partnership (which concerns fitness in meeting the needs of the pre-K–12 system);
- Continuous improvement (which concerns the continuous improvement efforts in better preparing educators);
- Candidate (which concerns candidate’s experience within their ITE program in being prepared effectively);
- Fields-based (which concerns whether candidates receive the necessary experience to be classroom-ready); and
- Instruction (which concerns the knowledge and skills of graduating teachers) domains.
The performance data is collected from graduate surveys, surveys of principals, focus groups, in-service and preservice teacher evaluations, surveys of supervising teachers, among others. ITE providers’ performance data is publicly reported as the Educator Provider Annual Snapshot.
The Tennessee State Board of Education publishes a Report Card on ITE providers, which reports transparent data across a range of areas, including:
- Candidate recruitment and selection (the academic strength and diversity of ITE intakes and the proportion serving high-needs schools);
- Employment and retention of graduate teachers;
- Candidate assessments (namely of teaching skills, subject knowledge, and pedagogy, as measured by licensure examinations);
- Satisfaction ratings (of graduates rating their program, employers’ perceptions of graduates; and school-based partners’ perceptions of preparedness of teachers); and
- Graduates’ effectiveness and impact (as measured by observation scores and value-added measures of student achievement in graduates’ classrooms).
And Texas provides a wide range of measurement for consumers and the sector through the Educator Preparation Data Dashboard. Of particular note in this accountability system is that performance is measured against four accountability indicators:
- Graduates’ certification examination results in content, pedagogy, and professional responsibilities assessments;
- Principal survey ratings of the preparation of first-year graduating teachers;
- Frequency and quality of field observations; and
- A graduating teachers’ satisfaction survey.
The emphasis across each of these systems, in various ways, is to provide highly transparent information to users — including students and prospective students, employers, and other ITE providers. In effect, this supplies participants in the ITE market with the information and quality signals needed to ensure that decision-making of stakeholders is made as well as it could be.
Related approaches also rely on a high level of centralised government-led monitoring of the sector, including with punitive penalties for underperforming providers. In part, this has motivated reform to ITE quality assurance in England. Here, ITE providers are inspected and assessed by the Office for Standards in Education, Children’s Services and Skills (OFSTED). Quality ratings (ranging from outstanding, good, requires improvement, and inadequate) are assigned to ITE providers for the purpose of transparency and, in the event of achieving an ‘inadequate’ rating, may result in disendorsement of the ITE provider as approved for initial teacher preparation. Among the data collected and reported in this process are the characteristics of ITE cohorts, the outcomes (particularly completion and employment rates) of graduates, and the like. Over recent years, a marked observation in the ITE market has been the withdrawal of some university-based providers, seemingly in anticipation of difficulty meeting the revised expected performance standards.
Australian policymakers have indicated a willingness to better link the performance of ITE providers and their public funding — seemingly using a performance-based funding model. There are relatively few international examples of relevant funding arrangements for comparison that are specific to ITE — however, there are many education systems in which outcomes- or performance-based funding models operate, especially in the United States (with Tennessee, in particular, as a leader in this regard).
Some particular peculiarities with Australian higher education make it difficult for governments to use funding levers for quality assurance. For instance, it is possible for legislative amendments to specifically allocate the number of university-based ITE places — including which institutions are eligible for these enrolments — though this may be an inefficient method, particularly in absence of quality indicators for employers and students.
Similarly, the current (and relatively menial) performance-based funding arrangements for universities are calculated and distributed at the institution level, not the program level, so it would be difficult to directly target financial incentives through this means to teacher education programs, on current settings. It is also not clear that the very broad institutional performance measures (including graduate employment outcomes, student experience, student success and equity group participation by Indigenous, low socio‑economic status and regional/remote students) are necessarily fit-for-purpose for quality assurance of ITE providers specifically.
Importantly, there are frictions in Australia’s ITE market that currently limit the ability of employers, prospective students, and other stakeholders from making quality decisions — ultimately also reducing performance incentives across the sector. The Productivity Commission (in both its review of the National School Reform Agreements and its Productivity Inquiry) noted that consumers of ITE do not have sufficient information to make informed decisions about the quality of ITE providers. Similarly, The QITE review indicated that the accreditation standards used by teacher accreditation regulators do not provide incentives of reward, recognition, and continuous improvement to ITE providers to meet accreditation standards.
In any case, there is a strong case for establishing a framework of quality assurance for ITE providers and programs — and especially one that offers the breadth of relevant quality markers that are required to inform the sector fully and fairly about relative performance. To do so, quality assurance must cover all relevant aspects of teacher preparation, from the inputs of ITE candidates to the outcomes of ITE graduates, and many aspects in between.
Monitoring the inputs to ITE
Monitoring for the inputs to ITE focuses on who, and how, candidates are admitted to programs. This is because quality is often associated with the relative selectivity or rigour that institutions or programs apply in their admissions process, or the degree to which ITE providers are admitting the ‘right’ candidates, based on policy objectives of the sector’s demand.
This could include the gatekeeping of entry to programs based on standardised assessments (academic and non-academic), the grades or levels of school-leaving credentials (such as the ATAR or grades in selected Year 12 courses), disposition or personality assessments that assess ‘fitness for teaching’ (such as the Teaching Beliefs and Mindsets Survey), admissions acceptance rates, and the like.
Similarly, other inputs monitoring may include the extent to which programs admit candidates that are underrepresented — such as diverse and minority populations, or those with in-demand academic backgrounds, such as mathematics and science specialisations, the geographic distribution of candidates (particularly in terms of regional and remote locations), or the age or sex of candidates (particularly in systems where males or mid-career candidates are underrepresented).
Monitoring the processes of ITE
Monitoring for the processes of ITE focuses on how ITE providers or programs administer their training. This could include a wide range of characteristics of programs from the enrolment patterns (for instance, what proportion of students undertake their qualifications through on-campus or full-time study modes), how programs are structured (such as whether programs are aligned with a predefined standard of ITE content, the proportion of trainees who are successfully placed in preservice practicums), the processes involved in making preservice placements (such as the rigour with which ITE providers apply in selecting host schools for placements and the like), the standard of reference materials like textbooks used in providing instruction, the experience or suitability of ITE training faculty (such as the research quality or school-based experience of faculty members), the duration of programs (such as meeting mandatory hours of instruction), the institutional support available to students (such as having supportive staff to coordinate and assist with transitioning toward in-service graduation and meeting relevant permissions to teach in applicable jurisdictions), and the pass or repeat rate of ITE courses in pedagogy and subject knowledge courses (where applicable).
Monitoring the outputs of ITE
Monitoring for the outputs of ITE focuses on the ability of providers or programs to convert an intake of students into a cohort of graduate, in-service teachers. This can include the successful completion rate of ITE students (or, similarly, the dropout or attrition rate), the employment rate of ITE graduates (such as the proportion of graduates who are successfully placed in-field in the year following graduation), proportion of graduates who successfully meet licensing or accreditation assessments (where applicable), proportion of graduates who are assessed as meeting teacher performance assessments through observations of practice (and not simply teachers’ self-efficacy or confidence ratings alone), the feedback of supervising teachers during preservice placement, ITE content and pedagogical knowledge assessment.
Monitoring the perspectives of ITE
Monitoring of the perspectives of ITE is important for ensuring that participants in the teacher preparation process feel that it is meeting their respective needs. Measurement could focus on how stakeholders (including ITE students, employers, and the like) experience and perceive components of teacher preparation. This can include a wide range of stakeholders (including ITE graduates, exit surveys from candidates who drop out of ITE programs, and so on), ITE graduates’ perceptions of preparedness at graduation, ITE students’ ratings of faculty’s teaching quality, ratings from supervisors and principals on the school-based placement experience, and so on.
Monitoring the outcomes of ITE
Finally, monitoring for the outcomes of ITE focuses on the ultimate effectiveness and persistence of ITE graduates once successfully in-field. To this end, it is implied that ITE providers and programs ought to be, at least partly, accountable for these results. Some measures that can be employed include teachers’ evaluation ratings from supervisors or principals (including both in-class and outside-of-class ratings of performance), classroom observation ratings from external assessors, student surveys of classroom practices (such as surveys of instructional clarity and the like), and the early career retention rate of graduates. In some contexts, the collection of student achievement data may be informative over several years as an indicator of teachers’ effectiveness (as is collected and reported in systems such as Tennessee).
Policy implications
The quality of ITE providers, not ITE students, is responsible for the sector’s underperformance
Over recent years, much has been made of an implied lack of quantity and quality of ITE graduates — leading to public scare campaigns about a shortage of new teachers entering the profession and that teachers’ academic standards are too low. But, by and large, these concerns are unfounded or exaggerated. The size of the teacher workforce has been growing at record pace and will likely grow ahead of medium-term needs. This is because the number of teachers exiting the profession is easily compensated by new entrants in almost every year on record. And while there are occasional anecdotes about potentially academically-unsuitable ITE candidates being accepted into university places, the incidence of these is extremely rare and, where applicable, reflect a wider higher education policy failure, rather than one that’s ITE-specific.
Far more concerning is the persistent underperformance of some ITE providers — and the sector at large. Successive independent reports have definitively shown that ITE providers do not consistently offer preservice teachers with the training needed to be effective upon graduation. In addition, teachers’ reported classroom-readiness has declined over recent years, despite longer and notionally more rigorous ITE qualifications. Moreover, dropout rates across several ITE providers have significantly worsened over recent years.
Rather than a focus on the inputs to ITE — potential teachers’ academic abilities and the like — the focus for policymakers must be centred on the outputs — the quality of preservice training offered by ITE providers — and the outcomes — the successful preparation and effectiveness of graduates — of ITE.
Research suggests that the difference in teaching graduates’ effectiveness from high-performing and low-performing ITE providers can be the equivalent of around an additional year of teaching experience. For this reason, ensuring that the performance of ITE providers is maximised will be key to further improvement in the sector.
A lack of completing, rather than commencing, ITE students is the problem facing the teacher workforce pipeline
Public and stakeholder concerns about widespread teacher shortages have been repeatedly echoed over recent years, but tend to be misinformed or inflated. Nonetheless, data did show a decline in commencing ITE students over two years — 2018 and 2019 — further sparking concern for the incoming teacher pipeline. This has prompted a range of policy initiatives intended to provide additional incentives, especially for undergraduates, to enrol in ITE qualifications. However, this may not be the most effective policy approach.
First, it has misdiagnosed the source of the (temporary) decline in ITE commencements. The major factor in the recent decline in ITE commencements is not — as popularly believed — due to a collapse in the willingness of school leavers to consider teaching as a profession; or generally due to policy settings at all. Rather, it can be attributed to demographic reasons; in particular, a clear drop in the potential university cohort. Moreover, this demographic blip has since been reversed — resulting in above-trend numbers of ITE students commencing in 2020 and a near-record number of new ITE students in 2021.
And secondly, a far more pernicious problem in ITE is not the lack of commencements, but the lack of completions. Only around one in two students who start an ITE degree complete it. Most student dropouts are concentrated in a relatively small number of universities — and those who study ITE part time and remotely are at greatest likelihood of not completing their degree. Today, a little over half of ITE students are enrolled in programs that are delivered on-campus, with the rest enrolled online or only partially on-campus.
As a result, policy measures for both student and ITE incentives should be better targeted. A greater emphasis must be placed not just on attracting more entrants to ITE (which can result in generally expensive and inefficient policy approaches), but to ensuring those who enrol in ITE have a greater chance of completing and being placed as graduates. Even a small increase in the completion rate of ITE students can make a significant impact on the incoming teacher pipeline. For instance, if the part-time study rate could be halved, that would reduce attritions by 18%, or lead to nearly 2,000 extra graduations a year. University funding should be tilted toward providers who maximise the number of ITE students who are engaged in on-campus and full-time enrolments.
A promising financial incentive approach could be to provide graduate teachers in in-demand fields, particularly maths and science, with a ‘phased bursary’, which effectively acts as a short-term salary supplement during the early years in teaching. This approach is far more efficient than bursaries that are either offered across-the-board or on other narrow grounds. Evidence shows that this can significantly increase the number of STEM graduates who join the teaching profession.
Given the demographic trends that will likely increase the number of ITE commencements overall in the years ahead, policymakers would be better placed in ensuring that efforts to attract ITE students are limited to in-demand fields, and that efforts are concentrated on increasing the completion rate and employment of ITE students.
Potential teachers are not necessarily where they are needed
There are more teachers employed in Australian school systems today than ever before — including more per head of student population. However, these available teachers are not necessarily located where there is demand.
As a proportion of the student-aged population, there are relatively few teachers in the Western suburbs of Sydney and Brisbane, outer suburbs (west and south-east) of Melbourne, and outback Northern Territory. By contrast, there are a relatively high proportion of teachers residing in inner Melbourne, Brisbane, and Sydney (including Sydney’s inner-West), as well as in coastal suburbs (such as Sydney’s Sutherland Shire), and regional coastal towns (such as Mornington Peninsula and Geelong).
Namely, there are around three times more teachers per head of student-aged population in inner Melbourne (where there is the greatest abundance in the country) as in the outer suburbs of Brisbane (where there is the greatest scarcity).
A relatively small number of teaching degree-holders are currently employed as teachers. Policymakers could find better outcomes from recruiting or re-registering qualified teachers who are not currently working as teachers.
Among the potential performance indicators of ITE providers and systems must be the allocation of teachers to in-demand and hard-to-service geographic locations.
ITE operates in a protected, rather than competitive, market
Though universities enjoy a privileged position in Australia’s ITE market, it’s not clear that this is necessarily optimal. The typical justification for a near-monopoly in supplying teachers is based on a presumed research-teaching nexus from universities — namely that there is a transfer between university-based research to the teaching of students. Analysis of data shows no relationship between research and teaching quality across Australian ITE providers.
Unlike school systems in the United Kingdom and United States, Australia’s ITE is far more rigid in who can provide teacher training and who can become a teacher. In England, around two in five ITE students complete a school-led pathway and, in the United States, around one in five ITE students is engaged in some form of non-traditional teaching pathway.
Over the past decade, English schools have significantly expanded the ITE market toward a supply-side, locally-responsive approach, rather than one that is entirely centrally managed and university-led. This has allowed schools and local partnerships to better support teacher training grounded in classroom practice and school-based employment. Evaluations show that this approach has diversified the providers in the ITE market, supplying graduates at comparable or lower cost than traditional ITE programs, and has especially improved the coordination of school-based partnerships for practical experiences during training.
Australia’s ITE market could be diversified in at least three ways. First, through removing the funding bias against non-university higher education providers who offer ITE, but don’t receive the same access to Commonwealth support (even though they must meet the same quality standards for accreditation). Second, to expand the market of ITE providers, policymakers should support the growth of external teacher training academies, specialised in providing and supporting local partnerships in school-led training. And third, to support this, policymakers should identify best practice schools who could potentially pilot as a hub of school-led ITE training programs.
ITE providers require clearer guidance to provide evidence-based, scientifically-informed teacher training
Under current regulatory settings, it is not clear that (or to what extent) ITE providers are effectively implementing intended policy interventions to require prescribed content, such as phonics-based instruction and assessment.
Meanwhile, over the past decade, English policymakers have made substantial progress in shaping a shared understanding of core content to be covered in ITE programs — which is validated through independent inspections and against relevant indicators of an effective curriculum.
Among the weaknesses in Australia’s ITE content is a lack of foundational understanding about the science of human cognition and learning, evidence-based teaching practices aligned with this scientific understanding, and behaviour and classroom management strategies that are supported by scientific evidence concerning attentional control and related concepts.
As recently endorsed by the TEEP, Australian policymakers should enforce a new framework of core content that is regularly moderated through an independent and external advisory group. To enable validation of ITE programs, and to support continuous improvement efforts, policymakers should undertake inspections of providers to monitor course delivery against the agreed core curriculum indicators.
In order to better monitor the content of ITE programs, policymakers could consider substituting efforts at regulating the mandatory content requirements with pedagogical knowledge exit exams that specifically test graduates’ understanding of critical elements of scientifically-informed teaching practices found to be associated with highly effective teaching practice.
The most formative, but most fickle, part of ITE is the school-based practicum component
By far the most impactful component in teacher preparation is the time spent in the classroom with an expert supervisor. There are several evidence-based factors that are known to support preservice teachers to become well-prepared for the classroom. Research shows that trainee teachers who are placed in the classroom of a highly effective teacher during their practicum are as effective as a third-year teacher when they graduate.
However, despite the evidence base pointing to the critical role played by school-based practicum, this has long been an area that has lacked the coordination needed for consistent success. The engagement across university-based providers, department bureaucracies, host schools, and preservice teachers has often been haphazard.
International best practice shows that it is possible for policymakers to set high standards for partnerships to prioritise the school-based practicum in teacher preparation. School systems should ensure that highly effective schools are provided incentives to be host schools for trainee teachers, highly-effective supervising teachers should be identified and provided support in order to do so effectively, and ITE students should benefit from being placed in two schools during the course of their preparation. Future federal funding should be tied to the implementation of practicum partnership reform and quality assurance of this process.
Quality is not adequately measured and monitored in Australian ITE
Australia’s ITE providers do have a formal accreditation process, but it’s focused on a crude measure of the quantity of content (particularly mandatory content requirements) in ITE, rather than necessarily ensuring the quality of it. At present, there is little external confidence that can yet be placed in the Teaching Performance Assessment (TPAs) as a sufficient measure of quality assurance.
To ensure a more complete picture of teachers’ knowledge and readiness, policymakers could consider assessing the merits of phasing out the LANTITE assessment and replacing it, over time, with a standardised teacher knowledge assessment. Among a range of other indicators of performance, this should assist in identifying ITE programs and providers who are best preparing graduates, and where there are opportunities for improvement. The content of knowledge assessment tests should be moderated through a national external oversight board.
Australia’s ITE market requires robust and publicly transparent performance measurement
Some school systems in the United Kingdom and United States have developed robust performance monitoring approaches toward ITE providers, with publicly transparent reporting of relative performance. Importantly, this has supplied valuable information to signal to the ITE market, supporting informed decision-making from ITE consumers and employers, and helping to direct demand to the best performing ITE providers.
By contrast, Australia’s accountability process is rudimentary. To the extent that higher education providers publicly report information, it is too general to make conclusions about the performance of teacher preparation. Significant coordination of data collection is required to support a comprehensive accountability mechanism, but this would be a worthy investment to bring much-needed quality assurance to the ITE market.
Importantly, performance-based accountability should provide wide coverage of metrics that are relevant to ITE providers and to policymakers. This should also be converted into a summative performance standard to aid in interpretation for users. For instance, measurement should range from:
- Inputs (such as the incoming ITE candidate characteristics, particularly the proportion of enrolments for whom the ITE is recorded);
- Processes (such as the enrolment patterns of students, success rate of school-based practicum partnerships, alignment to core content indicators, and the like);
- Outputs (such as the relative employment rate of ITE graduates into schools, including high-needs schools, teacher knowledge assessments, and the like);
- Perspectives (how employers rate classroom-readiness of graduates, student surveys of teachers (where applicable), and graduates’ rating of ITE programs); and
- Outcomes (effectiveness of graduate teachers in the classroom, early career evaluation and progression of graduates, retention rates of graduate teachers, and the like).
Conclusion and recommendations
The effective preparation of teachers remains a key aspect of education policy and one that many school systems grapple with. Given the consistent evidence of the ‘novice penalty’ of new teachers — and the professional burden of underprepared early career teachers — there is clear justification for improving the outcomes from teacher preparation programs.
Based on this paper’s analysis, there are opportunities to further improve teacher preparation policy settings, including by learning from other school systems — including some from United States and United Kingdom, as well as others not documented here, such as Singapore and Ireland.
However, there are some signs and opportunities for improvement, based on recent research evidence and successful policy implementations in comparable school systems to Australia’s.
Despite many missed opportunities for reform, Australia’s policymakers have made some encouraging progress over recent years, but additional commitment toward reform will be necessary to reverse decades of underperformance of the ITE sector. That may include more ambitious approaches to quality assurance of ITE providers and programs than has typically been welcomed within the sector. It may also require several implementation steps in order to ensure that there is sufficient infrastructure into the medium term to support the data collection, validation, and moderation of standards within the sector and across jurisdictions.
This paper provides support for the conclusions reached by the TEEP’s recent review into ITE and policymakers are encouraged to fully implement its findings. In order to further enable success in ITE reform, several additional recommendations could support these aims:
- Ensure consistency in the content contained in ITE degrees through robust and regular inspections of ITE providers’ course content, rather than relying on university providers to self-report;
- Develop quality assurance indicators focused on outputs and outcomes of ITE, including the classroom readiness and early career performance of graduate teachers, rather than the inputs to ITE;
- Further develop quality assurance indicators with a view that, in time, the market can self-regulate through more transparent, timely, and reliable performance information;
- Ensure any financial incentives intended to increase supply of new teachers are targeted and focused on in-demand teachers, such as through a phased bursary to maths and science graduates;
- Tilt the financial subsidies to university ITE providers to those who enrol sufficient proportions of their students in on-campus and full-time study patterns;
- Deregulate the ITE provider market by removing the effective monopoly provider status of universities, including supporting the establishment of school-based and diverse teacher training academies;
- Improve the assessment of preservice teachers, by phasing out entry and screening exams of literacy and numeracy foundational skills, and replacing this with standardised teacher knowledge exit exams (specifically targeting essential science of learning pedagogical knowledge);
- Produce and report on teacher workforce needs through a national ‘heat map’ to better inform employers, as well as prospective and graduating teachers, about geographic and subject area teacher demand and supply;
- Invest in a consistent approach to providing practicum based on evidence of what works: early and sustained placement in highly-effective schools with highly-effective supervising teachers, with two placements guaranteed to all graduates; and
- Deregulate mid-career entry to teaching by fully accrediting and promoting one-year postgraduate teaching degrees and flexible starting salaries for graduates with a range of prior experiences.
With a comprehensive range of supports, including early career scaffolding, teacher preparation can be a lever for sustained improvements in the Australian teacher workforce — and ultimately the outcomes of students.
Acknowledgements
The authors acknowledge the valuable assistance of Eddie Stephen.
This research project was possible thanks to the generous support of the Susan McKinnon Foundation
Endnotes
[1] AITSL (2020). National Initial Teacher Education Pipeline. Melbourne: AITSL.
[2] Graham, L. J.; White, S. L. J.; Cologon, K.; and Pianta, R. C. (2020). Do teachers’ years of experience make a difference in the quality of teaching?, Teaching and Teacher Education, 96, 103190.
[3] Gordon, R.; Kane, T. J.; and Staiger, D. O. (2006). Identifying Effective Teachers Using Performance on the Job, Brookings Institution, Washington DC.
[4] Atteberry, A.; Loeb, S.; and Wyckoff, J. (2015). Do First Impressions Matter? Predicting Early Career Teacher Effectiveness, AERA Open, 1 (4), pp. 1-23.
[5] OECD (2019). A Flying Start: Improving Initial Teacher Preparation Systems, OECD Publishing, Paris.
[6] Edwards, S. J. (2020). The perceived ‘classroom readiness’ and support of Western Australian primary graduate teachers. https://ro.ecu.edu.au/theses/2314
[7] O’Neill, S. and Stephenson, J. (2012). Does classroom management coursework influence pre-service teachers’ perceived preparedness or confidence?, Teaching and Teacher Education, 28 (8), pp. 1131–1143.
[8] Fahey, G. (2022). Teacher workforce: fiction vs fact, Research Report No 43, Centre for Independent Studies.
[9] Aldeman, C. and Mitchel, A. L. (2016). No Guarantees: Is it Possible to Ensure Teachers Are Ready on Day One?, Bellwether Education Partners, February 2016.
[10] Aldeman, C. and Mitchel, A. L. (2016). No Guarantees: Is it Possible to Ensure Teachers Are Ready on Day One?, Bellwether Education Partners, February 2016.
[11] Joseph, R. (2022). A shorter path to teaching: Exploring one-year postgraduate qualifications, Policy Paper No 48, Centre for Independent Studies.
[12] Fahey, G.; O’Sullivan, J.; and Bussell, J. (2021). Failing to teach the teacher: An analysis of mathematics Initial Teacher Education, Analysis Paper No 29, Centre for Independent Studies.
[13] Australian Government. (2015). Action Now: Classroom Ready Teachers –Australian Government Response, Canberra.
[14] Australian Institute for Teaching and School Leadership. (2020 December). Spotlight: Initial teacher education today. https://www.aitsl.edu.au/research/spotlight/initial-teacher-education-today
[15] Department of Education, Skills and Employment. (2020). Teaching and Social Leadership: Alternative Pathways. https://www.dese.gov.au/teaching-and-school-leadership/alternative-pathways
[16] Australian Institute for Teaching and School Leadership 2015, Accreditation of initial teacher education programs in Australia, AITSL, Melbourne.
[17] Productivity Commission (2022). Review of the National School Reform Agreement Study report, Productivity Commission, December 2022.
[18] NSW Productivity Commission (2023). The economic impacts of longer postgraduate initial teacher education: A cost-benefit analysis, January 2023.
[19] NSW Productivity Commission (2021). Productivity Commission White Paper 2021 Rebooting the economy.
[20] OECD (2019). Teaching and Learning International Survey (TALIS), OECD Publishing, Paris.
[21] OECD (2019). Teaching and Learning International Survey (TALIS), OECD Publishing, Paris.
Freeman, C.; O’Malley, K.; and Eveleigh, K. (2014).Australian teachers and the learning environment: An analysis of teacher response to TALIS 2013: Final Report, Australian Council for Educational Research.
[22] QILT (2022). 2022 Transparency Charts By FoE – 2020 data.
[23] QILT (2022), ‘2021 Student Experience Survey’, https://www.qilt.edu.au/surveys/student-experience-survey-(ses)
[24] QILT (2022), ‘2022 Employer Satisfaction Survey’, https://www.qilt.edu.au/surveys/employer-satisfaction-survey-(ess)
[25] QILT (2022), ‘2022 Graduate Outcomes Survey’, https://www.qilt.edu.au/surveys/graduate-outcomes-survey—longitudinal-(gos-l)
[26] Mitchel, A. B. and King, M. S. (2016). A New Agenda: Research to Build a Better Teacher Preparation Program, Bellwether Education Partners.
[27] Deans for Impact (2016). From Chaos to Coherence: A policy agenda for accessing and using outcomes data in educator preparation, Deans for Impact.
[28] Mancenido, Z. (2020). Impact Evaluations of Teacher Preparation Practices: Challenges and Opportunities for More Rigorous Research, EdWorkingPaper No. 22-534, Annenberg Institute at Brown University.
[29] Hill, H.; Mancenido, Z.’ and Loeb, S. (2021). Effectiveness Research for Teacher Education, EdWorkingPaper No 21-252, Annenberg Institute at Brown University.
[30] AITSL (2015), ‘Accreditation of initial teacher education programs in Australia Standards and Procedures’, https://www.aitsl.edu.au/docs/default-source/national-policy-framework/accreditation-of-initial-teacher-education-programs-in-australia.pdf
[31] AITSL (2023), ‘Find your local regulatory authority’, https://www.aitsl.edu.au/find-your-local-regulatory-authority
[32] NESA (2023), https://www.educationstandards.nsw.edu.au/wps/portal/nesa/home
[33] VIT (2023), https://www.vit.vic.edu.au/
[34] Hare, J. (2019), ‘ATAR for teaching: all you need to know’, https://www.tes.com/en-au/jobs/careers-advice/moving-schools/atar-teaching-all-you-need-know#
[35] Harris, C. (2020), ‘Teaching: Student teachers in NSW will face tougher uni entry requirements’, The Daily Telegraph, https://www.dailytelegraph.com.au/news/nsw/teaching-student-teachers-in-nsw-will-face-tougher-uni-entry-requirements/news-story/32f0aa076888e669b4cfa0d576b7412c
[36] Department of Education (2019), ‘Higher education statistics (uCube)’, https://highereducationstatistics.education.gov.au/ Domestic only.
[37] Alphacrusis College (2023), ‘Commonwealth supported places and scholarships’, https://www.ac.edu.au/future-students/bachelor-of-education-csps-and-scholarship-information/
[38] Alphacrusis College (2022), ‘AC Hub Cost-Benefit Analysis’, https://www.parliament.nsw.gov.au/lcdocs/other/13709/Alphacrucis%20College.pdf
[39] Alphacrusis College (2022), ‘Budget Submission to NECSTEP’, https://treasury.gov.au/sites/default/files/2022-03/258735_alphacrucis_college_submission_2.pdf
[40] Postgraduate four-year attrition rates in education are 19% at Alphacrusis compared to 20% across all universities. Overall postgraduate student satisfaction in education is 79% at Alphacrusis compared to 73% across all universities.
[41] National Center for Education Statistics. (2022). Characteristics of Public School Teachers Who Completed Alternative Route to Certification Programs. Condition of Education. U.S. Department of Education, Institute of Education Sciences. Retrieved [date], from https://nces.ed.gov/programs/coe/indicator/tlc.
[42] McFarland, J., Hussar, B., Wang, X., Zhang, J., Wang, K., Rathbun, A., Barmer, A., Forrest Cataldi, E., and Bullock Mann, F. (2018). The Condition of Education 2018 (NCES 2018-144). U.S. Department of Education. National Center for Education Statistics.
[43] Allen, R.; Belfied, C.; Greaves, E.; Sharp, C.; and Walker, M. (2016). The Longer-Term Costs and Benefits of Different Initial Teacher Training Routes, IFS Report 118, Institute for Fiscal Studies.
[44] Allen, R.; Belfield, C.; Greaves, E.; Sharp, C.; and Walker, M. (2014). The Costs and Benefits of Different Initial Teacher Training Routes, IFS Report R100, Institute for Fiscal Studies.
[45] LiBetti, A. and Trinidad, J. (2018). Trading Coursework for Classroom: Realizing the potential for teacher residencies, Bellwether Education Partners, July 2018.
[46] Henry, G. T.; Kershaw, D. C.; Zulli, R. A.; and Smith, A. A. (2012). Incorporating teacher effectiveness into teacher preparation program evaluation, Teacher Education, 63 (5), pp. 335-355.
[47] Boyd, D.; Grossman, P.; Lankford, H.; Loeb, S.; and Wyckoff, J. (2006). How Changes in Entry Requirements Alter the Teacher Workforce and Affect Student Achievement, Education Finance and Policy, 1 (2), pp. 176-216.
[48] Considine, J.; Player, D.; Silva, T.; Hallgren, K.; Grider, M.; Deke, J.; and Warner, E. (2009). An Evaluation of Teachers Trained Through Different Routes to Certification, (NCEE 20094043). Washington, DC: National Center for Education Evaluation and Regional Assistance, Institute of Education Sciences, U.S. Department of Education.
[49] Penner, E. K. (2020). Teach For America and Teacher Quality: Increasing Achievement Over Time, Educational Policy, 35 (7), pp. 1047-1084.
[50] Shuls, J. V. and Trivitt, J. R. (2015). Teacher Effectiveness: An Analysis of Licensure Screens, Educational Policy, 29 (4), pp. 645-675.
[51] Clark, M. A. and Isenberg, E. (2020). Do Teach For America Corps Members Still Improve Student Achievement? Evidence from a Randomized Controlled Trial of Teach For America’s Scale-Up Effort, Education Finance and Policy, 15 (4), pp. 736–760.
[52] Boyd, D.; Grossman, P.; Hammerness, K.; Lankford, H.; Loeb, S.; Ronfeldt, M.; and Wyckoff, J. (2010). Recruiting Effective Math Teachers: How Do Math Immersion Teachers Compare?: Evidence from New York City, NBER Working Paper No. 16017.
[53] Redding, C. and Smith, T. M. (2016). Easy in, Easy out: Are Alternatively Certified Teachers Turning Over at Increased Rates? American Educational Research, 53 (4), pp. 1086-1125.
[54] Kelly, S. and Northrop, L. (2015). Early Career Outcomes for the “Best and the Brightest”: Selectivity, Satisfaction, and Attrition in the Beginning Teacher Longitudinal Survey, American Educational Research, 52 (4), pp. 624-656.
[55] Redding, C. and Smith, T. M. (2019). Supporting Early Career Alternatively Certified Teachers: Evidence from the Beginning Teacher Longitudinal Survey, Teachers College Record, 121 (11), pp. 1-32.
[56] Donaldson, M. L. (2012). The Promise of Older Novices: Teach for America Teachers’ Age of Entry and Subsequent Retention in Teaching and Schools, Teachers College Record, 114 (10), pp. 1-37.
[57] Hansen M.; Backes, B.; and Brady, V. (2016). Teacher Attrition and Mobility During the Teach for America Clustering Strategy in Miami-Dade County Public Schools, Educational Evaluation and Policy Analysis, 38 (3), pp. 495-516.
[58] Lovinson, V. S. (2022). The Effects of High-performing, High-turnover Teachers on Long-run Student Achievement: Evidence from Teach For America, Ed Working Paper Series 22-675, Annenberg Institute at Brown University.
[59] An, Y., and Koedel, C. (2021). How do teachers from alternative pathways contribute to the teaching workforce in urban areas? Evidence from Kansas City, AERA Open, 7 (1), pp. 1-20.
[60] Glazerman, S.; Mayer, D.; and Decker, P. (2006). Alternative routes to teaching: The impacts of Teach for America on student achievement and other outcomes, Policy Analysis and Management, 25 (1), pp. 75-96.
[61] Chiang, H. S.; Clark, M. A.; and McConnell, S. (2017). Supplying disadvantaged schools with effective teachers: Experimental evidence on secondary math teachers from Teach For America, Policy Analysis and Management, 36 (1), pp. 97-125.
[62] Clark, M. A., and Isenberg, E. (2020). Do Teach For America Corps members still improve student achievement? Evidence from a randomized controlled trial of Teach For America’s scale-up effort, Education Finance and Policy, 15 (4), pp. 736-760.
[63] Boyd, D.; Grossman, P.; Hammerness, K.; Lankford, H.; Loeb, S.; Ronfeldt, M.; and Wyckoff, J. (2010). Recruiting Effective Math Teachers: How Do Math Immersion Teachers Compare?: Evidence from New York City, NBER Working Paper No. 16017.
[64] Boyd, H.; Grossman, P.; Hammerness, K.; Lankford, H.; Loeb, S.; Ronfeldt, M.; and Wyckoff, J. (2012). Recruiting effective math teachers: Evidence from New York City, American Educational Research, 49 (6), pp. 1008–1047.
[65] Stoddart, T. and Floden, R. (1995). Traditional and alternative routes to teacher certification: Issues, assumptions and misconceptions, in: Zeichner, K.; Melnick, S.; and Gomez, M. L. (eds.), Currents of reform in preservice teacher education (pp. 80–106), Teachers College Press.
[66] Mentzer, G. A.; Czerniak, C. M.; and Duckett, T. R. (2018). Comparison of two alternative approaches to quality STEM teacher preparation: Fast‐track licensure and embedded residency programs, School Science and Mathematics, 119, pp. 35–48.
[67] Anderson, K. A. (2020). A National Study of the Differential Impact of Novice Teacher Certification on Teacher Traits and Race-Based Mathematics Achievement, Teacher Education, 71 (2), pp. 247-260.
[68] Backes, B. and Hansen, M. (2023). Persistent Teach for America Effects on Student Test and Non-Test Academic Outcomes. CALDER Working Paper No. 277-0123.
[69] Commonwealth Department of Education (2021), ‘Next Steps: Report of the Quality Initial Teacher Education Review’, https://www.education.gov.au/quality-initial-teacher-education-review/resources/next-steps-report-quality-initial-teacher-education-review
[70] BETA (2021), ‘Incentivising Excellence, Attracting High-Achieving Teaching Candidates’, https://behaviouraleconomics.pmc.gov.au/projects/incentivising-excellence-attracting-high-achieving-teaching-candidates
[71] Department of Education (2022), ‘The National Teacher Workforce Action Plan’, https://www.education.gov.au/teaching-and-school-leadership/resources/national-teacher-workforce-action-plan
[72] NSW Audit Office (2019). Supply of secondary teachers in STEM-related disciplines, Report , 29 January 2019.
[73] Worth, J.; Tang, S.; and Galvis, M. (2022). Assessing the impact of pay and financial incentives in improving shortage subject teacher supply, National Foundation for Educational Research.
[74] National Audit Office (2016). Training new teachers, Report by the Comptroller and Auditor General, HC 798.
[75] Cater, J. (2017). Whither Teacher Education and Training?, Higher Education Policy Institute, HEPI Report No 95.
[76] NSW Audit Office (2019). Supply of secondary teachers in STEM-related disciplines, Report , 29 January 2019.
[77] Sims, S. and Benhenda, A. (2022). The effect of financial incentives on the retention of shortage-subject teachers: evidence from England, Working Paper No. 22-04, Centre for Education Policy and Equalising Opportunities, University College London.
[78] Feng, T. and Sass, T. R. (2018). The Impact of Incentives to Recruit and Retain Teachers in “Hard-to-Staff” Subjects, Policy Analysis and Management, 37 (1), pp. 112-135.
[79] Bueno, C. and Sass, T., (2018). The Effects of Differential Pay on Teacher Recruitment and Retention, Andrew Young School of Policy Studies Research Paper Series No. 18-07.
[80] Goss, P. (2020), ‘Cheaper fees for education degrees won’t improve the teaching profession’, The Grattan Institute, https://grattan.edu.au/news/cheaper-fees-for-education-degrees-wont-improve-the-teaching-profession/
[81] ACARA (2022), ‘Teacher education’, https://www.acara.edu.au/reporting/national-report-on-schooling-in-australia/national-report-on-schooling-in-australia-data-portal/teacher-education
[82] ACARA (2022), ‘Teacher education’, https://www.acara.edu.au/reporting/national-report-on-schooling-in-australia/national-report-on-schooling-in-australia-data-portal/teacher-education
[83] ‘Higher Education Standards Framework (Threshold Standards) 2011’, https://www.legislation.gov.au/Details/F2013C00169/Html/Text#_Toc330548949
[84] 6-year attrition rates for undergraduates, 4-year attrition rates for postgraduates. Domestic students only.
Australian Government Department of Education (2023), ‘Completion Rates – Cohort Analyses’, https://www.education.gov.au/higher-education-statistics/student-data/selected-higher-education-statistics-2021-student-data
[85] 6-year attrition rates.
[86] 4-year attrition rates.
[87] Department of Education (2019), ‘Higher education statistics (uCube)’, https://highereducationstatistics.education.gov.au/ Domestic only.
[88] Australian Government Department of Education (2023), ‘Completion Rates – Cohort Analyses’, https://www.education.gov.au/higher-education-statistics/student-data/selected-higher-education-statistics-2021-student-data
[89] The association between Employer Reputation (as measured by QILT) and Attrition Rates for education degrees, yields an R Squared of 53% for undergraduate education degrees, and 41% for postgraduate education degrees.
[90] QILT (2022), ‘2021 Student Experience Survey’, https://www.qilt.edu.au/surveys/student-experience-survey-(ses)#report
[91] Norton, A. & Cherastidtham, I. (2018), ‘Dropping out: the benefits and costs of trying university’, The Grattan Institute, https://grattan.edu.au/wp-content/uploads/2018/04/904-dropping-out-the-benefits-and-costs-of-trying-university.pdf
[92] OECD (2022), ‘Share of tertiary students studying part time (2013 and 2020)’, Education at a Glance, https://www.oecd-ilibrary.org/education/education-at-a-glance-2022_0fa2377d-en
[93] Six-year attrition rates for undergraduate students are 44% for part-time students compared to 20% for full-time. For postgraduate students, the equivalent four-year attrition rates are 28% for part-time students compared to 11% for full-time students.
Australian Government Department of Education (2023), ‘Completion Rates – Cohort Analyses’, https://www.education.gov.au/higher-education-statistics/student-data/selected-higher-education-statistics-2021-student-data
[94] The % positive rating for Learner Engagement among undergraduates across all fields was 52% for those enrolled in an internal or mixed study mode, but only 25% for those enrolled in an external study mode.
QILT (2022), ‘2021 Student Experience Survey’, https://www.qilt.edu.au/surveys/student-experience-survey-(ses)
[95] For undergraduate education degrees, 34% of the variation in attrition rates between universities can be explained by students’ reported learner engagement. This figure is 22% for postgraduate education degrees.
[96] Derived by calculating full-time and part-time attrition rates for each ITE providers & study level (undergraduate, postgraduate), by assuming part-time attrition rate is twice that of full-time attrition rate. Then assume part-time study rate is halved, and apply attrition rates and new full-time/part-time splits to commencements for each ITE provider & study level accordingly.
[97] Fahey, G. (2022). Teacher workforce: fiction vs fact, Research Report No 43, Centre for Independent Studies.
[98] Jobs and Skills Australia (2023). Internet Vacancy Index, March 2023 Detailed data by Occupation.
[99] Fahey, G. (2022). Teacher workforce: fiction vs fact, Research Report No 43, Centre for Independent Studies.
[100] Jobs and Skills Australia, Employment Outlook to November 2026.
[101] Australian Government (2022). Teacher Workforce Shortages, Issues Paper, Department of Education.
[102] TEQSA (2023), https://www.teqsa.gov.au/
[103] Hanushek, E. A. and Rivkin, S. G. (2010). Generalizations about Using Value-Added Measures of Teacher Quality, American Economic Review, 100 (2), pp. 267-271.
[104] Hanushek, E. A.; Kain, J. F.; O’Brien, D. M.; and Rivkin, S. G. (2005). The Market for Teacher Quality, NBER Working Paper No 11154, doi:10.3386/w11154.
[105] Ladd, H. F. and Sorensen, L. C. (2015). Do Master’s Degrees Matter? Advanced Degrees, Career Paths, and the Effectiveness of Teachers, CALDER Working Paper No. 136.
[106] Croninger, R. G.; Rice, J. K.; Rathbun, A.; and Nishio, M. (2007). Teacher qualifications and early learning: Effects of certification, degree, and experience on first-grade student achievement, Economics of Education Review, 26 (3), pp. 312-324.
[107] Ronfeldt, M. (2021). Links among teacher preparation, retention, and teaching effectiveness. National Academy of Education Committee on Evaluating and Improving Teacher Preparation Programs. National Academy of Education.
[108] Coenen, J.; Cornelisz, I.; Groot, W.; van den Brink, H. M.; and van Klaveren, C. (2018). Teacher characteristics and their effects on student test scores, Economic Surveys, 32 (3), pp. 848-877.
[109] Winters, M. A.; Dixon, B. L.; and Greene, J. P. (2012). Observed characteristics and teacher quality: Impacts of sample selection on a value added model, Economics of Education Review, 31 (1), pp. 19-32.
[110] Phillips, K. (2010). What Does “Highly Qualified” Mean for Student Achievement? Evaluating the Relationships between Teacher Quality Indicators and At-Risk Students’ Mathematics and Reading Achievement Gains in First Grade, Elementary School, 110 (4).
[111] Boyd, D. J.; Grossman, P. L.; Lankford, H.; Loeb, S.; and Wyckoff, J. (2009). Teacher preparation and student achievement, Educational Evaluation and Policy Analysis, 31 (4), pp. 416-440.
[112] Considine, J.; Player, D.; Silva, T.; Hallgren, K.; Grider, M.; Deke, J.; and Warner, E. (2009). An Evaluation of Teachers Trained Through Different Routes to Certification, (NCEE 20094043). Washington, DC: National Center for Education Evaluation and Regional Assistance, Institute of Education Sciences, U.S. Department of Education.
[113] Gitomer, D. H.; Brown, T. L.; and Bonett, J. (2011). Useful signal or unnecessary obstacle? The role of basic skills tests in teacher preparation, Teacher Education, 62 (5), pp. 431-445.
[114] Harris, D. N., and Sass, T. R. (2011). Teacher training, teacher quality and student achievement, Public Economics, 95 (7-8), pp. 798-812.
[115] Preston, C. (2017). University-based teacher preparation and middle grades teacher effectiveness, Teacher Education, 68 (1), pp. 102-116.
[116] Henry, G. T.; Campbell, S. L.; Thompson, C. L.; Patriarca, L. A.; Luterbach, K. J.; Lys, D. B.; and Covington, V. M. (2013). The predictive validity of measures of teacher candidate programs and performance: Toward an evidence-based approach to teacher preparation, Teacher Education, 64 (5),pp. 439-453.
[117] Youngs, P. and Qian, H. (2013). The Influence of University Courses and Field Experiences on Chinese Elementary Candidates’ Mathematical Knowledge for Teaching, Teacher Education, 64 (3), pp. 244-261.
[118] Schmidt, W. H.; Bloemeke, S.; and Tatto, M. T. (2011a). Teacher education matters: A study of middle school mathematics teacher preparation in six countries, Teachers College Press.
[119] Qian, H., and Youngs, P. (2016). The effect of teacher preparation programs on future elementary mathematics teachers’ knowledge: A five-country analysis using TEDS-M data, Mathematics Teacher Education, 19 (4), pp. 371-396.
[120] Berlin, R.; Youngs, P.; and Cohen, J. (2021). Opportunity for quality learning: How elementary teaching candidates develop mathematical knowledge for teaching, self-efficacy, and pedagogical beliefs, Teachers College Record, 123 (7), pp. 1-30.
[121] National Research Council. 2010. Preparing Teachers: Building Evidence for Sound Policy. Washington, DC: The National Academies Press.
[122] Goldhaber, D. and Brewer, D.J. (1997). Why don’t schools and teachers seem to matter? Assessing the impact of unobservables on educational productivity, Human Resources, 32 (3), pp. 505-523.
[123] Dee, T. S. and Cohodes, S. R. (2008). Out-of-Field Teachers and Student Achievement: Evidence from Matched-Pairs Comparisons, Public Finance Review, 36 (1), pp. 7-32.
[124] Hill H.C.; Charalambous, C.Y.; Chin, M.J. (2019). Teacher Characteristics and Student Learning in Mathematics: A Comprehensive Assessment, Educational Policy, 33 (7), pp.1103-1134.
[125] Akiba, M.; LeTendre, G. K.; and Scribner, J. P. (2007). Teacher Quality, Opportunity Gap, and National Achievement in 46 Countries, Educational Researcher, 36 (7), pp. 369-387.
[126] Hill, H. C.; Rowan, B.; and Ball, D. L. (2005). Effects of Teachers’ Mathematical Knowledge for Teaching on Student Achievement, American Education Research, 42 (2), pp.371-406.
[127] Baumert, J.; Kunter, M.; Blum, W. et al. (2010). Teachers’ Mathematical Knowledge, Cognitive Activation in the Classroom, and Student Progress, American Educational Research, 47 (1), pp. 133-180.
[128] Hill, H. C. et al (2008). Mathematical Knowledge for Teaching and the Mathematical Quality of Instruction: An Exploratory Study, Cognition and Instruction, 26 (4).
[129] Agathangelou, S. A. and Charalambous, C. Y. (2021). Is content knowledge pre-requisite of pedagogical content knowledge? An empirical investigation, Mathematics Teacher Education, 24 (5), pp. 431-458.
[130] Lachner, A. and Nückles, M. (2016). Tell me why! Content knowledge predicts process-orientation of math researchers’ and math teachers’ explanations, Instructional Science, 44, pp. 221–242.
[131] Krauss, S.; Brunner, M.; Kunter, M.; Baumert, J.; Blum, W.; Neubrand, M.; and Jordan, A. (2008). Pedagogical content knowledge and content knowledge of secondary mathematics teachers, Educational Psychology, 100 (3), pp. 716–725.
[132] Charalambous, C.Y. (2016). Investigating the Knowledge Needed for Teaching Mathematics: An Exploratory Validation Study Focusing on Teaching Practices, Teacher Education, 67 (3), pp.220-237.
[133] Quinn, R. J. (1997). Effects of mathematics methods courses on the mathematical attitudes and content knowledge of preservice teachers, Educational Research, 91(2), pp. 108–113.
[134] Garet, M. S.; Heppen, J. B.; Walters, K.; Parkinson, J.; Smith, T. M.; Song, M.; Garrett, R.; Yang, R.; and Borman, G. D. (2016). Focusing on mathematical knowledge: The impact of content-intensive teacher professional development (NCEE 2016-4010). Washington, DC: National Center for Education Evaluation and Regional Assistance, Institute of Education Sciences, U.S. Department of Education.
[135] Pellegrini, M.; Lake. C.; Neitzel, A.; and Slavin, R.E. (2021). Effective Programs in Elementary Mathematics: A Meta-Analysis, AERA Open. January 2021. doi:10.1177/2332858420986211
[136] Agathangelou, S.A. and Charalambous, C.Y. (2021). Is content knowledge pre-requisite of pedagogical content knowledge? An empirical investigation, Mathematics Teacher Education, 24, pp. 431–458.
[137] Deans for Impact (2015). The science of learning, Austin, TX: Deans for Impact.
[138] Universities Australia (2019), ‘Submission To Provider Category Standards Review’, https://www.universitiesaustralia.edu.au/wp-content/uploads/2019/05/190306-Submission-to-review-of-PCS.pdf
[139] 2016 figure for HERDC research income (all categories) in education.
ARC (2018), ‘State of Australian University Research 2018-19’, https://dataportal.arc.gov.au/ERA/NationalReport/2018/pages/section2/herdc-research-income-summary-all-categories/
[140] QS (2023), ‘QS World University Rankings by Subject 2023: Education & Training’, https://www.topuniversities.com/university-rankings/university-subject-rankings/2023/education-training?&page=2®ion=Oceania
[141] Australian Research Council (2018), ‘ERA Outcomes’, https://dataportal.arc.gov.au/era/web/outcomes#/for/13
[142] QILT (2022), ‘2021 Student Experience Survey National Report’, https://qilt.edu.au/docs/default-source/default-document-library/2021-ses-national-report.pdf
[143] QS (2023), ‘QS World University Rankings by Subject 2023: Education & Training’, https://www.topuniversities.com/university-rankings/university-subject-rankings/2023/education-training?&page=2®ion=Oceania
[144] Teacher Education Ministerial Advisory Group (2014). Action Now: Classroom Ready Teachers, Report prepared for the Australian Department of Education.
[145] Le Cournu, R. (2015). Key components of effective professional experience in initial teacher education in Australia, Australian Institute for Teaching and School Leadership, Melbourne.
[146] Centre for Education Statistics and Evaluation (2016). Professional experience in teacher education, Literature Review, NSW CESE.
[147] Hammerness K.; Klette, K.; Jenset, I.S.; Canrinus, E.T. (2020). Opportunities to Study, Practice, and Rehearse Teaching in Teacher Preparation: An International Perspective, Teachers College Record, 122 (11), pp. 1-46.
[148] Louden, W. and Rohl, M. (2006). “Too many theories and not enough instruction”: Perceptions of preservice teacher preparation for literacy teaching in Australian schools, Literacy, 40, pp. 66-78.
[149] Chingos, M. M. and Peterson, P. E. (2011). It’s easier to pick a good teacher than to train one: Familiar and new results on the correlates of teacher effectiveness, Economics of Education Review, 30 (3), pp. 449-465.
[150] Staiger, D. O. and Rockoff, J. E. (2010). Searching for Effective Teachers with Imperfect Information, Economic Perspectives, 24 (3), pp. 97-118.
[151] Goldhaber, D. and Hansen, M. (2010). Using Performance on the Job to Inform Teacher Tenure Decisions, American Economic Review, 100 (2), pp. 250-255.
[152] Ronfeldt, M.; Reininger, M.; and Kwok, A. (2013). Recruitment or Preparation? Investigating the Effects of Teacher Characteristics and Student Teaching, Teacher Education, 64 (4), pp. 319-337.
[153] Ronfeldt, M. (2015). Field Placement Schools and Instructional Effectiveness, Teacher Education, 66 (4), pp. 304-320.
[154] Ronfeldt, M.; Brockman, S. L.; and Campbell, S. L. (2018). Does Cooperating Teachers’ Instructional Effectiveness Improve Preservice Teachers’ Future Performance?, Educational Researcher, 47 (7), pp. 405-418.
[155] Scott, C. E.; McTigue, E. M.; Miller, D. M.; and Washburn, E. K. (2018). The what, when, and how of preservice teachers and literacy across the disciplines: A systematic literature review of nearly 50 years of research, Teaching and Teacher Education, 73, pp. 1-13.
[156] DeAngelis, K. J.; Wall, A. F.; and Che, J. (2013). The Impact of Preservice Preparation and Early Career Support on Novice Teachers’ Career Intentions and Decisions, Teacher Education, 64 (4), pp. 338-355.
[157] Ronfeldt, M. and Reininger, M. (2012). More or better student teaching? Teaching and Teacher Education, 28 (8), pp. 1091-1106.
[158] Ronfeldt, M. (2021). Links among teacher preparation, retention, and teaching effectiveness. National Academy of Education Committee on Evaluating and Improving Teacher Preparation Programs. National Academy of Education.
[159] Ronfeldt, M.; Matsko, K. K.; Nolan, H. G.; and Reininger, M. (2020). Three different measures of graduates’ instructional readiness and the features of preservice preparation that predict them, Teacher Education, 72 (1), pp. 56–71.
[160] Bastian, K. C.; Sun, M.; and Lynn, H. (2019). What do surveys of program completers tell us about teacher preparation quality? Teacher Education, 72, pp. 11–26
[161] Ronfeldt, M.; Schwartz, N.; and Jacob, B. (2014). Does pre-service preparation matter? Examining an old question in new ways, Teachers College Record, 116 (10), pp. 1–46.
[162] Bastian, K. C.; Lys, D. B.; and Whisenant, W. R. L. (2023). Does Placement Predict Performance? Associations Between Student Teaching Environments and Candidates’ Performance Assessment Scores, Teacher Education, 74 (1), pp. 40–54.
[163] Ronfeldt, M. (2021). Links among teacher preparation, retention, and teaching effectiveness. National Academy of Education Committee on Evaluating and Improving Teacher Preparation Programs. National Academy of Education.
[164] Goldhaber, D.; Krieg, J.; and Theobald, R. (2020). Exploring the impact of student teaching apprenticeships on student achievement and mentor teachers, Research on Educational Effectiveness, 13 (2), pp. 1–22.
[165] Goldhaber, D.; Krieg, J.; and Theobald, R. (2020). Effective like me? Does having a more productive mentor improve the productivity of mentees? Labour Economics, 63, 101792.
[166] Ronfeldt, M.; Bardelli, E.; Truwit, M.; Mullman, H.; Schaff, K.; and Baker, J. C. (2020). Improving Preservice Teachers’ Feelings of Preparedness to Teach Through Recruitment of Instructionally Effective and Experienced Cooperating Teachers: A Randomized Experiment, Educational Evaluation and Policy Analysis, 42 (4), pp. 551-575.
[167] Matsko, K. K.; Ronfeldt, M.; Nolan, H. G.; Klugman, J.; Reininger, M.; and Brockman, S. L. (2020). Cooperating teacher as model and coach: What leads to student teachers’ perceptions of preparedness? Teacher Education, 71 (1), pp. 41–62.
[168] Ronfeldt, M. (2021). Links among teacher preparation, retention, and teaching effectiveness. National Academy of Education Committee on Evaluating and Improving Teacher Preparation Programs. National Academy of Education.
[169] Joseph, R. (2023). ATAR’s rising relevance: admission standards and completion rates, Analysis Paper No 44, Centre for Independent Studies.
[170] AITSL (2021), ‘What is a teaching performance assessment?’, https://www.aitsl.edu.au/deliver-ite-programs/teaching-performance-assessment
[171] Commonwealth Department of Education (2021), ‘Next Steps: Report of the Quality Initial Teacher Education Review’, https://www.education.gov.au/quality-initial-teacher-education-review/resources/next-steps-report-quality-initial-teacher-education-review
[172] Louden, W. (2015). Standardised Assessment of Initial Teacher Education: Environmental Scan and Case Studies, A paper prepared for the Australian Institute for Teaching and School Leadership (AITSL), February 2015.
[173] Bastian K. C. and Lys D. L. (2016). Initial findings from edTPA implementation in North Carolina. https://publicpolicy.unc.edu/wp-content/uploads/sites/107/2016/10/Initial-Findings-from-edTPA-Implementation.pdf
[174] Bastian K. C. (2018). edTPA in North Carolina: Early evidence on candidate performance and predictive validity. https://epic.unc.edu/wp-content/uploads/sites/1268/2021/08/edTPA-ResearchBrief-2018-r3_Final.pdf
[175] Chung, B. W. and Zou, J. (2022). Teacher Licensing, Teacher Supply, and Student Achievement: Nationwide Implementation of edTPA, EdWorkingPaper, Annenberg Institute at Brown University, pp. 21-440.
[176] Chen, B.; Cowan, J.; Goldhaber, D.; and Theobald, R. (2021). From the Clinical Experience to the Classroom: Assessing the Predictive Validity of the Massachusetts Candidate Assessment of Performance, Working Paper No. 223-1019-2, Center for Analysis of Longitudinal Data in Education Research.
[177] Vagi, R.; Pivovarova, M.; and Barnard, W. M. (2017). Keeping Our Best? A Survival Analysis Examining a Measure of Preservice Teacher Quality and Teacher Attrition, Teacher Education, 70 (2), pp. 115-127.
[178] Garrett, R. and Steinberg, M. P. (2015). Examining Teacher Effectiveness Using Classroom Observation Scores: Evidence From the Randomization of Teachers to Students, Educational Evaluation and Policy Analysis, 37 (2), pp. 224-242.
[179] Kane, T. J.; Taylor, E. S.; Tyler, J. H.; and Wooten, A. L. (2011). Identifying effective classroom practices using student achievement data, Human Resources, 46 (3), pp. 587–613.
[180] Kane, T. J.; Rockoff, J. E.; and Staiger, D. O. (2007). What does certification tell us about teacher effectiveness? Evidence from New York City, Economics of Education Review, 27, pp. 615-631.
[181] Grissom, J. A. and Loeb, S. (2017). Assessing Principals’ Assessments: Subjective Evaluations of Teacher Effectiveness in Low- and High-Stakes Environments, Education Finance and Policy, 12 (3), pp. 369-395.
[182] Grossman, P.; Cohen, J.; Ronfeldt, M.; and Brown, L. (2014). The Test Matters: The Relationship Between Classroom Observation Scores and Teacher Value Added on Multiple Types of Assessments, Educational Researcher, 43 (6), pp. 293–303.
[183] Gill, B.; Shoji, M.; Coen, T.; and Place, K. (2016). The content, predictive power, and potential bias in five widely used teacher observation instruments, (REL 2017–191). Washington, DC: U.S. Department of Education, Institute of Education Sciences, National Center for Education Evaluation and Regional Assistance, Regional Educational Laboratory MidAtlantic. Retrieved from http://ies.ed.gov/ncee/edlabs.
[184] OECD (2019). TALIS 2018 Results (Volume I): Teachers and School Leaders as Lifelong Learners, OECD Publishing, Paris.
[185] Gill, B.; Shoji, M.; Coen, T.; and Place, K. (2016). The content, predictive power, and potential bias in five widely used teacher observation instruments, (REL 2017–191). Washington, DC: U.S. Department of Education, Institute of Education Sciences, National Center for Education Evaluation and Regional Assistance, Regional Educational Laboratory MidAtlantic. Retrieved from http://ies.ed.gov/ncee/edlabs.
[186] Ronfeldt, M. (2015). Field Placement Schools and Instructional Effectiveness, Teacher Education, 66 (4), pp. 304-320.
[187] Boyd, D. J.; Grossman, P. L.; Lankford, H.; Loeb, S.; and Wyckoff, J. (2009). Teacher Preparation and Student Achievement, Educational Evaluation and Policy Analysis, 31 (4), pp. 416-440.
[188] Bastian, K. C.; Sun, M.; and Lynn, H. (2021). What Do Surveys of Program Completers Tell Us About Teacher Preparation Quality?, Teacher Education, 72 (1), pp. 11-26.
[189] Bastian, K. C.; Sun, M.; and Lynn, H. (2021). What Do Surveys of Program Completers Tell Us About Teacher Preparation Quality?, Teacher Education, 72 (1), pp. 11–26.
[190] Feuer, M. J., Floden, R. E., Chudowsky, N., and Ahn, J. (2013). Evaluation of teacher preparation programs: Purposes, methods, and policy options. Washington, DC: National Academy of Education.
[191] Aldeman, C. and Mitchel, A. L. (2016). No Guarantees: Is it Possible to Ensure Teachers Are Ready on Day One?, Bellwether Education Partners, February 2016.
[192] von Hippel, P. and Bellows, L. (2018). How much does teacher quality vary across teacher preparation programs? Reanalyses from six states, Economics of Education Review, 64, pp. 298-312.
[193] Goldhaber, D.; Liddle, S.; and Theobald, R. (2013). The gateway to the profession: Assessing teacher preparation programs based on student achievement, Economics of Education Review, 34, pp. 29-44.
[194] Koedel, C.; Parsons, E.; Podgursky, M.; and Ehlert, M. (2015). Teacher preparation programs and teacher quality: Are there real differences across programs? Education Finance and Policy, 10 (2), pp. 508-534.
[195] Mihaly, K.; McCaffrey, D.; Sass, T. R.; and Lockwood, J. R. (2013). Where you come from or where you go? Distinguishing between school quality and the effectiveness of teacher preparation program graduates, Education Finance and Policy, 8 (4), pp. 459-493.
[196] Gansle, K. A.; Noell, G. H.; and Burns, J. M. (2012). Do student achievement outcomes differ across teacher preparation programs? An analysis of teacher education in Louisiana, Teacher Education, 63 (5), pp. 304-317.
[197] Henry, G. T.; Bastian, K. C.; Fortner, C. K.; Kershaw, D. C.; Purtell, K. M.; Thompson, C. L.; and Zulli, R. A. (2014). Teacher preparation policies and their effects on student achievement, Education Finance and Policy, 9 (3), pp. 264-303.
[198] Goldhaber, D.; Liddle, S.; and Theobald, R. (2013). The gateway to the profession: Assessing teacher preparation programs based on student achievement, Economics of Education Review, 34, pp. 29-44.
[199] Boyd, D. J.; Grossman, P. L.; Lankford, H.; Loeb, S.; and Wyckoff, J. (2009). Teacher Preparation and Student Achievement, Educational Evaluation and Policy Analysis, 31 (4), pp. 416-440.
[200] Ronfeldt, M. and Campbell, S. L. (2016). Evaluating Teacher Preparation Using Graduates’ Observational Ratings, Educational Evaluation and Policy Analysis, 38 (4), pp. 603-625.
[201] Bastian, K. C.; Patterson, K. M.; and Pan, Y. (2018). Evaluating Teacher Preparation Programs With Teacher Evaluation Ratings: Implications for Program Accountability and Improvement, Teacher Education, 69 (5), pp. 429-447.
[202] Bardelli, E.; Ronfeldt, M.; and Papay, J. (2021). Teacher preparation programs and graduates’ growth in instructional effectiveness, Tennessee Education Research Alliance Working Paper Series, 2021-01.
[203] Ronfeldt, M., and Campbell, S. L. (2016). Evaluating teacher preparation using graduates’ observational ratings, Educational Evaluation and Policy Analysis, 38 (4), pp. 603-625.
[204] Ronfeldt, M., and Campbell, S. L. (2016). Evaluating teacher preparation using graduates’ observational ratings, Educational Evaluation and Policy Analysis, 38 (4), pp. 603-625.
[205] Boyd, D. J.; Grossman, P. L.; Lankford, H.; Loeb, S.; and Wyckoff, J. (2009). Teacher Preparation and Student Achievement, Educational Evaluation and Policy Analysis, 31 (4), pp. 416-440.
[206] Gansle, K. A.; Noell, G. H.; and Burns, J. M. (2012). Do student achievement outcomes differ across teacher preparation programs? An analysis of teacher education in Louisiana, Teacher Education, 63 (5), pp. 304-317.
[207] Henry, G. T.; Purtell, K. M.; Bastian, K. C.; Fortner, C. K.; Thompson, C. L.; and Campbell, S. L. (2014). The effects of teacher entry portals on student achievement, Teacher Education, 65 (1), pp. 7-23.
[208] Plecki, M.; Elfers, A.; and Nakamura, Y. (2012). Using evidence for teacher education program improvement and accountability: An illustrative case of the role of value-added measures, Teacher Education, 63 (5), pp. 318-334.
[209] Fahey, G. and Koester, F. (2019). Means, ends and meaning in accountability for strategic education governance, Working Paper No 204, OECD Education Working Paper Series, OECD Publishing, Paris.