

Foreword
The average family with dependent children today faces critical financial problems. Mothers increasingly find it necessary to enter the workforce to keep the family’s standard of living at a level which satisfies the needs of their children. Not surprisingly, our fertility rate is the lowest in our history and the welfare and socialisation of children is at a low ebb. Fundamental to the family’s current financial problems are radical changes to the manner in which the costs of raising children are acknowledged in the tax and welfare systems today, compared with a generation ago.
The beginning of the century saw the introduction, in Australia, of a centrally-determined industrial wages system predicated on the proposition that an adult male wage (the Basic Wage) should be sufficient to support a dependent wife and three children. At mid-century, official recognition that dependent children should be taken into account in incomes policy was adapted to increasing taxation by introducing tax deductions for major expenses associated with raising children. In the last three decades, however, official policy has shown ambivalence regarding the status of children within the tax/welfare system. The presence of children in a household is now given only selective recognition in welfare policy and, in comparison with the past, minimal consideration in the tax system.
Taxation systems in most developed countries have, in the last half century, changed, and changed again, both in the principles and practice of family taxation. Behind the changes have been oscillations in convictions about the the proper unit of taxation—whether it should be the individual or the couple/family—and of the propriety of giving recognition to expenses incurred on behalf of children in a ‘fair’ system. There has been a marked shift in two directions, reflecting and precipitating profound changes in the economic and sociocultural life of the family—a shift of tax burdens, proportionally, from taxpayers without to taxpayers with dependent children, and of income support from families with children to the various categories entirely dependent on welfare. The movement away from family income support is especially marked for middle-income families (Steuerle 1997).
There is a theory in economics that justifies this situation on the grounds that taxation should no more alleviate the costs of rearing children than it does the costs of purchasing any other good, such as a boat. To have a child is, in this view, to voluntarily acquire a ‘private good’ for one’s own satisfaction and, it is argued, cannot justly impose an obligation on others to subsidise one’s consumer choice. The distinguished economist Henry Simons gave classic expression to this perspective when he said: ‘It would be hard to maintain that the raising of children is not a form of consumption on the part of parents.’ (Simons 1938: 140)
A complete and detailed answer to this position is outside the scope and intentions of this study, but a number of factors relevant to accepted tax and welfare considerations argue against its face value acceptance.
First, income-sharing within families, if combined with the taxation principle that income should be taxed in the hands of the beneficiary of that income, indicates that a component of any household income should be imputed to each family dependent for taxation purposes. This principle underlay the old system of tax deductions for family members.
Second, the principles of horizontal equity and ability to pay require that the size of a household be taken into account in determining its tax contribution.
Third, as the state expects parents to care for their children and there are penalties for those who abandon, neglect or abuse their children, the state should not establish conditions which impede the capacity of parents to fulfil those obligations. When parents fail or die, the state is ‘parent’ of last resort, and must find the funds to meet that responsibility in tax revenue. Consideration of the immense expense and impracticability of the state caring for all children demonstrates the efficiency of ensuring that families retain their economic capacity to rear offspring.
Fourth, there is no inherent inequity in child tax concessions between those with or without dependents at a particular point in time if we take a life-cycle view of taxation benefits and liabilities. At some time in our lives we are all child dependents and we all, therefore, share in tax concessions made available to families. Temporal and intergenerational long-sightedness is required in the assessment of tax equity.
Fifth, raising children is arguably ‘a form of production’ rather than ‘consumption’, and all societies have, as a condition of their survival, an interest in supporting the successful production of children. Children have societal and not just personal utility. This utility can fail to materialise if parenting is undermined.
Over the last two decades in Australia, multiple problems of child neglect, poor education, crime, and low fertility have become ever more manifest, demonstrating the scope for uncertainty in the renewal of human capital. Similar developments both in family taxation and in family functioning have occurred contemporaneously in the United Kingdom, the United States and elsewhere. These signs of the family’s failure are almost certainly in part due to novel disabilities and disincentives created by changes in our tax and welfare systems in the course of the 1980s.
The history of family taxation in Australia, and the character of its latter-day vicissitudes, are the concern of this study. An understanding of the past and the linkage of policy changes to subsequent outcomes shed light on possible reparative strategies for the future. A careful consideration of the wrong directions taken indicates the need to embrace principles in direct opposition to the modern categorisation of the bearing and rearing of children as a form of ‘private consumption’.
Barry Maley, Director, Taking Children Seriously programme, The Centre for Independent Studies
The family income problem
It cannot be disputed that a family unit consisting of husband, wife, and children requires a higher disposable income than does a single person without dependents if it is to maintain a comparable standard of living for its members. An income that means wealth for a single person will leave a family of five somewhat short of comfortable. A comfortable income for a single person will maintain a family in little more than poverty. This is obvious. What is not necessarily obvious is that herein may reside an inherent problem for income distribution in industrial societies. The interactions of wage-control, taxation and family welfare payments in the history of 20th century Australia indicate a continuing need for family income protection and support.
In the late 19th century, when no specific provision for families was made in wages, tax or welfare, poverty was identified with having dependent children in a family (Rowntree 1901), and a great deal of charitable work was generated to meet their condition of need. In Australia, the first 20th century appearance of a balanced solution to the family income problem came with the Harvester Judgment of 1907. This introduced, at the national level, a regulated and indirect method of wages manipulation to meet family needs, with provision for higher ‘family’ earnings than for single (child-free), on a roughly category basis.
The Basic Wage for an adult male wage earner, who was expected to be a family man, was the benchmark. There were progressively lower rates of pay below the average age of marriage, which was in the upper 20s for much of the century. There were also lower rates based on sex, on the grounds, generally correct at that time, that women earners were without dependents.
An alternative to differentiating wages according to putative family earner status is for the tax system or welfare payments to take on the role of redistribution according to the same principle. This was the major course taken from the 1950s to the 1970s. Child Endowment was initiated in the 1940s as a response to the increasing taxation of moderate wages during World War II, and was followed in the 1950s by the introduction of a comprehensive assortment of tax deductions and rebates predicated on family dependency. With redistribution via the tax system well-developed, the use of the Basic Wage as a differential for family and dependent-free earners was, in the course of the 1960s and 1970s, largely abandoned. The age gradient was drastically diminished and the sex differential was formally eliminated.
The need to support family incomes as such appeared to be forgotten in the 1980s. Between 1975 and 1980, the tax deductions which had provided for the family were withdrawn, and increased Child Endowment, now called Family Allowance, became the chief means of family support. But from the early 1980s, the value of the Family Allowance became, with inflation, increasingly unrealistic, while families paid tax at the same rate as other taxpayers at equivalent wage or salary levels.
The effect of the abandonment of family income protection was to throw the family into a state of financial crisis. This has since been handled piecemeal, via proliferating but selective welfare payments which are ‘targeted’ so that only those at the lowest levels of income receive realistic recognition of the costs of their dependent children. As we shall see, because redistribution now occurs from higher to lower incomes regardless of the burden of child dependency, a vicious cycle has been created which drives poverty progressively up the family income scale.
In the era of Child Endowment and tax deductions, policy assumed that families, like earners without dependents, should retain a range of incomes, reflecting the socioeconomic status of the earner. A couple’s decision to rear a family should not condemn them to a standard of living utterly different from their current one. By contrast, the effect of tax and welfare policy today is that a large proportion of families must raise children at the lowest common level of welfare-provided income, regardless of initial differences in earner status.
Family income protection for most of the present century was so contrived that family income could essentially be provided by one wage-earner within the family unit, the husband and father, while the wife and mother took primary responsibility for the rearing of children and for the domestic economy. Only in the last two decades, largely in response to economic pressures resulting from the abandonment of policies protective of family income, have mothers entered the workforce in substantial numbers, thereby providing a second source of needed family income.
The abandonment of universal family income protection in the 1980s was accompanied by the introduction of childcare funding for working mothers of pre-school children. As a result, the balance in child-rearing choices was changed. The Child Endowment and tax deductions of earlier years can be seen as a policy enabling the family to care personally for its children. Their substitution by childcare funding of various kinds can therefore be seen as a policy of discouraging care by the mother and promoting extra-familial or state child-rearing. This change was implemented despite the fact that most Australians continue to believe that mothers of pre-school children are better at home full-time, and that those of older children should work at most part-time (Evans 1995).
Childcare payments have become increasingly generous since the time of their introduction, but equivalent support has not been made available for mothers who care for their children themselves. This suggests the espousal of a principle that only if parents are willing to relinquish the care of their infant children to strangers so that both parents can work in the market economy, are they worthy of income protection.
It is now questionable whether this policy is in the interests of the children themselves, of families, or of the society at large. There is growing sociological, psychological and epidemiological evidence that as the family has moved away from the earlier model of the father as breadwinner and the mother as full-time child rearer, the socialisation of children and their personal well-being have suffered (Devery 1991; Bennett 1994; Maley, Berger, Morgan et al. 1996; Sullivan 1997).
Thus the family’s need for a higher disposable income, in conjunction with the sociocultural advantage of domestic specialisation by the mother, appears to create something of a make or break nexus for the flourishing of industrial and post-industrial society. Satisfaction of the problem of the ‘living wage’ for families is necessary to enable parents to raise first-class future citizens, and requires no more than recognition of all family members as citizens and life-cycle taxpayers.
The analysis that follows demonstrates the degree of our current failure to achieve this requirement and plots the errors of policy which have brought us to this condition. It thereby elucidates the criteria that must be observed if we are to re-achieve adequate family income protection.
Part A
The current situation and how we got here
A brief history of taxation 1890–1950[1]
The income needs of both family and child-free earners were, on the whole, satisfactorily accommodated throughout the first 70 years of the 20th century in Australia. To understand this achievement, it is necessary to review briefly our taxation history.
Taxation in Britain in the 18th and 19th centuries was largely a consumption tax on luxury items, thus sparing those with moderate and low standards of living. But from the mid-19th century taxes were extended beyond luxury goods to include essential food items—flour, sugar, rice and tea—and also alcohol and tobacco, the luxuries of the poor as well as the wealthy. Income tax and land tax began to assume importance in England from the 1870s, but at first only touched the affluent. They were proportional—‘flat rate’—taxes, which nevertheless meant that the wealthier pay more than the less wealthy by virtue of larger income or property.
Following in this pattern, customs duties were the mainstay of Australian taxation until World War I. Customs and excise revenue was allocated to the Commonwealth Government at Federation in 1901, with an obligation to disburse at least three quarters of its yield to the States. South Australia introduced the first real income tax in Australia in 1884. It was progressive—Australia is noted for its early use of progressive taxation—with rising rates to an upper limit, and had a high threshold for exemption of ₤300, so that only high income earners were taxed. Income tax was introduced in New South Wales and Victoria in 1895. Tax on company income and dividends also appeared in these decades.
Taxation in the 18th century was justified in terms of benefit received. As government was largely concerned with protection of property, this justified the practice of taxing only the wealthy. But in the 20th century, with the growth of Labour politics, government began to be seen as an instrument of social intervention with obligations to all levels of society. ‘Ability to pay’ became the generally agreed principle for allocation of taxation to yield the larger revenue required for these purposes, and hence the commitment to progressive taxation. This reflected the egalitarian politics of the time, and became ingrained in Australian culture. In keeping with this principle, the Commonwealth government under Labour introduced a national land tax to fund Old Age Pensions in 1910.
In 1915, during World War I, the first national income tax was introduced. In 1928, the threshold for Commonwealth income tax was ₤300 p.a., and the States also levied income tax with a threshold of ₤200, at a time when the Basic Wage was ₤52 per annum. Thus incomes at up to four to six times minimum wages paid no tax at this time. In 1940, during World War II, the Commonwealth threshold was lowered, under Labour, to ₤200 p.a., still more than three times the Basic Wage. In 1942, the states yielded all income tax to the Commonwealth, and in 1943, in response to the cost of war, the threshold was reduced to ₤105 p.a., less than double the basic wage. (Smith 1993)
The Basic Wage: protecting family income
‘The principle of a living or basic wage was propounded as far back as 1890 by Sir Samuel Griffith, Premier of Queensland, but it was not until the year 1907 that a wage as such was declared by a Court in Australia. The declaration was made by Mr Justice Higgins, President of the Commonwealth Court of Conciliation and Arbitration, who defined the standard of a “fair and reasonable” minimum wage for unskilled labourers as that appropriate to “the normal needs of the average employee living in a civilised community”. The rate declared by the President in his judgment (known as the ‘Harvester Judgment’) was . . . the amount considered reasonable for “a family of about five” (ABS Labour Report 1968 & 1969:143).
The judgment of Justice Higgins in 1907 that the Basic Wage ought to provide for the needs of a man and his wife and three children living in ‘frugal comfort’ was made viable by a system of wage inequality, together with the absence of income tax even at quite comfortable levels of income. Prior to the 1950s, the female adult wage was generally about 55% of the male adult wage, and there was a steep gradient in youth wages (which persisted into the 1970s) reaching down from the mid-twenties to the early teens. Thus a differentiation in final income between individual and family earners was achieved, at some social cost in atypical family situations, using wage differentials based on age and sex roles, without resort to redistribution via tax exemptions or welfare disbursements. Widows pensions were introduced by the States in the 1920s and by the Commonwealth in the 1940s, so that women did not have to support families on single-earner wages.
Initially, the Basic Wage was adjusted quarterly in proportion to the retail price index, and on it were built the various awards for skilled occupations. During the late 1930s and 1940s, however, the principle on which it was assessed changed subtly from simply reflecting the living costs of a family to incorporating (via ‘prosperity loadings’) ‘the highest amount which the economy could sustain’ (Smith 1993). However, its value soon became less than was required to provide adequate living standards for a Harvester Judgment family of five.
Virtually from the moment income tax bit into even moderately high male wages, the need for palliative action on behalf of family incomes became apparent. State income taxes in the late 1920s began at four times the Basic Wage, and child endowment schemes began in the States at about the same time. When the Commonwealth brought income tax down to moderate income levels in 1940, it was in tandem with a National Child Endowment scheme established the following year. To fund Child Endowment, the Menzies government introduced payroll tax, which stipulated that 2.5% of employers’ payrolls went to a National Welfare Fund for Child Endowment. This was, of course, a new strategy for the redistribution of earned income to family earners.
The Commonwealth’s introduction of Child Endowment coincided with a pegging of the Basic Wage by the Arbitration Commission, thus demonstrating the impact of wage and taxation levels on the need for other means of protection of family income. All earners were taxed at the same rate, but Child Endowment allowed the Basic Wage to be set at a lower level than was adequate for a family of five. Child Endowment was not paid for the first child, indicating that the Basic Wage was now considered sufficient for a family with one child. It was paid on a per child basis and thus marked a first step in the direction of fine tuning family income protection to family size.
The Horizontal Equity Principle 1950–1975
In 1950, the Commonwealth Court of Conciliation and Arbitration raised the adult female basic wage to 75% of the male rate. Conversely, the adult male Basic Wage was no longer pitched sufficiently above the requirements of a single person to be adequate for an average-sized family. In the same year a Child Endowment payment of 5/- for the first child in a family was introduced, in addition to the 10/- per subsequent child to the age of 16, but nevertheless the value of Child Endowment was not maintained in a period of relatively high inflation. For a family with two children, it represented about 7.5% of adult male Average Weekly Earnings (AWE). Further measures were needed to provide adequate family income protection.
Income tax was at that stage highly progressive. In 1955, for example, there were 18 rising marginal rates above the level for Average Weekly Earnings, beginning at 19% and rising to a top marginal rate of 67% (the equivalent of about 19c and 67c in the dollar, respectively). The Liberal Government of the period introduced an array of deductions geared to the actual financial costs of dependents. Deductions (which reduce gross taxable income), set at ₤104 for a dependent spouse and ₤65 for each dependent child aged less than 16, were introduced. Additionally there were deductions with moderate maximum levels for costs of medical, dental and chemists’ bills, health and life insurance premiums, council and water rates, educational expenses (fees, books, clothing)—all essential major expenses which are multiplied by dependents.
The outcome of the combined use of progressive marginal rates and family-related tax deductions was that high-income child-free earners paid more tax than high-income family earners, who paid more tax than low-income family earners, who paid less tax than low-income child-free earners.
This system virtually eliminated taxation for average-sized families earning up to double the Basic Wage. Tax deductions plus Child Endowment meant that, in 1950, a married man on Average Weekly Earnings with two children paid tax at an effective average rate of minus 3.3%. A man in the same situation on three quarters Average Weekly Earnings paid minus 7.5% (see Appendix 2). In the absence of taxation, the Basic Wage was adequate for average family needs. Deductions for dependents were raised regularly in response to inflation, but nevertheless their value fell somewhat over the years. As higher education became more common, the maximum age for deductions for dependent children was raised. The economic viability of the family was also promoted by low home loan interest rates set by the Commonwealth (3.9% in 1952, 4.5% in 1953-55, and 5% in 1956-60) and the direction of considerable funds into Building Societies for funding of home loans (Murphy 1995).
As the 1950s and 1960s progressed, the adequacy for families of the Basic (later the Minimum) Wage became increasingly dependent on the operation of these tax exemptions. Child Endowment was allowed to languish and there was no increase in payments until the early 1970s. The comprehensive package of deductions went a long way towards ensuring similar living standards for average child-free earners and families, and an income tax system which nominally reached into the lower levels of earnings was made compatible with adequate family income protection.
To begin with, tax rates for most income levels were low compared with present-day standards. The tax taken from an earner without dependents rose dramatically in the 20 year period from 1955 to 1975. The net income tax paid by an earner without dependents on Average Weekly Earnings rose from 6% in 1955 to 9% in 1965, to 17% in 1975. The net tax paid by an earner without dependents on twice Average Weekly Earnings rose from 14% in 1955, to 20% in 1965, to 34% in 1975 (see Appendix 2).
Average-income families were well-protected from this rise, but by 1975 higher-income families were paying tax at a high rate by the standards of previous decades. A Harvester Judgment family (three children) on Average Weekly Earnings, and counting in Child Endowment, paid minus 7%, minus 5%, and 3% in these same years, while the contributions from a family of five on twice Average Weekly Earnings were minus 1%, 3%, and 22%, respectively. At all levels the differential between child-free and family taxation was considerable, and for both families and child-free earners, despite progressive taxation, final income rose with rising earnings.
The social ethic behind the Menzies approach to family income protection, seen in the choice of tax differentials rather than direct disbursements, can be construed as nurturing the financial independence of the family unit and emphasising that, for the family as well as the earner without dependents, income should derive directly from work effort and achievement. This is in marked contrast with today’s welfare approach which compensates entirely for large differences in earned income among families, obliterating much of the relationship between personal effort and income.
Losing the balance: the removal of horizontal equity 1970–1985
In the early 1970s, changes occurred in wage structures and attitudes to the family that eventually led in the 1980s to the use of welfare rather than wages and taxation as a ‘solution’ to the family income problem.
Over the five years from 1969 to 1974, the principles and practice of differing rates of pay for males and females were philosophically rejected and bureaucratically eliminated. In 1969, the Commonwealth Conciliation and Arbitration Commission endorsed the principle of equal pay for equal work under federal awards. Its introduction was to be gradual, and completed by January 1972. In the National Wage Case of 1974, adult females under Federal awards were granted the same minimum wage as adult males, to be phased in in three stages, and this was shortly replicated by State tribunals. The differentials between youth and adult wages were also greatly diminished.
The equal pay reform meant the elimination of the Harvester ‘living wage’ solution of ensuring higher incomes for families than for individuals without disrupting the work value/wages relationship as a total package (and so makes recent calls for a ‘living wage’ like that of 1907 entirely unrealistic1). Initially it created an unfavourable costs to productivity ratio, as female wages were brought into parity with male, rather than both being set at an intermediate mean. A sharp rise in unemployment followed, together with a large growth in part-time employment and the introduction of employment practices which sought to avoid the on-costs of wages (e.g. employing under casual conditions). To avoid further increases in unemployment, the government adopted an accommodating monetary policy, and inflation followed.
To add to these problems, the Whitlam government’s welfare and social programme was expensive and rising unemployment increased its cost. In the following years, taxation rose steeply, affecting both business and workers. Higher revenue from PAYE income tax was achieved by default as inflation and bracket creep drove high rates of taxation further and further down the income scale. Taxation policy from 1975 to 1985 was acknowledged as being in a state of increasing confusion (Wilkes 1980). Smith comments:
By the mid-1970s . . . the relentless increase in income taxation was destabilising the economy . . . Now not only professionals but wage earners too, were raising their wages demands to anticipate the effects of the income tax system on after-tax wages . . . Higher wages paid by employers in turn added to unemployment, and in particular, inflation.
By the 1980s, the Australian taxation system was . . . widely perceived to be economically destructive in its effects on production, consumption, saving and investment decisions. The tax burden . . . shifted substantially towards those with a lesser capacity to pay . . . (Smith 1993: 105, 97)
In 1980, the number of marginal rates was reduced to three and rates at the top end of income were reduced from 60c to 48c in the dollar in an attempt to reduce tax evasion (Matthews 1980). But middle and low incomes now attracted tax rates originally designed for the comparatively wealthy. In 1950, a salary attracting the highest marginal rate was 32 times or 3,200% AWE, and in 1960, 1400% AWE, but in 1980 the highest marginal tax rate was imposed at only three times or 300% AWE. Australia was close to proportional taxation, and the percentage of their wages taken from relatively low income earners had increased dramatically.
Re-emergence of the family income problem
Tax deductions for dependents and family expenses, the then major source of family income protection, were largely withdrawn between 1975 and 1980. The shift in the taxation burden towards lower levels of earnings as a result of bracket creep made protection of family incomes increasingly necessary, but in fact the movement of policy was in the opposite direction.
The use of deductions from taxable income was criticised at this time because the value of exemptions for a given expenditure on dependents was thereby higher for higher-income than for lower-income earners—an effect of their higher maximum tax rates. (Nevertheless, in a context of progressive tax rates, higher income earners with families still paid more tax than lower income earners with families.) In 1976, the per-child tax deductions were abolished and in compensation Child Endowment, renamed Family Allowance, was raised considerably—for example, from a little under $200 p.a. to over $700 for a family with three children (see Appendix 2, Table 3). The value of per-child tax deductions for a similar family with average earnings had been about $720 p.a., so such a family was about $200 p.a. worse off.
The Family Allowance, as a flat-rate per-child payment without an upper income-threshold, was of equal value for high- and low-income families. At the same time, the dependent spouse deduction was changed to a rebate (a direct deduction from tax), also making it of equal value at all income levels. By 1980, the remaining deductions for family expenses (for educational, medical and housing costs) had been removed.
A major effect of the change from tax deductions to Family Allowance was an overall diminution in family income protection, in that the tax exemption for middle- and higher-income families, in comparison with equivalent earners without dependents, was reduced. Families as a whole were left carrying a far greater percentage of the tax burden than had previously been the case. The gain to low-income families was not equal to the loss by middle- and high-income families, and the balance of contribution to taxation by family and child-free earners was shifted to benefit the latter.
If the intention was to pay for the rising cost of Social Security and other costs of government and to relieve the tax load on business by increasing revenue from personal taxtation, then this could have been achieved by increasing effective taxation for all taxpayers, rather than allowing the bulk of the increase to settle on family earners. Tax paid by earners without dependents on Average Weekly Earnings rose from 17% in 1975 to 24% in 1985, and on twice Average Weekly Earnings from 34% to 38%. But net tax (i.e. deducting the value of Family Allowance) paid by average family earners (with three children) on AWE rose from 3% to 13%, and on twice Average Weekly Earnings from 22% to 33%. Thus the differential between family and individual net incomes diminished at average income levels, and at higher levels became insignificant. This change was introduced without major public debate, and most Australians are unaware of its role in the financial difficulties with which middle-income families are still struggling.
Like Child Endowment before it, the Family Allowance was not indexed to the cost of living, and so provided a less resilient form of protection for the family than had the previous wage differentials and tax deductions. The Hawke Accord of the early 1980s promised the lowering of taxes in balance with lesser wage increases. But the lowering of tax rates was at the higher income levels, and did nothing specifically for family earners, whose taxes rose. In deference to family income protection, the pegging of wages by the Arbitration Commission coincided with a rise in the Family Allowance. But nevertheless the Family Allowance increased only 50% (Australian Bureau of Statistics Year Books), while Average Weekly Earnings rose 65%, between 1980 and 1985 (Australian Bureau of Statistics Labour Statistics).
For families, the new tax arrangements spelt financial difficulties. For those with aspirations to a family, the need to provide in advance was increased by the reduced prospect of assistance later, and this showed itself demographically in the deferral or abandonment of family formation. The average age of mothers at the birth of a child rose by five years in the course of the 1970s and 1980s, while the average age of fathers rose by six years, and the lifetime birth rate fell from 2.7 to 1.9 children per woman.
In existing families, increasing numbers of mothers entered the workforce, mostly part-time, to bolster family incomes. The total percentage of women in employment rose, and the composition of the female workforce changed, from the majority being younger women working full-time before having families, to a high proportion of older married women in part-time employment, whose wages supplemented their husbands’ earnings.
Feminists with policy influence opposed any measures to relieve the family’s financial troubles, other than provision of childcare assistance for mothers joining the workforce. This was in furtherance of their goal of equal employment levels for men and women as a prerequisite of female equality. Nevertheless, the desperate need of lower-income families on this regime became increasingly obvious, and child poverty emerged as a major issue for the first time in the 20th century. The next half decade saw the transformation of universal family income protection into welfare for poor families. In the process, lower income families were artificially pauperised.
Tax ebb and welfare flow 1985-1997
Changes to tax rates in the late 1970s and early 1980s diminished rather than increased vertical equity. In the aftermath of the Hawke Tax Summit of 1983, and of the Social Security Review of 1985-88, the number of marginal rates of taxation was raised slightly to five, but the highest rate applied at only 170% (less than double) Average Weekly Earnings. These conditions have more or less persisted, with a reduction to four rates and a top rate of 47c in the dollar in 1996/7, until the introduction of the GST.
Bracket creep continued to bring more middle-income earners into the highest taxation bracket, and the top rate applied at a mere 1.5 or 150% AWE in 1990, and in 1997 at 140% AWE (at $50,000 p.a.). To compound the problem of high tax at low incomes, the tax threshold, which in 1980 was set at about 30% AWE, fell to 18% AWE in the latter 1980s, and by 1997 had fallen further to 15% AWE (Tax Return Forms ‘S’ and Australian Bureau of Statistics Labour Statistics). For the majority of earners, taxation became virtually proportional, and in keeping with this development, the Medicare Levy, introduced in 1983, was proportional from the beginning.
‘With the focus of wage policy shifting to the “social wage”, the government explicitly linked wages, taxes and social security measures,’ says Smith (1993: 111). But in fact, policies for family income protection moved from the wage and tax to the welfare system, and were concentrated on a limited range of the lowest incomes. The concern moved away from the family as such to a focus on relief of poverty via welfare income.
Incomes policy in the 1980s, influenced by the report People in Poverty (Henderson et al. 1970) and the development of a ‘poverty line’ as an index, concentrated on bringing the lowest incomes in the community up to a base common level solely by the use of welfare payments. Initially these lowest incomes were the welfare pensions and benefits of the aged, the unemployed and sole parents. But in the course of the 1980s, with the withdrawal of family tax deductions, the post-tax incomes of increasing numbers of employed families fell below benefits levels and required welfare subsidy. The devastating effect on lower-income working families of high taxes combined with the withdrawal of family tax deductions and rebates prompted the Hawke Labor government’s promise of ‘no child in poverty by 1990’, a promise that has proved impossible to fulfil by the method chosen.
Welfare spurns the average working family
In 1985, the sole relic of universal family income protection was the Dependent Spouse Rebate (DSR), the continuance of which deferred to the needs of older couples rather than of child-rearing families. Family Allowances were the only remaining universal measure of family income protection. By 1990, despite inflation, the Dependent Spouse Rebate had not changed, and the Family Allowance, which had risen only slightly, was no longer universal: families earning about 200% AWE and above were no longer eligible.
To the original Family Allowance a whole battery of welfare-type Family Payments was added, allocated on a per child basis and targeted at low-income families. The family on 50% AWE (unlikely to represent full-time earning) with three teenagers, for example, was now eligible for an Additional Family Payment double that of the Basic Family Allowance, but this was not available to families on Average Weekly Earnings and above. The same family was also eligible for rent assistance and Austudy payments equivalent to three times the Basic Family Allowance. A similar family on Average Weekly Earnings received only an Austudy payment of less than the Basic Family Allowance for a student child aged over 16, while one on 120% AWE received none of these considerations. Both the latter families were required to pay in full the Medicare levy, from which the family on 50% AWE was now exempt.2
As the 1990s progressed, ever more pervasive welfare payments were required to maintain an ever higher proportion of families at a poverty line which many of the new recruits fell below only because of taxation of their earnings: ‘churning’ had become a systemic problem. By 1995, the disparity in aid to families at different income levels had increased. All families in which the mother was not earning were eligible for the Home Child Care Allowance, which had replaced the Dependent Spouse Rebate for families with children. But the Family Allowance had actually fallen in value for an eligible family with teenage children, and the family on Average Weekly Earnings was still not eligible for the Additional Family Payment, while its Austudy entitlement was only half that of a family on 50% AWE. In addition to Austudy, the family on 50% AWE received an Additional Family Payment of four times the Family Allowance and rent assistance at twice its value (Department of Social Security 1995). In 1990, a family on 50% AWE received four times the amount received by a family on AWE, and in 1995, three times as much. In 1990 it received six times the amount received by a family on 200% AWE, and eight times as much in 1995. (see Appendix 2, Table 3)
Lobbying by single-income families, comparing their unsubsidised situation with that of two-income families receiving childcare payments, resulted in some tax concessions for families with the return of a Liberal government in 1996, but the differential in tax paid by family and child-free earners remained small for average earnings and above, and unrealistic in relation to family costs. Although these many welfare payments to families represent considerable income transfer on behalf of children, the redistribution is almost exclusively in favour of low-income families, and is away from middle-income family earners as well as from earners without dependents.
Effect on average and higher family incomes
Household Expenditure Survey data for 1993/4 (Australian Bureau of Statistics 1996) show that, in total, couples with children paid as much in taxes as they received in government benefits. Large sections of the family earner group received almost nothing from this overall sum. Most of this family income support went to semi- or unemployed families as welfare benefits, not as income protection for earning families.
Between 1985 and 1995, the net tax taken from the family on Average Weekly Earnings steadied percentagewise, and even fell somewhat. But the small differentials between family and child-free earners at middle and higher income levels remained. The family with three children on 120% AWE in 1995 lost 20% of its income in tax, compared with 26% for an earner without dependents on the same income. (This compared with a 4% gain for the family and an 11% loss for the individual in 1965). And the family on 200% AWE lost 32% of its income in tax compared with a very similar 35% for an equivalent child-free earner.
In the course of the 1980s, family fiscal and welfare policy was shaped to encourage maternal employment as the only means of raising family spending power to match socioeconomic expectations. Families ineligible for extra Family Allowances were eligible for increasingly generous childcare funding in the 1990s, and the use of childcare over this period rose from 46,000 Commonwealth funded places in 1983 to 301,000 in 1996 (Australian Bureau of Statistics Year Books). The percentage of families with both parents in full-time work was 20% in 1988 and 24% in 1990 (Australian Bureau of Statistics Australian Social Trends).
Nevertheless, in a context of heavy taxation, the gains from maternal employment at lower income levels were inadequate for needs. The adoption of a system of targeted welfare, with payments withdrawn as total family earned income rose, meant that in a family with paternal wages of around Average Weekly Earnings, income brought in by the mother was of little benefit unless it was sufficient to bring total family income to well above the income ceiling for welfare benefits (between 100% and 120% AWE, depending on size of family). Considerable workforce participation by the mother was necessary to gain any advantage.
By the mid 1990s, after tax had been taken out and welfare paid, very little difference in disposable income technically remained for families across the range of earnings from 50% to 120% AWE, which takes in at least 75% of Australian families. Disposable incomes of ‘Harvester’ families across this range hovered just above the Unemployment Benefit for the same family. Where taxation deductions once provided relief across the full range of family incomes, targeted welfare payments were directed only at raising the lowest incomes to average levels.
Welfare policy has narrowed the focus of family income protection to one of poverty relief. The broader canvas of taxation policy, which nominally adjusts to ability to pay, leaves the factor of child dependency at every other level of income out of the equation. The difference in ability to pay of the earner with and without dependents is largely ignored. At the same time, welfare supplementation of earned family incomes has been largely (and deliberately) confounded with welfare provision for the semi- or unemployed.
Part B
Data of the Achievement and Loss of Horizontal Equity
Comparisons of Family and Child-free Incomes: Methodology
We can now look fruitfully at detailed figures of the tax and welfare regime in the half century from 1950 to 1997 in order to substantiate the claims made in the previous section. We will begin in the period in which horizontal equity was achieved primarily via taxation, but on a foundation of wage differentials favouring the family. We will then pass through a transitional period from the mid-1970s to the mid-1980s, ending with the present period of strictly targeted welfare payments against a background of non-differential wages and taxation.
Projections for reform must address the impact of changes in the rules and regulations of fiscal policy and social security. Surveys of household income, such as those conducted by the Australian Bureau of Statistics (ABS), are less appropriate for this purpose, for they can provide little insight into why particular changes in policy should lead to particular changes in outcome. Further, because they are samples and dependent on self-reporting, they pose problems of validity. Nor are they available for most of the period under consideration. Strategies devised by taxpayers to circumvent the effects of any set of regulations are also marginal to our concerns. It is important to consider what the rules project, as distinct from outcomes resulting from evasion of the rules—evasions which might not be sought if the rules were fairer.
The crux of the analysis that follows is a comparison of family and individual (that is, child-free) earners’ net incomes—that is, of disposable incomes after tax has been deducted and welfare payments have been added. To permit this comparison, calculations were performed on sample incomes at half-decade intervals employing the tax and welfare rules and provisions for the years from 1950 to 1997. Copies of the tax forms for PAYE earners for the period were obtained, and tax payable was calculated according to the instructions provided. Post-tax income for family earners was then amended by the addition of all direct subsidies and welfare payments available for a family of the chosen size at a number of given income levels, as garnered from a variety of reliable sources, historical and bureaucratic. Thus, a set of post-tax-plus-welfare (PTW) or disposable incomes was arrived at for further analysis and comparison.
Sample earnings
The first step in the process was to select appropriately representative pre-tax income levels in order to provide a picture of the comparative financial circumstances of a sufficient range and proportion of wage and salary earners. As our interest is primarily in the capacity of a husband working full-time to support a wife and family, adult male full-time Average Weekly Earnings in each of the target years was the obvious baseline figure, and this was converted in each instance into average annual earnings (AAE), since tax is calculated on gross annual income. This data is available from the Australian Bureau of Statistics, with earnings from the pre-metric years converted into dollars. All references to Average Weekly Earnings and wage and salary earners hereafter imply adult male full-time workers, unless otherwise stated.
The Basic Wage in 1950 and 1955 stood at 70% of Average Weekly Earnings. In 1960 it had fallen to 64%, and in 1965 to 58%. With this falling relationship likely to continue when the Basic Wage was replaced by minimum wages in 1967, it appeared appropriate to perform calculations on a pre-tax income set at 50% AWE for the years from 1965. The intermediate income of 75% AWE, which was not much above the Basic Wage in 1950, was calculated for the whole time period.
For the higher than average range, 200% and 300% AWE are frequently cited in wage studies. ABS Labour Statistics, however, show that so small a percentage of salaries have risen above the 200% AWE level since 1980, that incomes at this level are incidental to the general picture. In 1980, a man earning 300% AWE was in the top 1% of salary earners, and someone earning 200% AWE was in the top 5%. Thus 95% of wage and salary earners in Australia earned at 200% AWE or below in 1980. In 1990, again only 5% of salary earners were above 200% AWE, and in 1995 this had risen only slightly to 6%. For this reason, the upper limit of income chosen for tax and welfare calculations was 200% AWE. The most wealthy in this range earn perhaps four times the wage of the least wealthy. The 5% earning more are inconsiderable for general questions of family well-being within the taxation and welfare structure.
The numbers in the upper portion of the range are relatively few. Eighty-five percent of wage earners received 150% of AWE or less (putting only 10% between 150% and 200% AWE) in 1980, and this proportion rose to about 90% in 1990 and 1995, with only 5% of full-time adult males earning between 150% and 200% AWE. So the vast majority of Australian men earn within 50% of AWE on either side. Moving further down the scale, 75% earned 130% AWE or less in 1980, 117% or less in 1990, and 122% or less in 1995. Thus at least half of those earning above AWE today earn a mere 20% above it.
It therefore seemed appropriate to calculate taxation figures for earners on 120% AWE, as well as the intermediate figure of 150%, and to give earners at this level more prominence in the analysis than those on 150%, who represent a relatively small proportion of income earners. In 1990, approximately 30% of adult male full-time earners were at 75% AWE or below, with 5% at 50% AWE or below. The weekly and annual dollar earnings at each of these levels of Average Weekly Earnings across the half-century are shown in Table 1 of Appendix 2.
Earners with and without dependents
The concern of this analysis is with family income protection via taxation and welfare. The achievement of universal family income protection necessarily hinges on accommodation of family size, as the demands on an income increase with family size, and the portion available to each member decreases proportionally. It was therefore appropriate to base calculations on a family at the larger end of the spectrum, although one with sufficient incidence to be representative. Further, demands on family income increase with the ages of its children, and the impact of taxation and welfare provisions will vary in relation to the age of the child. As the high-cost stage of families is not avoidable, it is appropriate to base calculations on a family with older children of designated ages, as this represents a substantial proportion of the life-cycle of each family.
The average fertility rate of women in 1950 was three children. By 1990, this had dropped to two. But this under-represents the average family size, as not all women will have children. In 1993, 38% of families currently had one dependent child, 39% had two children, 17% had three children, and 6% had four or more children (Australian Bureau of Statistics Year Books; Sullivan et al. 1999). This makes a family of three dependent children an appropriate choice for analysis as it is at the larger end of the spectrum but nevertheless represents a substantial percentage of Australian families. Many of the 77% of one and two child families will go on to have more children. Thus, at any one point in time, over 20% of Australian families will have three or more dependent children.
In 1992, 43% of Australian households contained a couple and their dependent children and 9% a sole parent and dependent children. A further 43% contained a couple without dependent children, and 5% consisted of only single adults (Australian Bureau of Statistics Year Books). Child-free earners fall into three basic types: (a) younger people in the pre-family stage; (b) older people in the post-family stage; and (c) people across the age range who never have children. In all categories, many will be members of couples whose partners are also working full-time, each of whom is taxed as an individual but treated as part of a couple for welfare purposes. The number of child-free earners is probably at least as large as the number of family earners with three children. Sole parent families are not the subject of comparisons in this analysis.
Single-income family
The family earner group needs further definition. Our concern is with the ability of a family earner to support both wife and family, thus permitting full-time care of children by the mother when the age, number, or special requirements of children make this the parents’ best option in promoting their well-being. Thus, our family will be presumed to contain only one full-time adult earner.
It is, of course, increasingly common for both members of a couple with children to work, although one of these incomes, the wife’s, is more likely than not to be part-time. In 1997, average male full-time earnings were $36,000 p.a. and average family earnings were $42,000 p.a., indicating on average a fairly small contribution by employed mothers and/or a preponderance of family earners in the upper half of the middle group of wage brackets (WAA Newsletter 1998). That many mothers of two or three children work does not necessarily indicate that they do so out of choice, and it is not necessarily desirable that they should be forced to do so. The Australian Council of Social Services (ACOSS) Commission for the Future of Work (1997) was of the opinion that the family should not need to rely on a second income, nor on children’s earnings (many school children are now working), to survive financially or to maintain a reasonable standard of living.
In a family with three children, the mother’s part-time job often needs to be discontinued because of unforeseen family needs. This is so even with the family of older children, who continue to need supervision after school and whose emotional demands on the family are in many ways greater than when they were younger. Thus, it is appropriate to assume for the purposes of this study’s calculations that wives and children are not earning.
Nevertheless, given the smallish size of most families today, the retention of dependent offspring into what is virtually adult life, and the availability of part-time work, most mothers today will wish to engage in some paid work outside the home, at least once their youngest children are well settled into school. It is therefore reasonable, when we eventually come to assess the requisite levels of family income protection, to build into our calculations the expectation that mothers in two-parent families of moderate size will, shortly after their youngest child reaches school age, be able to contribute at least some few thousand dollars a year to family income.
Age of dependent children
In the early 1950s, Child Endowment was paid for dependent children to the age of 16. By this age, most children had left school and were in employment. As more extended education became increasingly common, tax deductions for dependent students were introduced, thereby reducing taxable income. The cut-off age rose to 22 in the 1960s, and to 25 for the Austudy welfare payments of the 1980s.
For the purposes of these calculations we have assumed that the three children of our target family are aged under 17 for the first two decades of the series, and thereafter that they are aged 12, 15 and 18. This takes into account the higher costs of older children, a fact recognised in taxation provisions in the 1960s and partially in targeted welfare payments in the 1990s.
Childcare payments and the special pre-school child payments of recent years do not therefore feature in the calculations. This is in part deliberate. Over the last two decades childcare subsidies have represented a form of family welfare. But as eligibility is predicated on the mother working, and substantial hours are necessary for significant benefit to accrue, it represents the channelling of revenue into the creation of a forced choice in family lifestyle. It therefore functions quite independently of mainstream tax and welfare provisions for horizontal equity. The comparative welfare of the two-income and the single-income family with pre-school children, which has been the subject of many invidious comparisons, is not the focus of attention here, but rather the treatment of the family as compared with the child-free earner.
Tax and welfare benefits
Appendix 1 lists the various deductions, rebates, subsidies, levies and family payments which have modified the raw tax rates at each half decade from 1950. As detailed in the previous chapter, from the mid-1980s a plethora of family payments began to impinge on a sub-set of earned family incomes, those below Average Weekly Earnings. These payments were successively modified and became indistinguishable from the child component of Unemployment and Sole Parent Benefits.
The major Family Payments introduced in the 1980s have been included in the calculations, but indirect and special benefits, routinely available to families on Unemployment Benefit and on 50% and 75% AWE, but not to families on Average Weekly Earnings and above, are not taken account of. Examples are phone allowances, rebates for water and council rates, and free car registration. Those who obtain a Health Care Card are eligible for free ambulance, free glasses, cheap medicine, rebates or waivers on electricity, half-fares on train, bus and ferry, and waiver of bond and first week’s rent for rental accommodation. These benefits could amount to $3,000 or more a year for a family with three children. There is also Rent Assistance for low-income families and this has been calculated for families on 50% AWE (and on Unemployment Benefit), but not for families on 75% AWE and above, who may aspire to home ownership and be paying off a mortgage for which no assistance is available.
These special benefits can put lower-income earners financially well ahead of those with higher initial incomes when, as we shall see, the major Family Payments themselves result in the virtual elimination of differences in disposable (post-tax+welfare) income across a range of earnings.
These then are our comparison groups—the family earner with a wife and three children, and both the single and partnered child-free earner (without dependents). The child-free earner comparison group presumes an earned full-time income at the disposal of that person. Our concern, for the purposes of analysis, is with the financial position of the family members dependent on one full-time salary, compared with that of the earner without dependents on the same full-time salary.
Family versus child-free incomes: A comparison of income trends 1950–1997
Loss of universal family protection
The following analysis of the family’s fate from 1950 to 1997 consists in the detailed examination of numerical data at five to ten year intervals across that period of nearly 50 years. Earnings at the various percentages of Average Weekly Earnings chosen for analysis were identified across the time period. Using these figures as a baseline, tax payable and welfare payments received at each of the selected levels of Average Weekly Earnings at each five year interval were calculated for both family and child-free earners and net tax payable obtained. Finally, the disposable or post-tax+welfare (PTW) income remaining to the family and the child-free earner at each level of earnings was calculated. These figures are reported in Appendix 2.
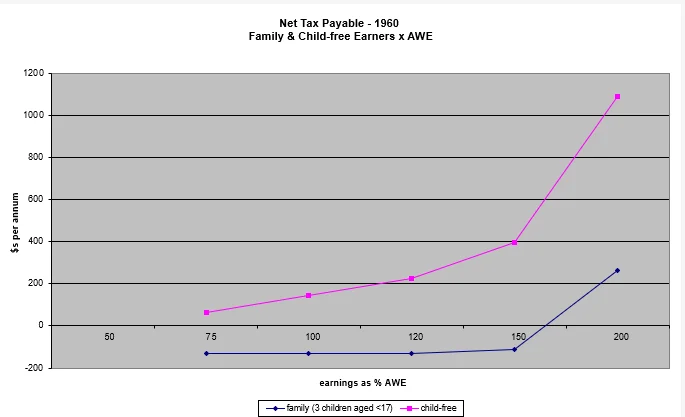
The trend revealed by the figures is more easily appreciated if the data are presented in graphical form. Figure 1 shows tax payable (ignoring welfare) by child-free and family earners at decade intervals from 1950, ending in 1997. It can be seen that from 1950 to 1970, families with three children and an income up to the level of Average Weekly Earnings paid no tax. In 1960, when the full array of family tax deductions was in force, virtual freedom from taxation for the average family extended up to 150% AWE. At all levels of earnings, child-free earners paid more tax than family earners. Although there was increasing disparity between tax paid by child-free and family earners as income rose, taxation was nevertheless remarkably progressive for family earners in the higher reaches of income.
Figure 1
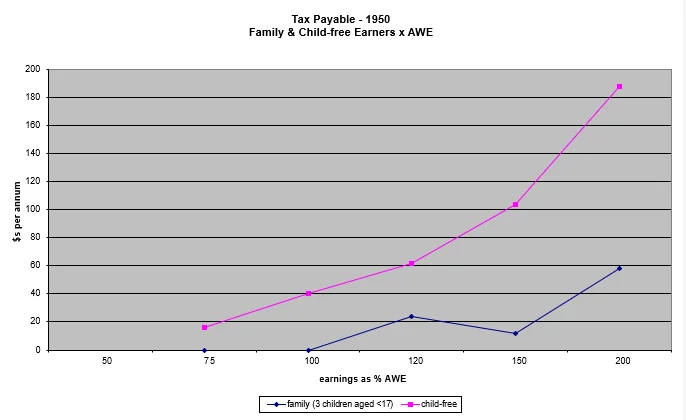
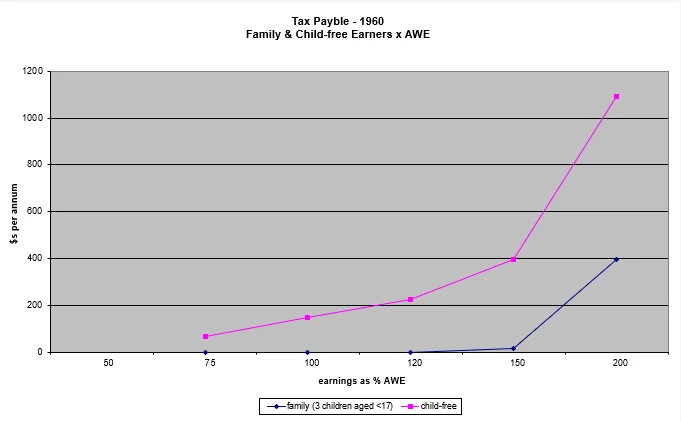
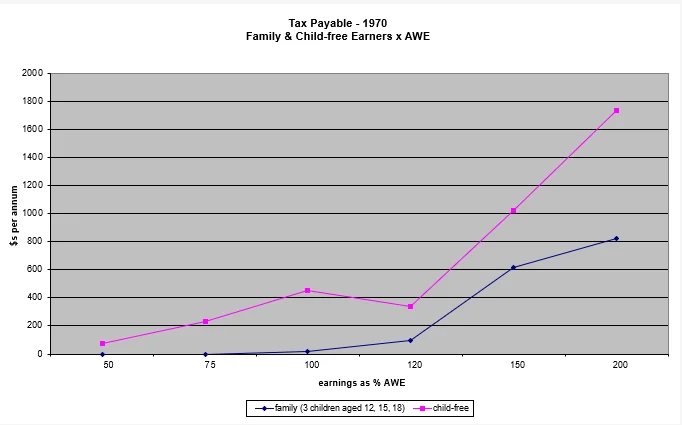
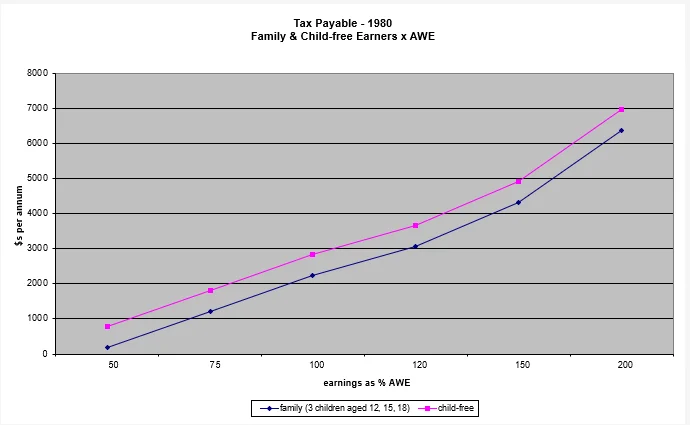
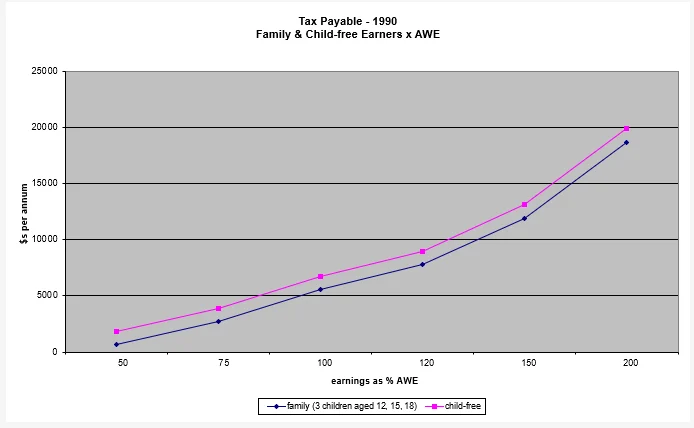
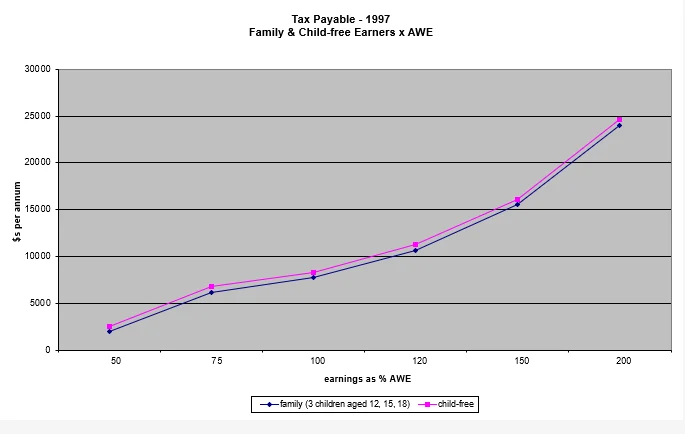
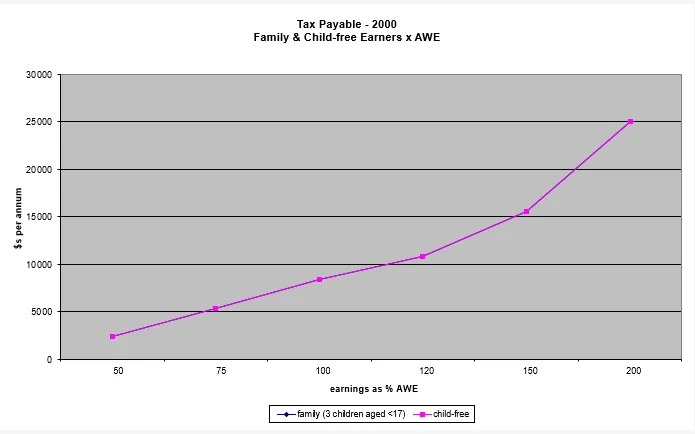
By 1980, however, the exemption of low to middle income families from taxation had disappeared, as a result of the increase in taxation at low levels of earnings and the abolition of child-related deductions and their substitution by the Family Allowance. This was at great cost to the child-free versus family tax differential. The tax benefit provided for families was now diminished to the flat rate of the Dependent Spouse Rebate (DSR), which replaced the previous deduction for dependent spouse. Low as well as higher family incomes were less protected than under the previous deductions system. Further, with each succeeding half-decade, as inflation raised the cost of living, the real value of the non-indexed Dependent Spouse Rebate decreased. The tax differential for family versus individual earners was vestigial in real terms by 1997, despite the introduction in that year of the ‘family tax initiative’, a small raising of the tax threshold on a per child basis. It can also be seen that taxation now no longer rose more sharply at higher income levels than at low.
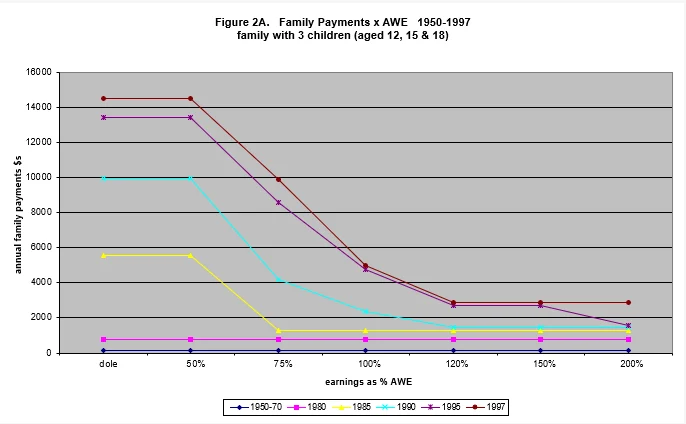
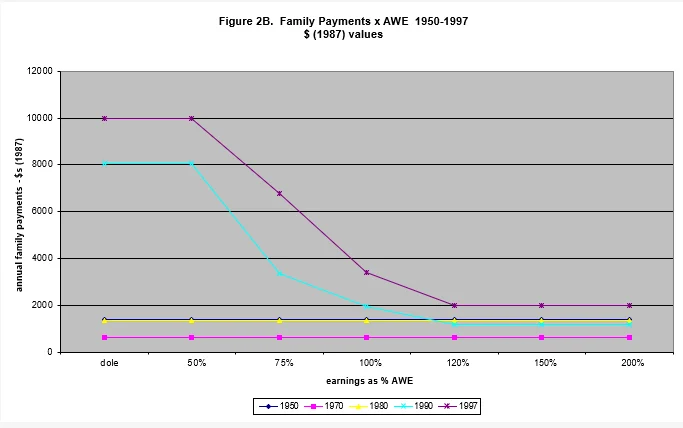
Figure 2 demonstrates changes in the pattern of Family Payments at the various levels of income across the half century (in actual dollars disbursed). As can be seen, payments to families—Child Endowment and then Family Allowances—from 1950 to 1980 were flat across the range of incomes. They were a universal measure, designed to promote horizontal equity between family and child-free incomes. They did not, as later, promote vertical equity between higher and lower family incomes. By contrast, in the 1980s and 1990s, there were increasingly larger Family Payments at the lower levels of income, diminishing rapidly as earnings rose above Average Weekly Earnings to an actual value little different from that of Child Endowment from 1950 to 1970, when wage differentials and tax deductions were the major instruments of family income protection. Between 1985 and 1990, Family Payments became primarily a welfare payment to low-income families. Family income protection across the full range of incomes was no longer a goal.
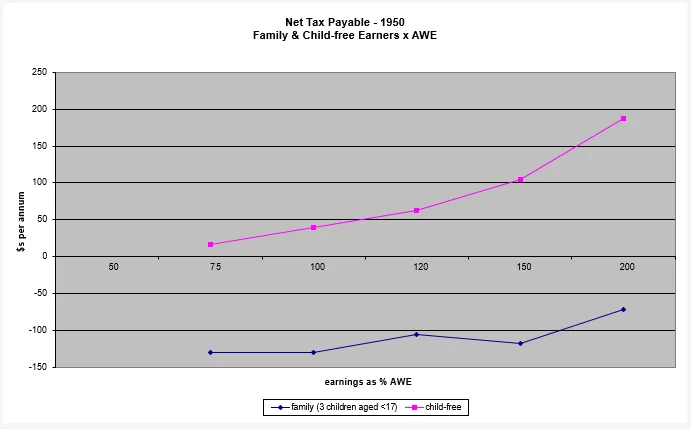
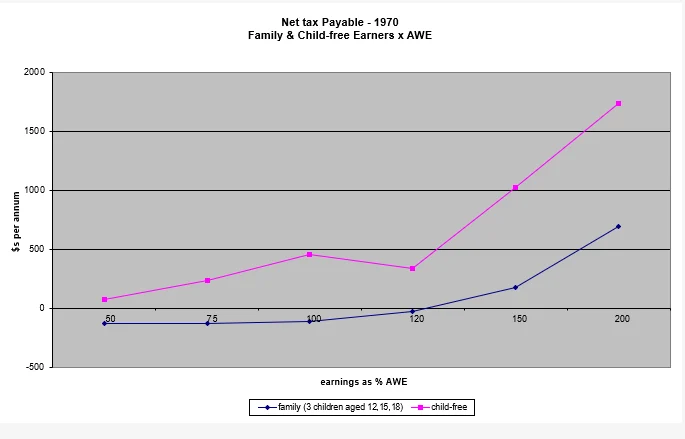
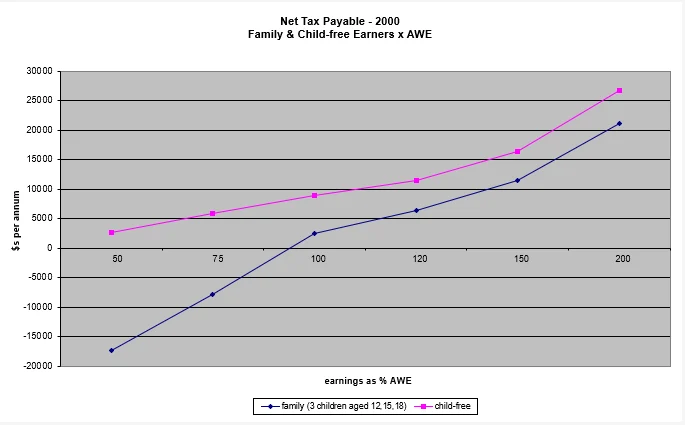
Net tax payable by family and individual earners (that is, when welfare benefits are subtracted from tax paid) from 1950 to 1997 is shown in Figure 3. In 1950, the combined effect of tax thresholds, graduated tax rates, deductions and Child Endowment was a rise rather than a loss of income even for family earners on 200% AWE paid no net tax, and this remained so up to 150% AWE in 1960 and 120% AWE in 1970. The slow rise in taxation of incomes of both types from 50% to 120% AWE was substantially flattened for family earners so that for them it was as if taxation only began well beyond AWE.
Figure 3
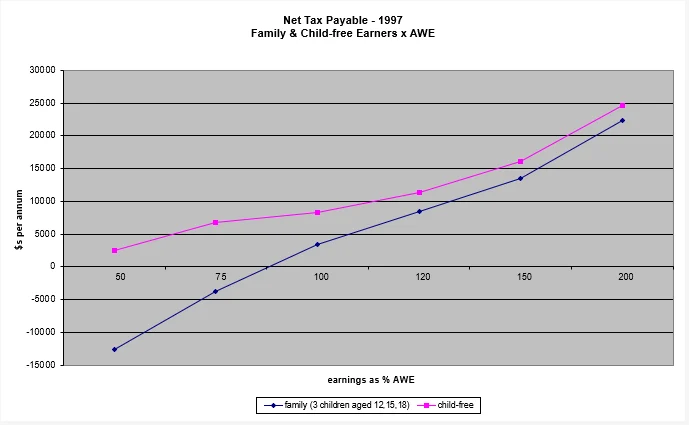
Thus universal tax deductions and Family Payments combined to provide income protection for the family. As we have seen, tax deductions played the major role in this outcome rather than direct Family Payments. Most wages were close to sufficient for most families’ needs, provided they paid little tax.
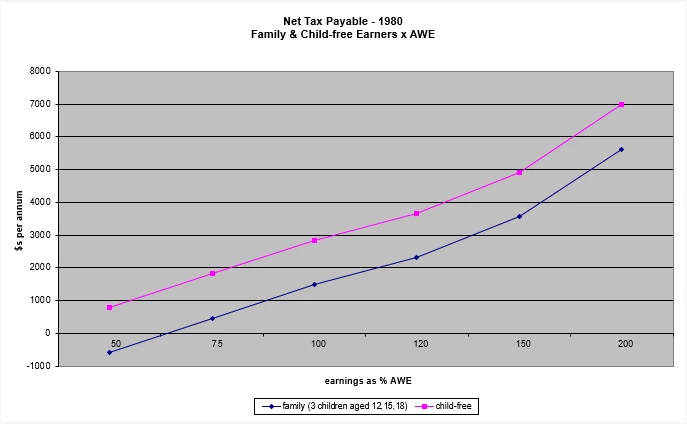
True to later criticisms, the disparity in net tax paid between child-free and family earners increased with rising income, although there was a sharp rise in net taxation for both child-free and family earners beyond 150% AWE. By contrast, in 1980, with tax deductions removed and a single universal Family Payment, the differential was uniform across income levels. This also meant that, proportional to income, at higher income levels family income protection was much reduced. Family earners had lost relative to child-free earners, and child-free earners at higher income levels had gained most.
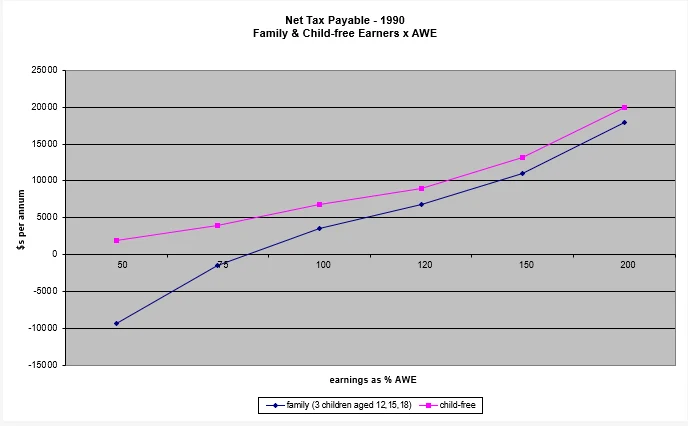
In the 1990s, a new effect appeared. Families below Average Weekly Earnings now received substantial additional income in Family Payments, so that tax-free incomes for families reappeared at incomes below Average Weekly Earnings. Substantial family income protection existed in the 1990s, but only by virtue of large welfare-style payments and only at the lowest income levels. Very large benefits were granted at 50% AWE, amounting almost to total tax paid at higher income levels. But as this low level of earnings was rare in fully employed workers (5% in 1990), and even more rare in mature earners with growing families, this recognition of the realities of family expenditure was limited to only a minority of Australia’s families. The majority of families in 1990 and 1997 were, technically, required to pay net tax at levels not very different from their child-free earner counterparts. They received little in Family Payments in recognition of their higher costs. The net tax figures demonstrate that family income protection as a universal measure in the 1990s had practically disappeared.
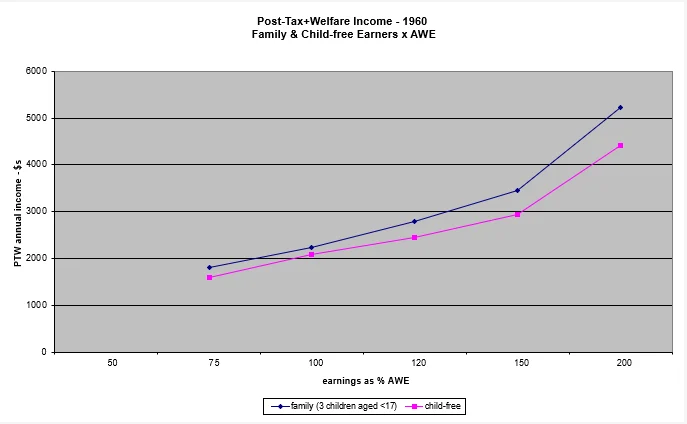
The loss of universal income protection for families is graphically demonstrated in Figure 4 which shows post-tax+welfare (PTW) incomes as a percentage of initial earnings in 1960 and at decade intervals from 1980. In 1960, the comparatively higher percentage of income retained by family, compared with child-free, earners was stable across the range of initial earnings, at about 15%. Thus percentagewise, higher income families were not advantaged over lower income families by the use of deductions. In 1980 when the flat rate Family Allowance had been substituted for deductions, family income protection was reduced at the higher levels of income compared with the lower, ranging from 20% to a mere 5% higher comparatively at double AWE. In 1980, Family Payments had boosted the after-tax income of the family on 50% AWE to 109% of initial earnings, but in 1990 the increase was to 164%, and in 1997 to 183% of actual earnings. As a result, in 1997 the difference in percentage of income retained between family and child-free earners at 50% AWE was 99% (183% compared with 84%), but it was only 16% at Average Weekly Earnings, a mere 8% at 120% AWE, and 5% at 200% AWE. Thus family income protection vis à vis earners without dependents became insignificant above AWE.
Figure 4
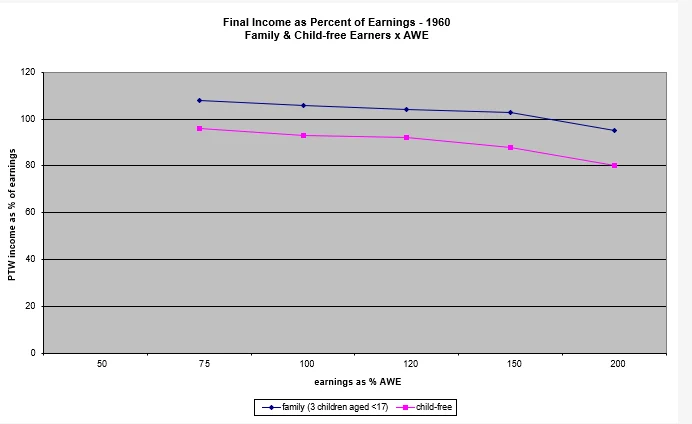
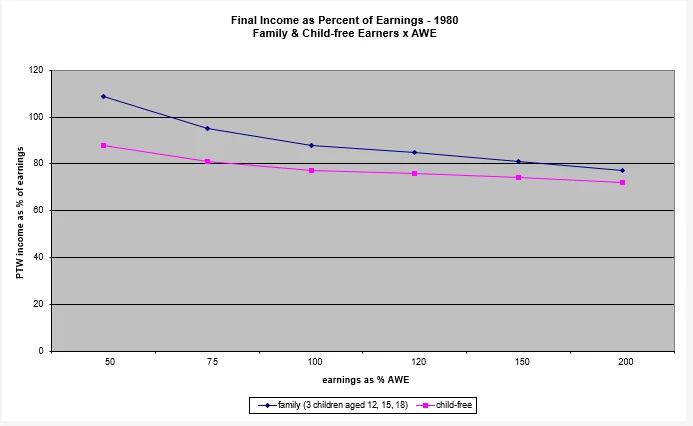
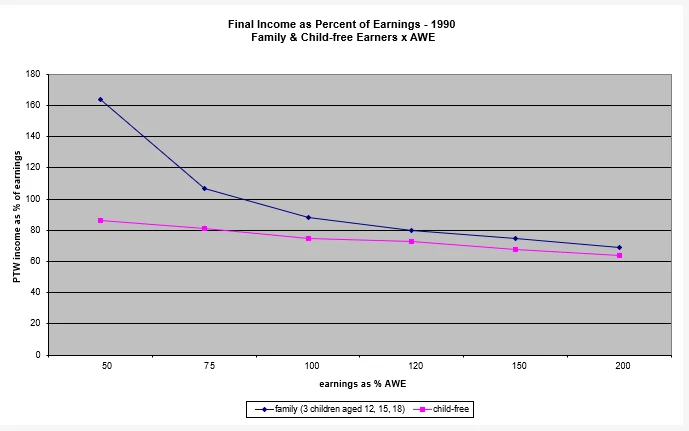
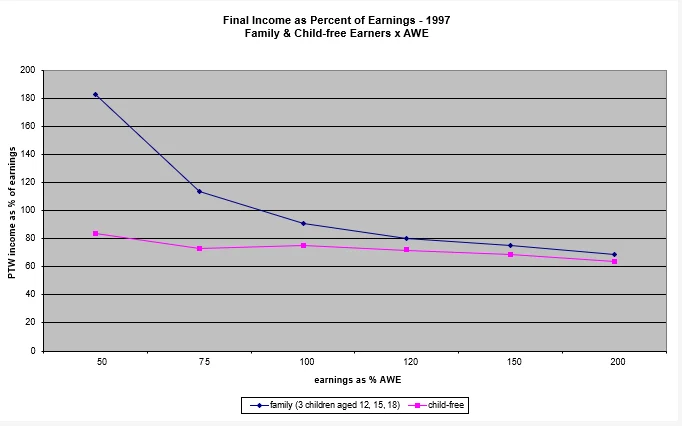
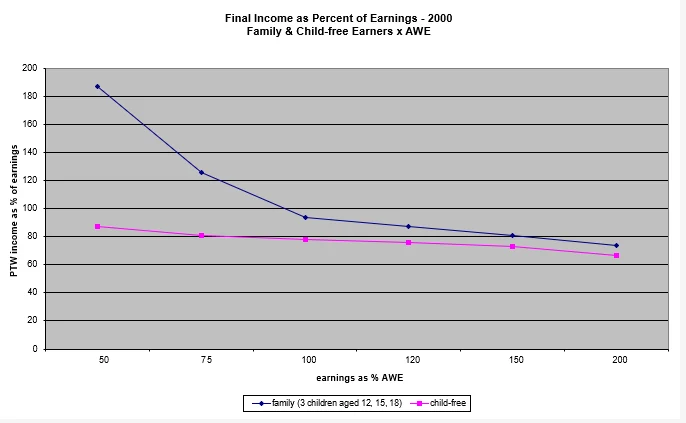
The elimination of family income protection in taxation made large welfare payments to low-income families essential as an anti-poverty measure. But as these graphs show, its meaning for moderate family incomes was ignored. An income of 120%, 150% or 200% AWE does not represent the same wealth or high income for a family as it does for an earner without dependents, but family income protection via either tax or welfare provisions was largely abandoned for this group.
The ACOSS Tax Reform Pack (1997) declared that, ‘The progressive income tax system is the keystone of Australia’s tax system. It is designed to take a greater proportion of income from taxpayers with a greater ability to pay.’ The sets of graphs in Figures 1 and 3 demonstrate that despite the formality of graduated tax rates, the present tax system is only halfway progressive in that it ignores the reduced ability to pay of the earner with dependents, compared with the earner without. It no longer incorporates the principle of horizontal equity.
Equalising income
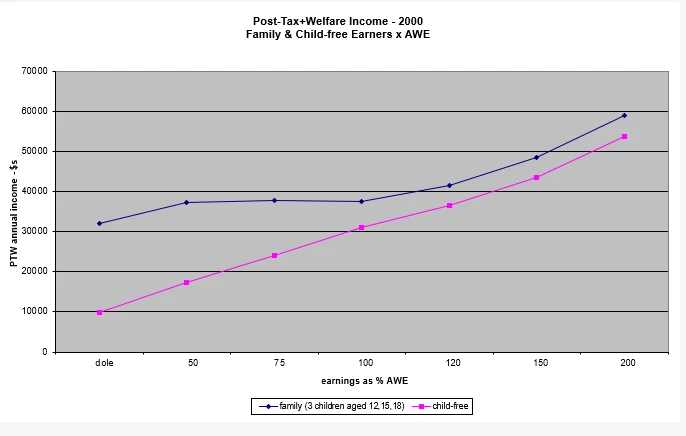
The mirror image of these developments in tax and welfare policy is seen in PTW income itself. Figure 5 shows PTW income for a family with three children and for child-free earners at decade intervals from 1950, ending in 1997.
In assessing the trends revealed, it should be borne in mind that they occurred against a background of diminishing adequacy of minimum and average post-tax income for family expenditure needs, due to the abandonment of the Basic Wage system and to the increase in the percentage of income taken by taxation. Thus a small gap between disposable income at male adult Average Weekly Earnings for a family and a child-free earner in 1950, at a time when the Basic Wage came close to the needs of a family of five and when the majority of child-free earners were in fact on a wage lower than that for adult males, does not indicate the same degree of inadequacy of average family disposable income that a similar proportional gap represents in 1995, when minimum earnings after taxation no longer attempted to represent a ‘family wage’.
Throughout the period from 1950 to 1997, it can be seen (Figure 5) that the PTW incomes of child-free earners, despite progressive taxation, show a substantial rise across the range of initial earnings, although one that is flatter than the rise in actual earnings. That is, the tax/welfare system did not impose equality of final incomes for child-free earners across any points in the range.
Figure 5
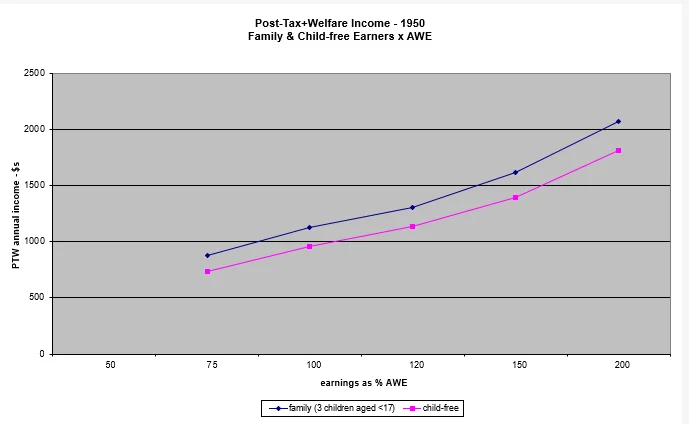
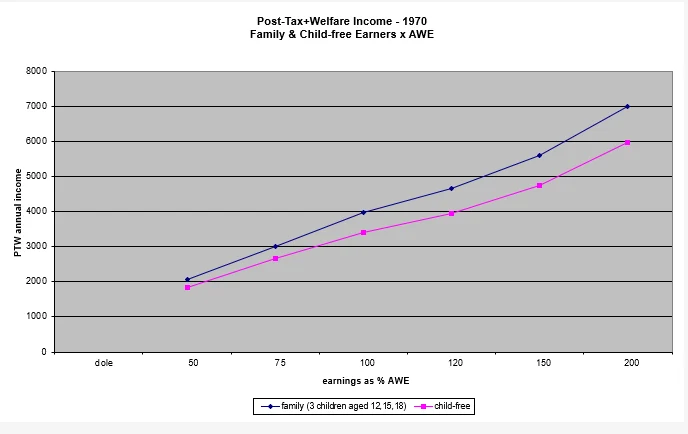
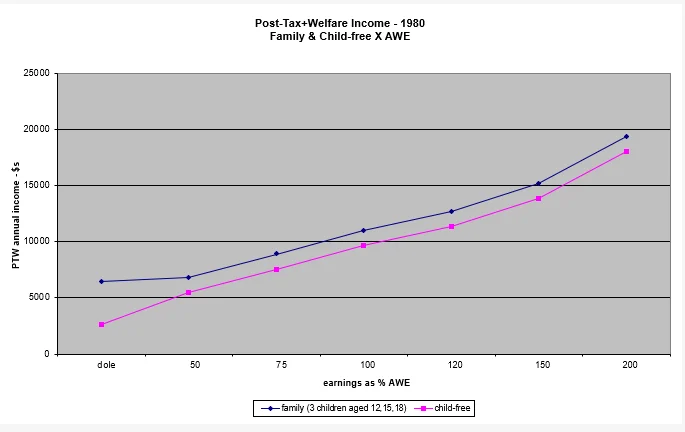
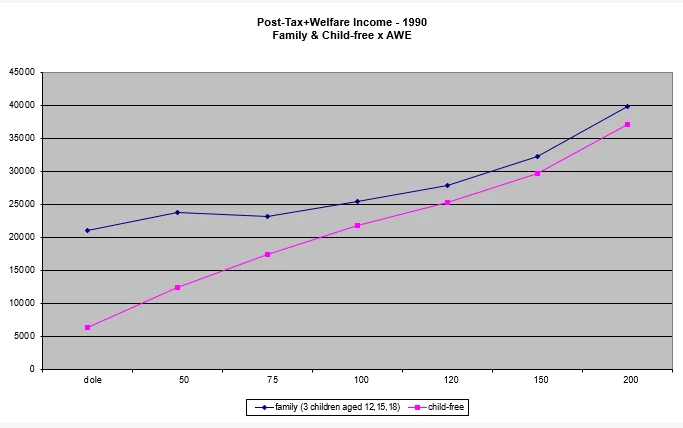
From 1950 to 1980 for family earners too, a fairly steady rise in PTW income is seen as earned income rises, and again the workings of progressive taxation can be observed in that the rise in family PTW income is flatter than that in actual earnings. Thus, until 1980, family and child-free earners fared similarly as regards vertical equity. But in 1990, in contrast to the situation for child-free earners, for family earners the rising gradient in PTW income shows signs of elimination for those below Average Weekly Earnings. And in 1997 it has technically disappeared across the income range from 50% to 120% AWE—that is, to the 75th percentile of full-time male earnings. (The dip in PTW income at 75% AWE appears because Rent Assistance is not incorporated in the calculation of Family Payments for this income level. If it were, the drop would flatten. The family on Average Weekly Earnings is not eligible for Rent Assistance.) The rising gradient reasserts itself only for the minority of family incomes above 120% AWE.
In taxation parlance, in 1997 Effective Marginal Tax Rates (EMTRs) across the range of family incomes to 120% AWE were close to or at 100%. This is no chance occurrence but the outcome of a carefully constructed integration of tapered welfare payments and tax rates. Referring to Table 5 in Appendix 2 for the actual figures, one can see that our family earner in 1997, whether earning $18,000, $27,000, or $36,000, had a post-tax income in the low $30,000s. If one takes into account the numerous indirect benefits available to very low income families but not included in the present calculations, and that the extra cost of employment is estimated at about $2,000 p.a., even the family with three children on the dole and receiving Unemployment Benefits plus maximum Family Payments nominally amounting to $27,000 was in much the same financial situation as employed families earning up to AWE, and families on 120% AWE or $43,000 p.a. were not much better off.
By contrast, even at 50% AWE, a child-free earner’s PTW income is well above the level of the single dole, and child-free earners maintain their relative positions in the income range as earnings rise. Higher-income family earners, too, are allowed some measure of increase. But it is not until a family with three children reaches the comparatively rare salary levels of 150% and 200% AWE that it can, technically, begin to lift its financial situation much above the level of families on unemployment benefit.
Thus, although a gradient in PTW income is permitted to all child-free earners and to higher income families, this is not the case for family earners across the lower to middle-income range.3 Families cluster in the middle income ranges in terms of earnings and so this levelling takes in a high proportion of families. Australian Bureau of Statistics figures for 1990 showed 55% of adult male full-time earners at between 75% and 150% AWE (Australian Bureau of Statistics Labour Statistics). At mid-decade, only one of the ten deciles of primary family earners accounted for wages above $50,000 p.a. (Apps 1995). Five lay between $30,000 and $50,000, three between $20,000 and $30,000, and incomes of less than $20,000 accounted for only one decile.
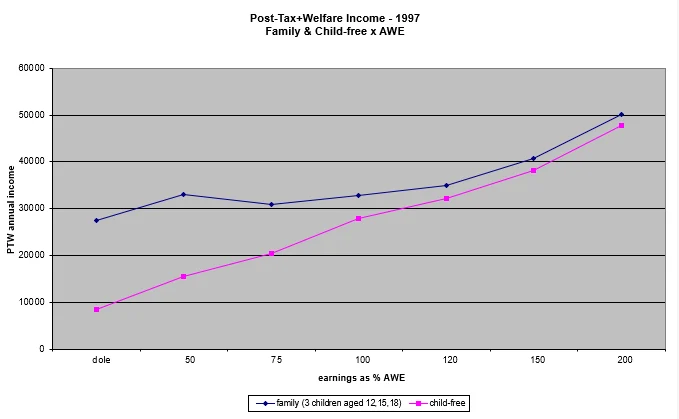
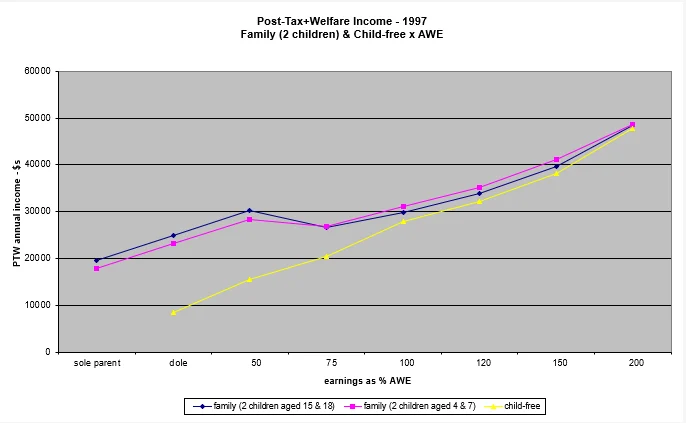
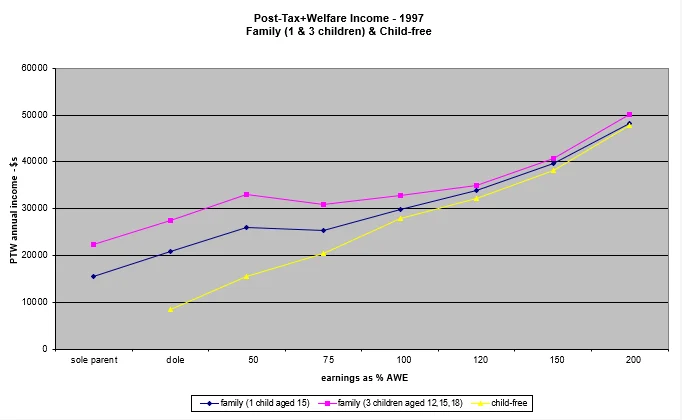
These effects are not, of course, confined to our sample family with three older children. Figure 6 shows PTW incomes for families with two young children (including pre-school), with two teenagers, and with one teenage child. Effective Marginal Tax Rates of 100% again appear between 50% AWE and Average Weekly Earnings. The family with two children—and therefore with lesser expenses than the family with three—can escape this compression at a slightly lower level of earnings, that is at Average Weekly Earnings rather than 120% Average Weekly Earnings. The family with one child can do so at between 75% AWE and Average Weekly Earnings. Thus all families are affected by the system, but the family with larger expenses is affected most.
Figure 6
The only government assistance that a middle-income family can access to escape this compression to welfare levels of income is childcare assistance, and this implies a mother in the workforce. Nevertheless, the average two-income family with the mother working part-time is caught in the same trap. The mother’s earnings are included in family income for purposes of assessing welfare eligibility, and so at the lower ranges of income the advantage of the mother’s earnings is largely lost due to the withdrawal of Family Payments. Only when the threshold of 120% AWE, about $43,000 in 1997, in combined earnings of husband and wife is passed can the family substantially improve its PTW income.
Thus the mother of pre-school children whose husband is on Average Weekly Earnings must work substantial hours if her access to childcare is to raise family income significantly. Our family of older children is not, of course, eligible for such aid, but the recourse of the mother working will have the same limited effects. Only if the husband in our family example is already earning around $43,000, or 120% AWE, can the wife’s earnings initially improve their disposable income. This explains the otherwise odd finding that lower-income primary earner families are least likely to supplement their incomes with a secondary (mother’s) income (Apps 1995). Work participation of a secondary earner is greatest at the middle-income levels where it begins to be advantageous. It falls after the primary earner’s income passes $50,000—that is, when it approaches the top decile of primary family earnings, suggesting that the higher rates of work participation at middle income levels are forced upon families by financial need rather than choice.
Like the changes to the tax system which removed family income protection, the acceptability of this outcome—that is, the engineering of equality of disposable income across the lower range of family earnings—was never publicly debated. Even if it were democratically approved, it hardly seems just to impose it on one section of the populace only. If we are committed to using taxation and welfare to equalise incomes, then surely this should be applied to all citizens, not just to families.
Overview
Whatever the intentions of policy development, current tax and welfare regulations since the late 1980s have meant that the majority of families with one parent full-time in the workforce will live at very little, if at all, above the level provided by welfare for the unemployed family. Families with very low earnings (probably the result of less than full-time employment) have their incomes raised to this level by Family Payments, while for moderately earning families taxation reduces income to below this welfare minimum and tapered Family Payments bring it back to the welfare level, but not above it. If Unemployment Benefit incomes are considered to be geared to poverty-line necessity, then the current workings of taxation and welfare could be construed as designed as far as possible to keep families, regardless of earnings, on the poverty-line.
In 1997, the ratios of PTW incomes of families earning Average Weekly Earnings and 120% AWE to the income of a family entirely on welfare benefits were a mere 1:1.2 and 1:1.3, respectively (Appendix 2, Table 7). These ratios diminish to 1:1.1 and 1:1.2 if the cost of earning a living is built into the calculation, so the difference is inconsiderable, perhaps even non-existent if the welfare family’s indirect benefits are accounted for. By contrast, the ratios of PTW incomes of child-free earners on Average Weekly Earnings and 120% AWE to the single Unemployment Benefit were 1:3.3 and 1:3.8, respectively—workers without dependents were more than three times times better off than those who were unemployed. Even the family earner on 200% AWE retained less than twice the family Unemployment Benefit, while child-free earners on 200% AWE had disposable incomes six times those of single persons on Unemployment Benefits.4
The essence of my criticism and analysis is not that it is wrong to bring the poorest semi- or unemployed families up to current welfare levels, on which many employed families live frugally but decently. It is against natural justice, however, to bring middle-income families with a range of earnings above this level uniformly down to this lowest common income level. The development of this problematic situation is largely due to the failure to maintain tax differentials as between family and child-free earners. Although both pay a higher proportion of their incomes in tax than they did two decades ago, family earner taxation has increased six-fold while child-free earner taxation has merely doubled.
A major effect of the move from universal tax exemptions to targeted welfare in the last decade and a half is, then, that we have a privileged child-free earner population relative to families. In contrast to previous decades, at higher wage levels they pay tax similar to that of family earners, who receive little in benefits. At all wage levels their post-tax income relative to the single dole is many times greater than an equivalent family comparison. Child-free earners are contributing a far lesser proportion of tax revenue compared with family earners than they did three decades ago.
The high EMTRs across the lower family income range are occasionally deplored for their disincentive effect on work effort. Semi- or unemployed parents gain little or nothing (except respect) by taking up low or average paying jobs, and lower-income employed parents may be tempted into semi- or unemployment. An employed father of three children told The Sydney Morning Herald (Horin 1996) that his family could barely live on his salary of $29,000 a year. ‘If my wages dropped lower,’ he said, ‘I would consider going on the dole.’ Our figures show that this was indeed a sensible assessment of comparative financial advantage.
The removal of work disincentive is only one reason for correcting this piece of injustice. It is scarcely desirable that fathers already working full-time should be induced to take two jobs or that mothers of young children should join the workforce to compensate for crushing taxation. It is in no one’s interests for parents to overwork and so neglect their children The just situation is one of family income protection for families across the range of earnings—in other words, horizontal equity.
Calculations of the costs of children
How much extra income does a family need to remain on a par financially, as a group and as individuals within that group, with an individual earner? In other words, what multiple of a child-free earner’s PTW income should the PTW income of a family earner represent? The answer will, of course, vary with the number and age of dependent children.
Current estimates of the comparative costs of single person and family households give some basis for assessing the adequacy of the small extra PTW income currently allowed to non-welfare-supported three-child families vis à vis child-free earners. Family Matters (1995) estimated that to remain on a par with an individual without children on Average Weekly Earnings of $33,000 in 1995, a family with two children needed to earn $60,000 p.a. (180% of Average Weekly Earnings), and a family with three children (all aged less than 18) needed 2.5 of AWE, or $73,000.
A common cost relativity used for household expenditure yields a similar outcome:
1st adult = 1
other adult = .6
each child = .3
For our family with three older children, which includes an adult dependent child of 18 (who as a student may have to be supported in a separate household), these add up to at least 2.8. That is, this family of five requires 280% of the PTW income of an equivalent child-free earner in order to enjoy an equivalent lifestyle.
The child-free earner on Average Weekly Earnings of $36,210 in 1997 retained a PTW income of $27,285. To enjoy similar financial comfort, our family of five on AWE therefore required a PTW income of $76,400. Reference to Table 6 in Appendix 2 reveals that none of our families, even those with an earned income of 200% AWE, approached this figure, and that all those earning less than 150% AWE had less than half this amount. Families at Average Weekly Earnings and above in all cases receive less than the 0.3 (30%) extra required for the expenses of a single child. Families on 75% AWE, who are large beneficiaries of today’s welfare payments, have a PTW income which is 150% that of child-free equivalent earners.
Actual dollar estimates of the cost of children have also been published by the Australian Institute of Family Studies, and these acknowledge differences depending on age of the child and on lower-income versus middle-income status of the family (Family Matters 1995). Using the Expenditure Survey Approach, it was estimated that the cost of three children (all aged less than 13, the highest age given) in 1995 was $23,598 p.a. Under current conditions, this would leave about $10,000 p.a. to be shared between the parents in all of our families up to 120% AWE. This was considerably less than the $15,000 unemployment benefit or old age pension for a couple. Parents in families with incomes of 150% to 200% AWE could equal but not exceed the adult pensioner income.5
An alternative approach discussed in Family Matters (1995) is the Basket-of-Goods estimate, which excludes the costs of housing, transport, school fees and uniforms, and medical and dental expenses. It indicates a cost of $19,680 for three children in a middle-income family, which means about $6,000 left over per parent for everyday personal plus major household expenses for those in the 100% AWE to 120% AWE range. For a lower income family, the children’s expenses are about $11,800, leaving parents in the 50% AWE to 75% AWE range personally much better off, with about $10,000 each.
For the first half of the 20th century the costs of children were realistically met by the Basic Wage system. The established ratio of family to child-free income was about 200%, in that the female Basic Wage was set at about half the adult male Basic Wage. The female adult earner was putatively responsible financially only for herself while the male was responsible for himself, a wife and three children. As we have seen, in the course of those 50 years, the Basic Wage fell in relation to family needs, and the shortfall was made up by the introduction of Child Endowment.
In 1950, when the female Basic Wage was raised to 75% of the male rate, Child Endowment for three children was equivalent to 18% of the male Basic Wage. As a result, minimum PTW income for a family of three children was about 165% of the minimum PTW income of an equivalent female earner (as representative of the child-free earner). With the addition of tax deductions for family dependents, the family earner with three children on AWE retained a PTW income which was 157%, and at 200% AWE one which was 150% of the post-tax income of an equivalent child-free earner. In 1960, with the full system of Menzies family tax deductions in place and with lower female and young adult wages still operative, a three-child family on the Basic Wage had an income of about 150% that of a female earner on the Basic Wage, while the family on 200% AWE retained approximately 180% of the income retained by an equivalent female earner. These differentials are substantial, but fall short of the 280% indicated for full equity. They perhaps represent a reasonable sacrifice by parents in exchange for the personal benefits a family delivers.
Following the introduction of equal pay in the early 1970s, the minimum wage ceased to function as an indicator of basic family-income needs, and an individual/family wage differential no longer operated across the range of earnings levels. By 1980, after the Fraser Government’s withdrawal of tax deductions, the income differential for our family versus a child-free earner (male or female) at Average Weekly Earnings had fallen to 14%, and at 200% AWE to 8%. In 1995, after the efforts of the Social Security Review and further tax reform, the differential rose slightly to 18% at AWE. But at 120% Average Weekly Earnings and at 150% AWE it was less than 10%, and at 200% AWE a mere 4%. These relativities were only slightly improved by the Howard Government’s reforms of 1997. (Table 8 in Appendix 2 gives dollar and percentage differences in family and individual PTW incomes across the period.) In relation to family earners, child-free earners on 120% to 200% AWE continue to be vastly privileged in terms of disposable income retained, compared with in 1950.
Only in welfare matters is the justice of a differential still realistically recognised. The Henderson Poverty Line is calculated according to household size and composition, and the cost of children on a per child basis is recognised in Family Payments for unemployed and low income families. But eligibility is carefully organised so that Family Payments will not raise final incomes above the level of full welfare benefits. In practice, this means that the substantial costs of raising children in families whose PTW incomes are above the level of welfare income are not accommodated.
Incomes policy since 1980, as administered through the welfare system, has compressed family incomes in the name of ‘social justice’. The 1990s system of minimal tax relief in compensation for essential expenditure on children (or in recognition of essential sharing of income among family members), together with the phasing out of Family Payments as earnings approach Average Weekly Earnings, entrenches the members of what proponents of ‘social justice’ term high-income families, in financial circumstances similar to those of very low income child-free earners.
A survey by Australian Family Circle (1996) found that for 36% of parents, the biggest issue facing their family was lack of money. Only 6% were most concerned about health, and only 12% about job security. In another survey, inadequate income topped the list of stressors for mothers of young families, but not for the elderly, single persons, or couples without children (Zimbardo 1992: 476)
Should taxation policy disregard the costs of children?
Family incomes policy currently expresses the assumption of such peak welfare bodies as ACOSS that horizontal equity is not a legitimate government concern. Criticism by ACOSS and by church representatives of the effects on ‘high incomes’ and on ‘low incomes’ of the GST have, for example, entirely disregarded the varying number of individuals who may be dependent on an income. There is no acknowledgment that what is nominally a high income may be a lower income on a per capita basis than what is nominally a low income. For example, a single person on $75,000 p.a. is indeed wealthy, but as the income of a family with three teenagers it represents only $9,000 per person post-tax, which is only a little above the single Unemployment Benefit. The members of a family on 120% AWE are worse off on a per capita basis than an child-free earner on 50% AWE. The wives and children of family earners are invisible in social justice discourse.
There are many denials of the inequity of this situation. It is argued that families are well-catered for because there are large revenue redistributions to families (Australian Bureau of Statistics 1996). At the gross level there are, but the redistribution is narrowly targeted. The majority of families receive far less than was taken from them in the first place. Estimates of redistribution to the family are exaggerated by the practice of crediting government outlays on health and education as redistribution to the family. Education and health care are services to the individual and are claimable by persons of any age. Indeed, families are now discriminated against where educational expenses are concerned, in that costs accrued by dependent children cannot be claimed as tax deductions, while those of child-free earners can.
The history of family income protection suggests that average earned incomes can be adequate for families if spared taxation. This in effect means exemption from contribution to the costs of public infrastructure and services. A temporary exemption of this nature can readily be justified on the grounds that the family wage-earner at this time is funding an infrastructure cost—the provision of care, support and socialisation for children—which is essential for building the human and social capital of the next generation.
As discussed in the introduction, a variety of arguments can support very different politico-moral stances on the provision a society should make for its members who are temporarily or permanently unable to provide for themselves—the aged, the disabled and children. Unavoidable, however, is the reality that the long-term nature of child dependency in the nuclear family demands some alleviation of the large burden for provision otherwise placed on the parents alone.
Family strategies to circumvent the loss of income protection
The current tax and welfare system has created a situation in which a large majority of children will be brought up either in financially depressed households, with per capita incomes at the lowest end of the income scale despite initial incomes well above this level, or else will suffer some degree of neglect as both parents work to raise family income above the plateau created by tapering of Family Payments .
This is not to say that some families have not been able to manipulate tax provisions so as to achieve higher PTW incomes than the regulations permit in straightforward cases. Income-splitting for the purpose of tax reduction is available to some categories of families. In 1997, higher salaried professionals were able to income-split by placing income-earning investments in the name of a spouse, or by incorporating their activities so that surplus income that they did not receive as an employee of their own company was taxed at only 36% (the company tax rate) rather than at the top personal rate of 48.5%. Self-employed families, typically tradesmen and their wives, can trade as partnerships and obtain the benefit of two tax-free thresholds, although only one spouse may be engaged full-time in the business.
Academics, professionals and higher level public servants can achieve large tax reductions by claiming deductions under the rubric of ‘the costs of earning a salary’ for expenditure on home office, travel for conference attendance, personal library, and so on. Such deductions not only reduce the amount of tax paid; they can so reduce ‘taxable income’ that a higher income family becomes eligible for welfare benefits such as Austudy. The regressive nature of these tax deductions, which were introduced at the same time as deductions for family expenses were abolished as regressive, was apparently overlooked by those likely to benefit from them most.6
Families without these options have been tempted to find their own more irregular solutions. The targeting and tapering of Family Payments means that there is little economic disadvantage if the father leaves the workforce entirely, so that the family becomes eligible for maximum Unemployment Benefit, Family Payments and numerous collateral benefits. This situation, of course, introduces considerable problems as regards motivation to earn, and encourages a malingering welfare dependency.
The following scenario was created by the current approach of withdrawing family income protection at moderate levels of income. A stable couple have three pre-school children. The man is employed, earning $36,000 p.a. (AWE). The woman stays at home to care for the children. The man’s level of earnings makes the family, if living together traditionally, eligible for only minimum family welfare benefits, $4,600 p.a. After tax, they have an annual disposable income of about $32,500. After the costs of the children are provided for, that leaves about $5,000 per partner for living expenses, less than the single dole.
To better their financial position without having to put the children in childcare the couple have adopted a slightly inconvenient strategy. They have ‘separated’ and the woman rents a house for herself and the children alone and does not declare her stable relationship with the father of her children. She is thereby eligible to obtain the Sole Parent Pension worth $18,500 p.a. plus valuable indirect benefits previously not available to the family. The man rents a room in a private house for $80 a week or $4,160 p.a. He still spends most of his free time with his family as a father, apart from sleeping elsewhere, but as a result of the outlay for an extra sleeping place, the family as a unit has an additional income of $9,740 p.a.
The family now has a disposable income of $43,000 p.a. This is worth the inconvenience of ostensibly living apart. But perhaps if the family had been allowed to keep a little more income, say the $36,000 of their initial earnings, they might have preferred to live together. And revenue would have been spared $10,000 net in welfare payments.
For the average honest working family, the only escape from the compression of family income is to somehow raise family earnings above the 120% AWE level, beyond which gains in net income can begin to occur. This can only be achieved if the father takes a second job, or the mother works, or both.
Feminist ideology and a personal desire to work did not alone move mothers into the workforce in substantial numbers. Comparatively rare in the 1970s, except in educated middle-class circles, maternal employment became common at all levels only in the 1980s when tax and welfare reform began eating into family incomes. The escalation in the disregard of middle-income family needs revealed in our figures of the 1990s was matched by an escalation in the use of childcare. Use of childcare increased only 9% between 1982/3 and 1987/8, but 24% between 1988/9 and 1993/4 (Bittman 1998)
Childcare funding has promoted this solution. Choice for Families, a community lobby group which came into being in response to the financial pressure on families who choose parent-care for their children, calculated that, in 1998, a two-parent, two-child, single-income family earning $30,000 p.a. (well below average weekly earnings of $36,000) received $4,368 p.a. ($84 per week) in government benefits. A two-parent, two-child family with both parents earning $30,000—a family income of $60,000, and about 170% AWE—received total government benefits of $8,580.7 The high income family received twice the benefits of the low income family. Yet surveys constantly show that Australians do not favour extended childcare for young children. Only 4% of Australians believe it is in children’s interests for their mothers to work full-time in the pre-school years—but 35% of mothers now do so (Evans 1995).
One of the effects of the financial stress the middle classes are under has been for them to take part-time service jobs of a semi-skilled nature which formerly belonged, as full-time employment, to working-class and lower-middle-class employees. Inadequate family income has resulted in multiple job holding, which more than doubled in the past decade. Half of these second job holders, 2.5 million from a total of 5.1 million, have a primary full-time job (ACOSS 1997). The number of such second jobs represents several times the number of the unemployed.
Finally, and also of concern, demographic statistics show that couples are increasingly delaying parenthood, and restricting their families to one child, so diminishing the care-load on working parents and their loss of personal spending power. Between 1993 and 1998, the birthrate, already at an all-time low, fell from 1,500 to below 1,400 births per 100,000 population. Our birthrate at 1.8 children per woman in now well below population replacement level. Similar trends have occurred in the United Kingdom and the United States, whose tax systems have similarly turned away from universal family income protection.
Part C
Family income protection and how to reinstate it via taxation rather than welfare
The direction for reform
The dynamic created by the higher income needs of families, as compared with earners without dependents, is that the less wages or taxation or welfare discriminate between family and child-free earners, the more one or both of the others must do so. When wages for family and child-free earners were unequal, taxation and welfare had comparatively small roles to play in family income protection. When, in the 1940s and 1950s, taxation became universal and wages less discriminating, first Child Endowment and then tax provisions (family-related deductions) assumed significant roles. When wage inequality was abolished, taxation and/or Family Payments necessarily had larger roles to play, particularly in a context of higher taxation to fund escalating welfare commitments which ignored the family as such. But instead, expressing the new ‘welfare’ emphasis within Social Security, taxation became non-discriminating, and Family Payments selective.
The policy of the 1980s appears to have established a vicious circle whereby families higher and higher up the earnings scale have their incomes reduced by taxation to a level at which they too become candidates for welfare. Ever greater calls are made on family incomes to fund rising welfare costs that increasingly serve merely to repair the incursions made by taxation on those same family earnings in the first place. This process is known as ‘churning’.
This is the cycle we are in now. It can be seen as a direct and perhaps unavoidable effect of the exclusive use for family income protection of targeted or selective Family Payments rather than universal Family Payments and/or tax exemptions. Only if taxation differentials recreate substantial income protection for families across the range of earnings will this vicious cycle of churning tax and welfare be broken. The churning involved is extremely wasteful, for much of what could remain family income is lost in cycling wages through bureaucracy and back to families. The tax taken is only partially returned as welfare. Further, there is a socio-moral case to be made for permitting the low- to average-income family to function once again as a self-supporting economic unit, rather than artificially creating the dependency of its members on state-provided benefits.
The point at which to intervene in this dysfunctional cycle is, then, in the non-differentiation of family and child-free taxation rates. Further, it is essential that recognition of the costs of children be taken into account at all levels of family earnings. Our economy is primarily one of a non-earning or secondarily earning spouse after the arrival of children, and for reasons of child and social well-being it is beneficial to support this tradition in planning reform.
Child rebates to replace current benefits
Given the above conditions, an effective strategy would be to introduce tax rebates (sometimes called earned income tax credits—EITCs) for dependent children. The choice of rebates in place of the deductions of the 1950s and 1960s avoids the questionable delivery of higher absolute gains to higher income earners.8 The rebates should be redeemable as (untaxed) positive payments in the case of the minority of large low-income families whose nominal tax is less than the rebates to which they are entitled.
As will be demonstrated later, a simple system of rebates can transform the tax system into one which provides universal family income protection and horizontal equity. As the cost to the family varies with the number and ages of children, the rebates should be granted on a per child basis, and should increase in value as dependent children progress in secondary and tertiary education. They should be universal and uniform. In exchange, all current Family Payments should be abolished. As were child deductions and rebates prior to the Family Allowance system, the Child Rebates can be administered on a payroll basis via the PAYE system. This will result in administrative savings for government, compared with the pre-GST system of fortnightly banking of payments.
The rebates should be adequate to provide for a comfortable lifestyle for children in families earning close to Average Weekly Earnings. To maintain parity with child-free earners at this level, the rebate should therefore cover, or come close to covering, the full living, housing, educational, and health costs of children at a basic level. We therefore need a rebate set at an agreed frugal/comfortable figure for these costs, and we can find a model in current welfare payments. In 1997 the couple with children on Unemployment Benefits (or on 50% AWE) received:
$48.00 per week per child aged 0-12 years ($2,496 p.a.)
$62.40 per week per child aged 13-15 years ($3,250 p.a.)
$80 per week in Austudy for the student child aged over 17 and living at home
($4,160 p.a.)
The Family Tax Payment provided $202 p.a., and if one of the children was a pre-schooler, an additional $500 p.a. was received. In addition they received Rent Assistance of about $2,500 p.a. ($50 per week).
These figures indicate a rebate/payment per child of about:
$60 p.w. per child aged 0-13 years ($3,120 p.a.)
$80 p.w. per child aged 14-17 years ($4,160 p.a.)
$100 p.w. per child aged 18-20 years ($5,200 p.a.)
The cost of a single pre-teenage child can to a considerable extent be absorbed into general family costs and covered by parental earnings, at least after it starts school, when the the mother is free to return to substantial part-time work, provided the combined earnings of the parents are at least a couple of thousand dollars above the minimum (dole) income for a couple. And when a single child is older and more expensive, the mother will have more freedom for employment. But as the number of children increases, the availability of the mother for part-time work diminishes.
To take account of these practicalities, it is proposed that the rebate for an only child or the youngest dependent child in a family be reduced to half the full amount appropriate to its age, except when there is a pre-school child (aged less than 6) in the family, who is more likely to require its mother’s presence full-time or close to full-time. Our family of three children would, as a result, receive a rebate of $10,920—that is, additional annual income to that value.
For a couple entirely on benefit or pension, the full payment for an only child or the youngest dependent child will remain necessary, since their income suffices for a couple only. The payment should be tapered to half value in direct relation to additional income, so that families earning some income will not be worse off than those entirely on benefit. As the half rebate level will be reached with an earned contribution of a mere couple of thousand dollars, the disincentive effect on work will be minimal. It will be easy for parents to earn more than they lose through engaging in employment.
The full Child Rebate for the youngest child should also apply in the case of a sole parent family which is not welfare-dependent and receives no contribution from the non-custodial parent.
Rebates provide recognition of the minimum cost of supporting and caring for children, and should be identical with and continue to be tied to the value of welfare support payments (per child per age group) for unemployed parents. The latter are necessarily reviewed from time to time and if the payments are jointly indexed this will ensure that tax rebates remain realistic.
Housing costs in Sydney are close to double those in all other cities, and consideration should be given to paying differential rebates—Sydney versus all other locations. Rebates 5% lower for non-Sydney families would probably be suitable. Otherwise the rebates will cost the tax payer unnecessarily because of Sydney’s atypical needs, or else Sydney families will be disadvantaged.
Average-sized families are worse off on a per person basis at twice Average Weekly Earnings than child-free earners on low incomes, and therefore the Child Rebates should not be reduced with rising family income, until it is well above 200% AWE.9
Table 1 shows the value of the rebates for four sample families and provides a comparison of these amounts with the current welfare plus tax benefit for the same families at the various levels of income.
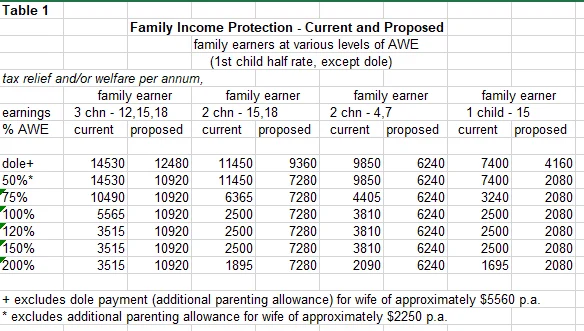
Withdrawal of equivalent current benefits
Family Payments and Tax Allowances for earning families: All current Family Payments (including Rental Assistance) and family tax concessions, whether universal or targeted, should be abolished in exchange for Child Rebates. For low-income earners the Child Rebate will replace their current Family Payments. The Child Rebate will raise current levels of PTW income for middle and higher income families. There should be no complaint at this, as even at 200% AWE disposable family income will not as a result reach the level indicated by assessments of the costs of children for equity of family and child-free disposable incomes.
Family Payments and Tax Allowances for unemployed and semi-employed families: Where parental income is the Unemployment Benefit, the Child Rebate (payment) will replace the current associated child support. That is, it will replace the various Family Payments to unemployed families, which top up the Benefit level of an unemployed couple without children, to provide a family income. It will also replace similar payments to semi-employed and very low earning families.
Childcare Benefits: All childcare funding should be withdrawn. The family with both parents working will receive the full Child Rebate. The working mother’s earnings (which increase family income) can justifiably be employed to fund the childcare of her children, which replaces her own care, in that the at-home mother also sacrifices (potential) income in order to care for her children herself. In a two-income family, the Child Rebate can be awarded to one or the other income, or shared. The current cost of one child in childcare will provide for two children under the Child Rebate.
Austudy and Youth Unemployment Benefits: The substantial recognition in the Child Rebate of the costs of dependent children aged 18-20 will make it reasonable to withdraw independent payments (Austudy and Unemployment Benefits) to students and unemployed youth in this age group, who can reasonably be expected to live at home as dependents of their parents. The state is not obliged to provide an independent living for youth in this age range if they cannot provide it for themselves. An accommodation allowance will, however, be required for the student whose tertiary institution is located so as to require living away from home. This would be considerably less than than the current Austudy allowance, as the parents will already be recompensed for all other costs, and should be available at all income levels.
In a context of government-promoted ever-extending formal education, an agreed age of termination of parental financial responsibility is needed, and the traditional age of adulthood at 21 would appear suitable. Parental financial obligation should be recognised as ceasing at this age, and thus the Child Rebate would not be payable for ‘dependent’ offspring aged 21 and over. Instead, young adults should become eligible for Austudy or Unemployment Benefits (now Youth Allowance) in their own right at 21, whether living at home or independently, student or unemployed.
Discretionary and indirect benefits: Discretionary and indirect benefits which are currently available to the unemployed and other low-income families, such as cheap fares and reduced medical expenses, phone rates and car registration, will need to remain so long as they are addenda to the other standard Pensions and Benefits. Rental Assistance which is geared to child dependency should be withdrawn. The existence of these benefits will militate somewhat against the improvement in income provided by employment, but the rise will nevertheless be sufficiently robust to create a real gradient of improvement. In the longer term it is desirable that both indirect and discretionary benefits be abolished in favour of adequate flat-rate pensions/benefits, so that welfare recipients face the same challenges of managing income as working people.
Sole Parent Rebate: The Sole Parent Rebate should be abolished. The restricted position of sole parents is recognised in the provision of the full Child Rebate for the youngest child in a sole parent family.
Dependent Spouse Rebate: The Dependent Spouse Rebate should be abolished. Disposable income at Average Weekly Earnings is more than double the Unemployment Benefit for a couple, and more than three times that for a single person. All incomes above the Unemployment Benefit or Age Pension for a couple, currently about 50% AWE, provide more than the minimum decent income for a couple. The couple with children as well as the couple without will lose this current benefit, as the DSR for couples with children has now disappeared into Family Payments and thus will be removed at the same time.
Tax deductions for the costs associated with earning a salary: The current provisions for deductions from taxable income of the costs of earning a salary should be abolished as discriminatory and regressive. Such costs should obviously be covered by the employer in the salary awarded, or by provision for claiming special costs against the company, if they are essential to the job, and not passed on to taxpayers in general. The parallel drawn with costs associated with self-employment, which occur at the employer not the employee level, is not appropriate. This provision currently creates large and unjustified financial advantages for families (as well as the child-free) in particular employment categories.
Outcome: new disposable income profiles
Figure 7 presents a comparison of current PTW income and the proposed tax-rebated income for our family with three children aged 12, 15 and 18 at the various levels of earnings. It demonstrates that this proposal is capable of rectifying the problems identified in the current system, in that a rising gradient of PTW income across the full range of incomes is maintained, and the gap between family and child-free incomes is substantial at every level of earnings. The benefit is greater than at any level other than 50% AWE under the current system. Also, importantly, the gradient of family-income rise matches that of child-free incomes.
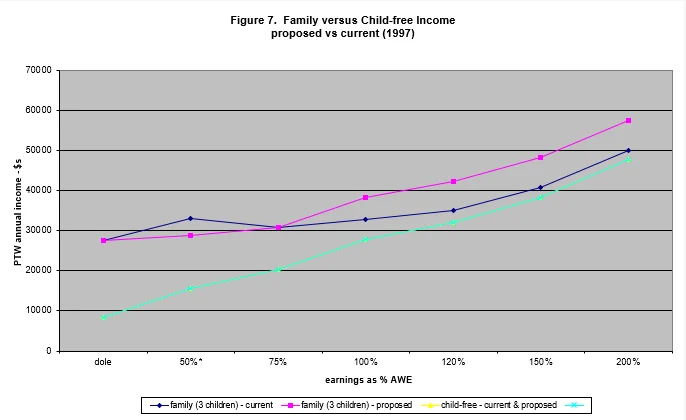
The only income which is significantly lower under the proposed rather than the current system is at 50% AWE, but this corrects the anomaly whereby part-employed families could achieve higher disposable incomes than the fully employed with higher earnings. The rising gradient across all levels of income solves the problem of the disincentive of 100% EMTRs for entering or increasing employment.
Figure 8 shows that the same effect is achieved for three other family compositions, the older and the young family with two children, and the single child family. A stable differentiation is provided between child-free and family earned incomes for the three different family compositions. And, again importantly, the provision of family income protection does not create 100% EMTRs at any level of family income.
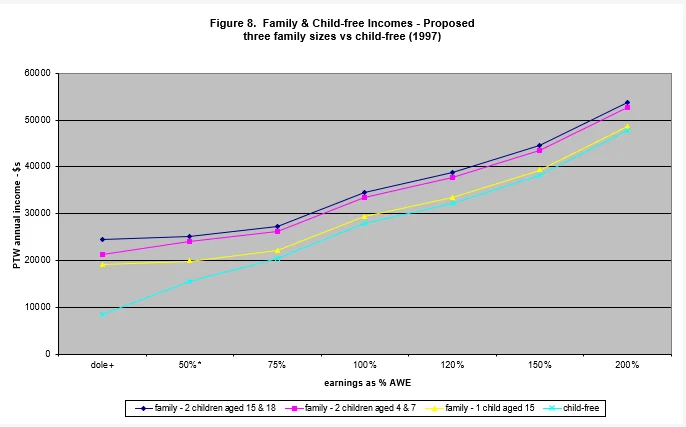
Thus, using the simple expedient of a per child tax rebate, all the multitude of family welfare payments—Family Payment, Austudy, Rent Assistance, Basic Parenting Allowance, Additional Parenting Allowance, Family Tax Payment, Childcare subsidies and so on (as of July 1997; somewhat altered in 1998)—can be harmlessly eliminated. This can largely be accomplished using the PAYE tax system. It will permit a substantial reduction in the size of the welfare bureaucracy, not just for the administration of payments, but also for assessments of eligibility and public liaison. The problems and complications of ascertaining income levels and adjusting payments, particularly when the former are subject to abrupt change, will no longer arise.
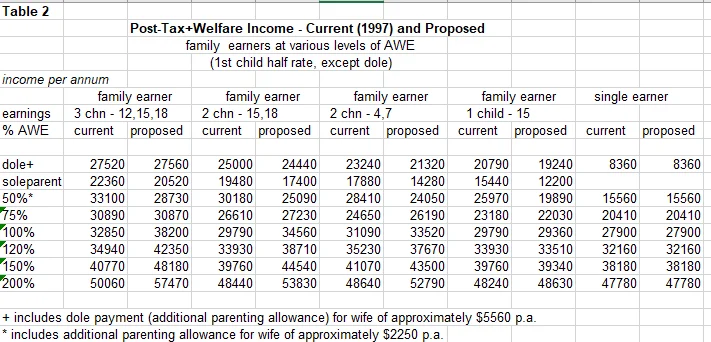
As can be seen in Table 2, most families—younger three-child families and all one and two child families—from AWE or somewhat below would not require positive payments, but would simply pay little or reduced tax. The same applies to older three-child families on 120% AWE and above. Indeed, the position of families in 1960 is more or less reinstated, with three-child families only beginning to pay tax when income reaches about 120% AWE. Far smaller positive payments than at present will be required for larger families on lower incomes, who will not have paid tax in the first place, so that recycling of money is not involved. These payments might be made via the pay packet, as most employers will deduct more tax than they subtract in Child Rebates across the board. In terms of independence and self-respect, the majority of Australian families will be able to feel economically self-sufficient.
Costing (and the GST)
Can the government fund family tax rebates of these dimensions? Family income protection was cut over the same period in which there was increased welfare expenditure in other areas. The extent of the family’s disadvantage in the ongoing development of social security and welfare funding can be seen in Figures 9 and 10. In the period 1969 to 1990, the real value of expenditure on social security and welfare per head of population rose 400%, but over the same period the funding of income protection for families (taking into account both welfare payments and tax relief) per head of population fell to only 50% of its initial value. Its apparent rise after 1990 is largely an artefact of the transfer of Unemployment Benefit payments for wives and children into the Family Payments system.
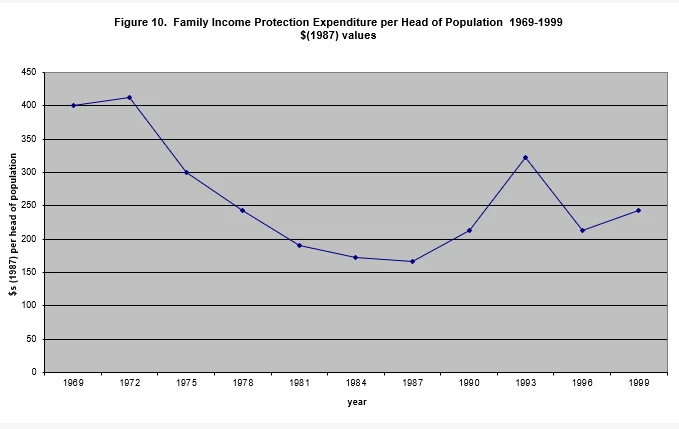
Further, while the real value of pension or benefit per recipient was higher in 1990 than in 1969 for every class of pensioner and beneficiary, the value of family income protection per child in the dependent age group halved (Sullivan 2000). For most families, the fall was much greater, as Family Payments were now concentrated on a minority of the child population—the children of welfare dependent parents and low income earners.
In this context, even a doubling of the current cost of Family Payments would not be unreasonable in that it would merely return family income protection to the value it had in 1969, reversing the draining of family incomes to resource increased welfare spending in other areas which began in the mid-1970s. But a rise of any major proportions (if in fact at all) is not necessary. All that is needed is a fairer and more equitable distribution of current resources.
We have already noted that for families on less than about 90% AWE a considerable part of the Child Rebate will substitute for current welfare payments. The savings to welfare administration will be significant. The cost to revenue will largely derive from rebates to families on the upper side of Average Weekly Earnings who currently receive little or nothing. But family earners make up only about half of the earning population, and so half of the tax-paying population will not be affected.
The withdrawal of childcare funding will create considerable savings. In 1997, the weekly subsidy payable to a childcare centre for two children was $208, and to the parent, $63.15, making a total payment of $271 per week for two children. The child rebate proposed here for two pre-school children amounts to $120 per week, so that four children can be provided for in place of two. Many high-income families are currently receiving childcare payments. In their case, the Child Rebate will not create an increased outlay.
Withdrawal of the DSR, which is increasingly anomalous for couples without children, will not disadvantage families with children for whom it has already been included in Family Payments, and who will be amply protected by the new Child Rebates.
Child Rebates for dependent students aged 17 to 20 will substitute for current Austudy benefits which are paid directly to the student, encouraging them to leave home and claim the full independent benefit when they could be supported more cheaply at home. A $5,200 p.a. Child Rebate compares with an approximately $8,000 Austudy payment to such students.
In addition, better funding of families is likely to result in the withdrawal from, or lower participation in the workforce of significant numbers of mothers in families with middle-to higher-income primary earners (the major grouping of two-income families). This may well result in employment opportunities for the currently unemployed, so reducing the welfare bill and the drain on revenue.
A rough costing exercise indicates that the Child Rebate, replacing the plethora of family welfare payments of the later 1990s, permits a more just distribution and more efficient usage of current levels of revenue rather than requiring significantly higher outlays.
The cost of the proposed rebates to revenue in 1997 would have been roughly as follows:
$ millions
children aged 0-13
last or only children aged >5 : 575,943 @ $1560 p.a. 900
other : 3,070,857 @$3120 p.a. 9,580
children aged 14-17 (91% total)
last or only children : 240,861 @ $2080 p.a. 500
other : 711,159 @ $4160 p.a. 2,960
students aged 18-20 (40% total)
last or only children : 79,786 @ $2600 p.a. 210
other : 235,574 @ $5200 p.a. 1,220
TOTAL 15,370
Thus the indicated cost to revenue, which is in fact a reduction in taxation, was approximately $15 billion. It is offset by the reduction of outlays from revenue for which the Child Rebate will substitute, as follows (using 1995/6 figures, when the Basic Parenting Allowance can still be distinguished from the Additional Parenting Allowance):
Basic & Additional Family Payment/Allowance 5,880
Childcare funding and rebates 1,200
Austudy (17-20 age group) 980
Basic Parenting Allowance 2,090
Family Tax Initiative 1,600
Rental Assistance 600
Dependent Spouse Rebate 910
Administration & Other (17.5% Social Security & Welfare total) 1,020
TOTAL 14,280
This indicates an extra cost to revenue of approximately one billion dollars. If the reasonable proposition of a 5% lower Child Rebate outside the Sydney area were adopted, at a saving of about $660 million, this would cover half the gap. The withdrawal of Unemployment Benefit from youth aged 15 to 20, and its replacement by the Child Rebate would also produce savings. The cost of Unemployment Benefit for youth aged less than 21 in 1996/7 was $750 million. Data for calculating the savings which would accrue from abolition of the deductions for the costs of earning a salary (a present source of subsidy for professional families) are not publicly available.
The present government has achieved budget surpluses of several billions in successive years. This could be regarded as security for the proposed reforms, given their importance. If placing the family on a better footing flows on to reduce unemployment and family breakdown, thus reducing family dependency on welfare, it may become possible to reduce tax rates across the board. Reduced tax avoidance in response to fairer taxation of families would also contribute to this outcome.
The GST
The above proposals for reform of family taxation are geared to tax and welfare regulations and provisions as they stood in 1996/7. A major tax reform, in the form of the GST, an increased indirect tax on goods and services came into being in July 2000. Reduced income tax and increased Family Payments were calculated to recompense families for the extra indirect tax a GST means for them but, as Figure 11A shows, the problems of family taxation identified in this analysis were not addressed.
The flattening of income across the lower levels of earnings which, in combination with substantial indirect benefits for the welfare dependent, makes employment for families not earning substantially above Average Weekly Earnings financially unproductive, remains. The enlargement of the gap between family and single earners was calculated to be primarily compensation for the higher levels of GST unavoidably paid for essential items as a result of multiple dependency on an income. The gap between family and child-free PTW incomes at 120% AWE and above represents the flat rate of the Family Tax Benefit Part B. As before, the gap disappears entirely a little above 200% AWE when the threshold for eligibility is passed. This means that the position of families at this level of income is substantially worse than prior to the GST.
The present proposals for Child Rebates can easily be adapted to these reforms, and offer the same savings on the complicated system of Family Payments as under current circumstances. The new rates of Family Payments to unemployed families under the GST will continue to indicate the appropriate level of Child Rebates representing the minimum cost of raising a child. Thus Family Payments (now called Family Tax Benefit Part A) have risen by approximately $10 per week per child, such that appropriate levels for Child Rebates at present would now be:
$75 p.w. per child aged 0-13 years ($3,900 p.a.)
$90 p.w. per child aged 14-17 years ($4,680 p.a.)
$110 p.w. per child aged 18-20 years ($5,720 p.a.)
With a half rate for the youngest child, this makes a total annual Child Rebate of $12,350 for our family of three children. For an unemployed family receiving the full amount per child it is comparable in value with the current payment (with Rent Assistance included). Table 3 and Figure 11B show the outcome for our family with three children across the range of incomes. As before, horizontal equity in relation to single earners is achieved at all levels of income, and the problems of high EMTRs are eliminated.
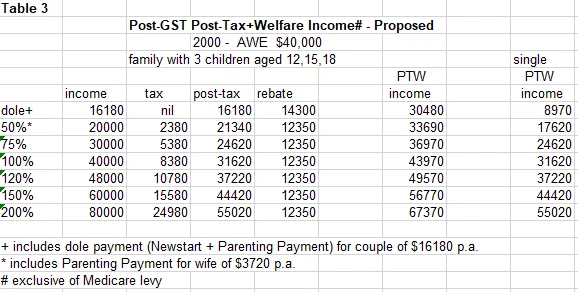
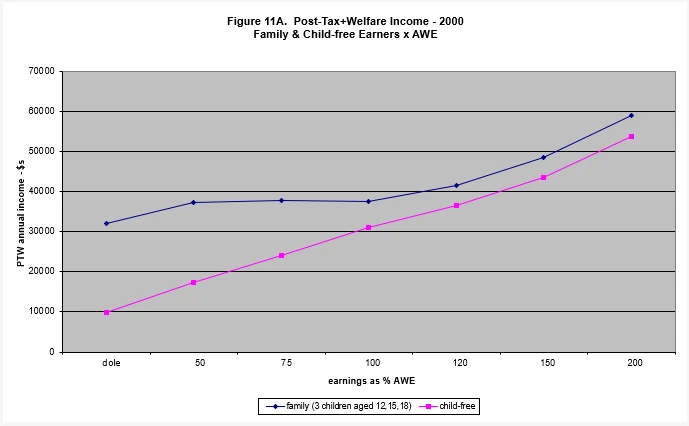
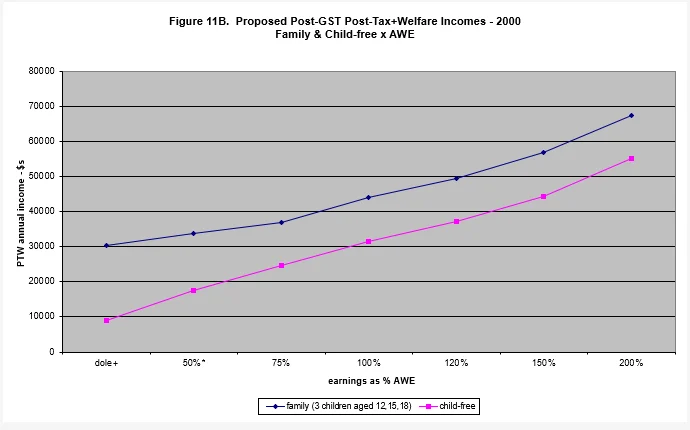
The GST reform makes Tax Benefit Part B claimable as a PAYE tax deduction, paving the way for a move to a universal system of realistic Child Rebates as suggested above.
Conclusion
Confounded welfare and the way out
Where wages are concerned Australia is still a comparatively egalitarian society, with 95% of full-time earned incomes falling within a small ratio of one another. It is in relation to income per person— that is, the size per person of the wage slice—that inequality has increased over the last two decades. This is because taxation since the early 1980s has ceased to concern itself with universal family income protection. While child-free earners devote the whole cake of their PTW income to themselves, each member of a family gets a greatly reduced slice. As a result of the switch from taxation to targeted welfare as a tool of family equity, the inequity of wealth between family members and child-free earners has increased and a concentration has occurred, in real terms, of family members at the lower end of the affluence spectrum.
Between 1983 and 1993 the Australian population rose by 13%. Over the same period social security cash benefits rose by over 150%. Part of this vast increase was in fulfilment of Prime Minister Hawke’s promise that no child would live in poverty by the year 1991. But this money was provided under a system of taxation that did not recognise the cost of dependents supported by an income. The price of this programme was taken from families and individual earners alike, reducing the former but not the latter to levels of stringency which were very incompletely recompensed by Family Payments. If the standard welfare income is considered ‘poverty’, the scheme could arguably have been called a policy of ‘all children in poverty by 1991’.
The Welfare Left, with its notional commitment to income equality as social justice, is determined that this situation is a just one—that the state should not, via welfare or tax relief, enable any family to enjoy an income much above the level it maintains for unemployed welfare recipients. Tax rates in interaction with welfare payments for employed families have been geared to effect this condition. Any relief for the ‘high income’ family is criticised, while its poverty in relation to the child-free earner on the same income is ignored. We are yet to hear from ACOSS any comment on the social injustice of equal taxation of family and child-free earners.
The espousal of income justice as a simple ‘class’ matter of low versus high wages has made left-wing opinion unsympathetic to the needs and aspirations of middle-income families which do not meet its criteria of wage injustice. At the same time it has been blind to the privileging of earners without dependents in terms of the tax justice principle of ability to pay.
The Menzies deductions for family expenses encouraged independence and self-sufficiency in that many families paid for their educational, insurance and health needs rather than relying on the state. As the Menzies deductions have been withdrawn, the costs to the state in these areas have grown, creating a cycling upwards of revenue requirements. A large part of this movement into welfare dependency derives from families whose incomes have been made inadequate for self-provision by heavy taxation.
The withdrawal of the Menzies system of deductions moved the middle-income family from comfortable independence to uncomfortable dependency on the state. It is pointless for the government to deplore the reduction in numbers using private health insurance, providing for their own retirement, creating savings against unemployment and so on, when taxation reduces most families to a level of income at which such personal outlays become impossible. Unless higher- as well as lower-income families receive recognition of the costs of raising children, we will continue to be a society in which the large majority of families cannot make such provision for themselves.
Labor’s development of the direct payments/welfare approach in the 1980s and 1990s, has encouraged the family’s dependency on the state for the meeting of its needs, thus casting government in the role of provider. The obverse of this is the family’s loss of self-esteem and autonomy. The Family Payment system of welfare for the employed creates a perception of families as dependent on the state for their well-being, whereas universal family income protection via taxation defines families as independent and responsible for themselves.
The Welfare Left may wish to believe that it serves ‘community’ (Cox 1995) to gear families’ perceptions of themselves to dependence on the state by taking from them what must be given back or reduces them to lobbying for assistance. But there can now be no doubt that this condition engenders a sense of social malaise which was not present when, in the 1950s and 1960s, the family’s self-perception was of independence and autonomy, albeit in what were in many ways less materially endowed circumstances than today.
So long as the targeted welfare approach persists, all measures to rescue the middle-income family will quickly come unstuck. The system will adjust to re-achieve a levelling of family income, and this will be funded by higher tax rates on those same struggling middle-income families. The effect will simply be a drift to higher taxation that still leaves most families struggling.
It is imperative to refocus attention on horizontal equity, on the individual earner versus family earner comparison. Even if one judges harshly that families on 150% and 200% AWE can afford to pay current levels of tax, it is clear that, judged by the equity principle of ability to pay, child-free earners on these incomes can pay much more.
But the true solution is that with the expensive trappings of pseudo-welfare administration removed and a more equitable distribution of family support, child-free earners need not pay more, families can pay much less, and government revenue can break close to even. The Child Rebate proposal may appear to offer little in a climate of concern with high taxation and a need to reduce social security expenditure, but the greatest imperative of the current welfare crisis is to interrupt the welfare-created situation of income levels being unaffected by personal work effort—of 100% EMTRs. Figures 7 and 8 have shown that the problem of 100% EMTRs in family incomes is solved by the Child Rebate approach. This reform, which reinstates rational motivations for earning an income, will prevent further lapses of families into welfare dependency and, over time, will return more families to adequate workforce participation.
The improvement of income equity between child-free earners and family members using taxation relativities is a one-stage process. Redistribution from both family and child-free earners to a sub-group of families via welfare payments, in an era when taxation occurs well down the income scale, is a two-stage process. Taxation first takes from those to whom it will be returned as welfare payments, as well as from those from whom it is permanently alienated. The former is therefore a simpler and more efficient mechanism. It should, on the principle of Occam’s Razor (applied to policy rather than scientific theory), be the chosen means. It was doubly unfortunate that at a time when the burden of family income protection left the industrial sphere and fell entirely on the administrative processes of government, protection via taxation was abandoned in favour of welfare payments.
Recent welfare policy has added to its traditional concern with those who cannot earn, the compensation of tax-reduced earned family incomes. The intrusion of welfare measures into the arena of earned income interferes with motivations for independence and autonomy via personal effort. Social security income should remain a safety net, not part of a seething mass of interactions of tax, welfare and earnings.
Finally, the work of child rearing should be seen as a contribution to the development of social capital—this is apparent if institutions other than the family take over its work—and it is more than equal in value to any extra taxation or lowered wages ever required of child-free earners. The Child Rebate reduces the family’s contribution to revenue and thus offsets its contribution to the costly business of social reproduction in the life-cycle of community regeneration. The aim of the proposed reform is not to reduce the income of semi- or unemployed families, but to reduce the tax taken from family earners, thereby making them independent of overt government support measures. Under the Child Rebate system, the use of childcare or not will become a matter of family choice, as the father’s earned income will again be adequate for family needs.
In the course of the 1980s, the lack of recognition of the costs of children to Australian parents reached ludicrous and punishing proportions. If we insist that those who take on the job of rearing children are reduced to a standard of living which bears no relationship to their socioeconomic or career norms and expectations, as now occurs in middle to higher income groups, then clearly this choice will be—and is being—decreasingly made. It is surely a reasonable proposition in terms of social justice that families should be permitted the same range of affluence as those without dependents.
Notes
- For example, the ACOSS Commission for the Future of Work (Impact. Aug. 1995, p. 1) writes:
‘For fifty years we have built our society on the belief that paid work would deliver enough income to most households to sustain a fair and growing standard of living. We have assumed that this “family income” would be enough to allow most caring, domestic and other community work to be provided unpaid by some household members while others were in paid work for most of their lives. We built our industrial relations system, our social security system, and our savings policies on these beliefs. Over the past 25 years many cracks in these pillars have been exposed …’
- In 1985, the Dependent Spouse Rebate was $1,030, and the Family Allowance was $1,132 for our three teenage children. But a family on 50% AWE could receive a further $1,456 Family Income Supplement, plus $2,010 in support for a tertiary student, and rent assistance of $780, totalling $4,246, for which none of the other income-level families were eligible. By 1990, the DSR had scarcely changed, and the Family Allowance had risen to only $1,450, but the family on 50% AWE could claim a further $8,507 in family income support, the family on 75% AWE a further $2,727, and the family on AWE a mere $933, while nothing extra was available in recognition of the extra cost of children for families on 120%, 150% and 200% AWE.
- This situation is reflected in the finding of the National Centre for Social and Economic Modelling (NATSEM) that, between 1982/3 and 1992/3, both the bottom 20% and the top 30% of Australian households had an increase in income of about $15 per week, while the middle 40% suffered a decrease of $12 per week.
- Table 7 Appendix 2 shows a larger selection of ratios of higher to lower incomes for family and individual earners, from 1950 to 1997.
From 1965 through to 1997, post-tax+welfare (PTW) income for individual earners on Average Weekly Earnings remained at 1.8 (a little less than double) that of individual earners on 50% AWE. That is, the extent of vertical equity introduced by the tax system at the lower end of the income scale was 20%. Individual earners on 120% AWE retained approximately double the PTW income of those on 50% AWE over the whole period – again a 20% vertical equity moderation of income.
For family earners, by contrast, a startling development occurred. From 1965 to 1975, family earners on AWE retained 1.9 the PTW income of family earners on 50% AWE – a vertical equity (VE) effect of 10%. But in 1980, the ratio fell to 1.6 (a 40% VE effect) and in 1997 the ratio was 0.9, making VE 110%, or more than absolute. An identical development occurred for family earners on 120% AWE compared with those on 50% AWE, with a fall from a ratio of 2.3 (10% VE) to VE of 100% in 1997. Today the family earner on 200% AWE, with earnings four times those of the earner on 50% AWE, ends up with an income only 50% higher. The child-free earner on 200% AWE, by comparison, retains three times (300%) the income of the person on 50% AWE. For the child-free earner, the equalising imposed by the fiscal system is much less extreme than for the family earner.
Within the middle to higher ranges of income, also, VE for the family as compared with the individual earner became more extreme. From 1950 to 1980, the VE effect between individual earners on 200% AWE and on AWE was generally 10% to 20%. VE increased in the mid-‘80s, and has been around 30% since 1990. For the 200% versus 120% AWE comparison it is 15%. For families on 200% AWE compared with AWE, however, VE rose from 20% in the 1960s to 50% in 1997, far higher than the 30% for equivalent individual earners. For the 200% versus 120% AWE family comparison, it was 25%, compared with 15% for equivalent child-free earners. So although, at these higher levels of income, families are still subject to greater VE than child-free earners, the level of VE imposed is nowhere near as great as that at lower income levels.
Figure 12
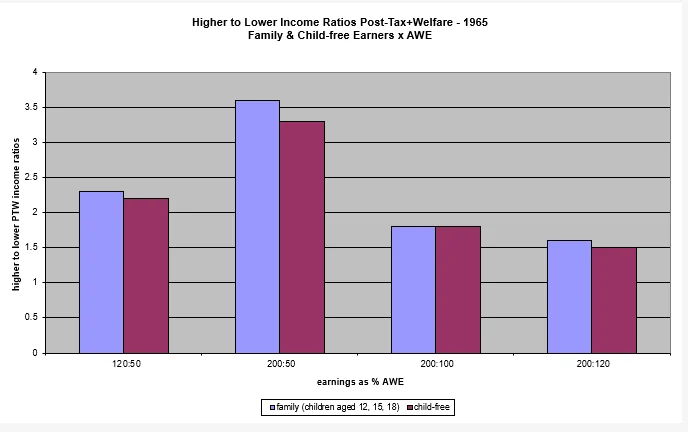
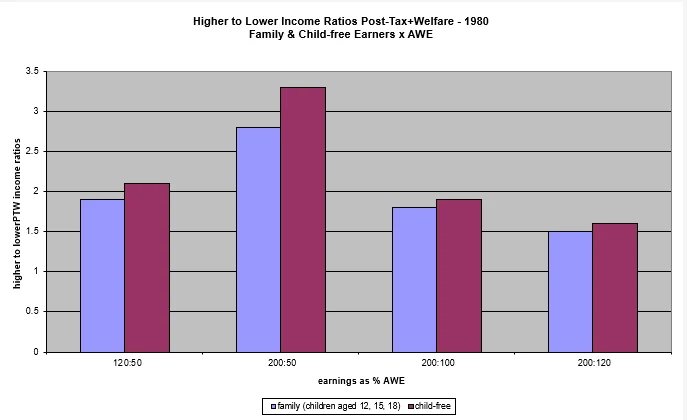
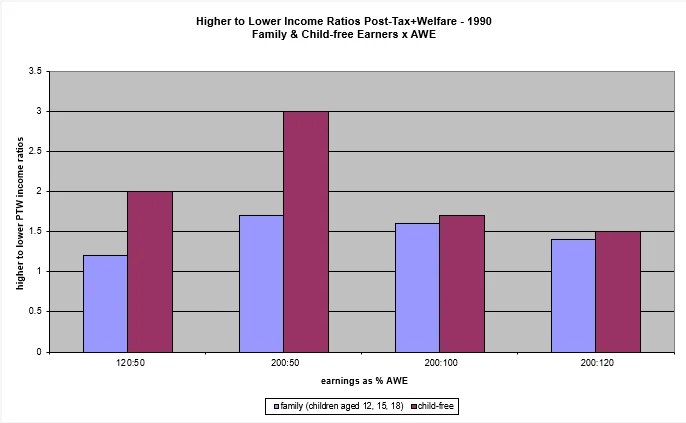
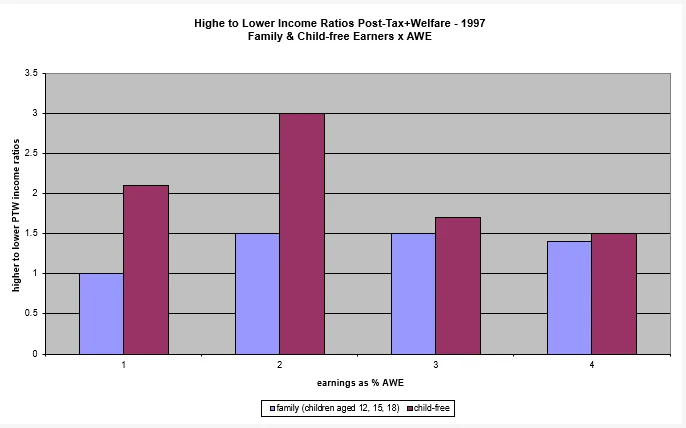
Figure 12 presents a selection of this data in graphical form, and shows the development of lower ratios for family than for individual earners. Whereas in 1965, family and child-free earners had their incomes modified in similar proportions by taxation, and if anything, child-free earners at higher incomes had their incomes more severely reduced, by the 1990s, family earners suffered greater reductions, particularly in the middle-income ranges.
- It is therefore no wonder that a recent survey of expenditure of different household types (Daily Telegraph, 14/8/98, pp.10-11) found that individual earners, even on low incomes, typically spent $150-$200 per week on entertainment, while families, even on nominally high incomes, spent nothing, all their income being taken up by necessities.
- In the course of the 1980s, new regulations in the tax system were introduced which directly demonstrate a privileging of the professional elite and the academic/bureaucratic/media lifestyle. Deductions, it will be remembered, were hounded out of the tax system as a method of sustaining families because they are regressive—they deliver higher benefits to higher-income than to lower-income earners. This argument was mounted in particular by academic feminists in their campaign against all government measures which might ‘encourage’ mothers to absent themselves from the workforce. Oddly, then, deductions for work-related expenses of a type particularly rewarding to academics and others of the intellectual meritocracy were introduced in 1980, without this objection ever apparently being voiced, at exactly the same time as deductions for family expenses were eliminated.
Work-related expenses, as tax deductions, deliver huge benefits to salaried workers in the intellectual reaches of the information industry. They can be claimed for home offices, books, journals, cultural activities, research and conference attendance and associated travel—all the appurtenances of the intellectual lifestyle. ‘No more half-price overseas holidays,’ said one academic regretfully, as her retirement approached.
Similarly benefits accrue, selectively and regressively, from deductions for self-education expenses. Deductions for children’s educational expenses were withdrawn from family earners in deference to the argument of regressive impact. But self-education expenses, which first appeared in 1975, are apparently immune to this criticism. Regardless of income, the individual earner can claim deductions for the expenses of his or her own education, while families above the Austudy eligibility level—$30,000 – $40,000 depending on number of children—receive no recompense for funding their children’s educational expenses. Between the mid-1980s and 1999, there was no recognition of the huge cost of the dependent tertiary student for families with incomes moderately above AWE.
- These benefits are made up as follows: the single income family received parenting payment $33 pw, family tax iniative $17 pw, family allowance $34 pw; the two income family received childcare allowance $71 pw, child care rebate $63 pw, family tax initiative $8 pw, family allowance $23 pw.
- The move away from tax allowances to welfare payments was favoured by feminists on the grounds that such assistance is better directed at the mother than the father. This view, however, seriously misinterprets the cooperative character of the family economic unit. Research has shown that in many families, wives administer family income even if earned entirely by the husband, and that after divorce husbands are usually better off and wives worse off, demonstrating major transfer of income occurring within families. Moreover, emphasis given to a wife’s own income may prompt husbands to regard their earnings as their own, thus creating less, rather than more, financial autonomy for the wife within the family. In sum, there is no substantial case for preferring payments to rebates on the grounds of improved access of children to benefits, as against the diminished benefits available due to money lost in churning.
- Consideration could be given to a high income ceiling for family rebates, of the order of 300% AWE, with appropriate tapering. Again, number of children should be a consideration and the following might serve:
ceiling of 250% AWE for 1 child family
300% AWE for 2 child family
350% AWE for 3 & 4 child families
400% AWE for 5 & 6 child families
450% AWE for larger families
Acknowledgements
I wish to thank Barry Maley, Alan Tapper, James Cox and Graeme Dorrance for valuable comments and criticism; Gillian Stacey of the Australian Taxation Office and Linda Macfarlane of the Australian Archives for supplying me with Tax Return Forms ‘S’ for the period 1950 to 1985; and my uncle, Lister Hopkins, former Assistant Statistician at the Australian Bureau of Statistics, for supplying me with tax rate formulae for the period 1990 to 1997.
References
ACOSS (Australian Council of Social Services) (1997). Tax Reform Pack. Sydney: ACOSS.
— (1997) Jobs Pack. Sydney: ACOSS.
Apps, P. (1995). Taxation of Families: Individual taxation versus income splitting. Discussion Paper No. 336. Canberra: Centre for Economic Policy Research, ANU.
Apps, P. (1997). Taxation of Families: Effects of a tax mix change, Australian Tax Forum, 13, 401-27.
ABS (Australian Bureau of Statistics). (serial). Australian Social Trends. Cat. 4102.0.)
— (1968/69) Labour Report No. 54.
- (serial) Labour Statistics. Cat. 6310.0..
- (1996) The effects of government benefits and taxes on household incomes:1993-4. Household Expenditure Survey. Catalogue No. 6537.0.
- (serial) Year Books.
- (1996) Quoted in Sydney Morning Herald, 13 February.
Australian Family Circle. (1996) Quoted in Sydney Morning Herald, 13 February.
Bennett, W. (1994) The Index of Leading Cultural Indicators: Facts and Figures on the State of American Society. New York: Simon & Schuster.
Bittman, M. (1998) Family household and welfare, SPRC Newsletter, 69, 8-11.
Cox, E. (1995) A truly civil society. The 1995 Boyer Lectures. Sydney: Australian Broadcasting Corporation.
Department of Social Security. (series) Social Security Payment Rates. Canberra: DSS.
Devery, C. (1991) Disadvantage and Crime in New South Wales. Sydney: NSW Bureau of Crime Statistics and Research.
Evans, M.D.R. (1995) Norms on women’s employment over the life course: Australia 1980-93, Worldwide Attitudes, 6 November.
Family Matters. (1995) No. 41. Melbourne: Australian Institute of Family Studies.
Henderson, R.F., A. Harcourt and R.J.A.. Harper. (1970) People in Poverty: A Melbourne Survey. Melbourne: Cheshire.
Horin, A. (1995) Families struggle to live on full-time pay. Sydney Morning Herald, 7 November, p.7.
Maley, B., Berger, B., Morgan, P., Sullivan, L. & Tapper, A. (1996). Home Repairs. Sydney: The Centre for Independent Studies.
Matthews, R. (1980). The structure of taxation. In J. Wilkes (Ed.), The Politics of Taxation. Sydney: Hodder & Stoughton.
Murphy, J. (1995) Social policy and the family. In S. Prosser, J.R. Nethercoat and J. Warhurst (Eds.) The Menzies Era: A reappraisal of government, politics and policy. Sydney: Hale & Iremonger. (pp.228-238).
Rowntree, B.S. (1901). Poverty: A study of town life. London: MacMillan.
Simons, H. (1938). Personal Income Taxation : the defining of income as a problem of fiscal policy. Chicago: University of Chicago Press.
Smith, J. (1993). Taxing Popularity: The story of taxation in Australia. Canberra: ANU, Federation Research Centre.
Social Policy Research Unit, University of New+ South Wales. Development of indicative budget standards for Australia. Sydney: Social Policy Research Unit, University of New South Wales.
Steuerle, C.E. (1997) Taxation and the family. Statement before the Committee on Ways and Means, US House of Representatives, 15 April.
Sullivan, L. (1997). Rising Crime in Australia. Sydney: The Centre for Independent Studies.
Sullivan, L. (2000) A sorry tale: Welfare against the family. In P. Saunders (Ed.) Reforming the Australian Welfare State. Melbourne: Australian Institute of Family Studies. (pp.177-205).
Wilkes, J. (Ed.) (1980) The Politics of Taxation. Sydney: Hodder & Stoughton. New York
Women’s Action Alliance. (1998). Newsletter, 12(6), p.1.
Zimbardo, P.G. (1992) Psychology and Life. New York: Harper Collins.
Appendix 1
Single Income Families with school age and student Children: Deductions, Rebates, Subsidies, Welfare Payments and Levies 1950-97
1950 all families: deductions for spouse, children, family costs; child endowment
1955 all families: deductions for spouse, children, family & education costs; child endowment
1960 all families: deductions for spouse, children, family & education costs; child endowment
1965 all families: deductions for spouse, children, family & education costs; child endowment
1970 all families: deductions for spouse, children, family & education costs; child endowment
1975 all families: deductions for spouse, children, family & education costs; child endowment
1980 all families: spouse rebate; family allowance
1985 all families: spouse rebate; family allowance
some families: family income supplement, tertiary education assistance scheme, rent assistance; medicare levy
1990 all families: spouse rebate
some families: family allowance; family allowance supplement; austudy; rental assistance
medicare levy
1995 all families: home child care allowance
some families: basic family payment, additional family payment, austudy, rental assistance; medicare levy
1997 all families: family tax payment; basic parenting allowance some families: family payment, additional parenting allowance, family tax initiative, austudy, rental assistance; medicare levy
Appendix 2
Tables
[1] The factual details of taxation history in Australia in this and the succeeding chapters are largely drawn from J.P. Smith’s very readable 1993 book, Taxing Popularity: The Story of Taxation in Australia (Federation Research Centre, ANU, Canberra).