
Introduction
Up to the May 2022 federal election, the official line on fiscal policy was that the federal budget was on a very gradual glide path to a balanced budget and declining debt as a percentage of GDP. Following the election, the new government was quick to change the narrative to one highlighting the persistence of budget deficits and burdensome levels of debt. The change of tune was partly a political strategy but also the result of updated and more realistic assumptions underpinning the budget arithmetic.
The new government in its first budget opted not to take corrective action — in fact, its policy changes (additional spending) made the structural budget outlook slightly worse, although this was masked by the cyclical effect of economic variables on revenue. Instead it foreshadowed a national ‘conversation’ about “our economic and fiscal challenges and the choices we need to make on what’s affordable and what’s fair”.i
This fiscal conversation is not to be confused with the other conversation on ‘values-based capitalism’ more recently initiated by the Treasurer Jim Chalmers in a lengthy essay.ii In this, Chalmers merely touches on the fiscal position by again warning that “the federal budget is deep in debt and under pressure”.
The term ‘conversation’ has become commonly used in the vernacular and more prosaically means a period of public discussion about identified policy issues — usually led by the government but involving other interested parties — as a prelude to policy deliberation and change. Such discussion should be informed by objective information and analysis of the issues.
Whether the fiscal conversation foreshadowed by Chalmers lives up to these standards is an open question. It is to be informed by data and analysis in the latest Treasury tax expenditure statement, the next federal budget in May 2023 and the intergenerational report (which looks at fiscal pressures over a 40-year horizon) due later in the year. But governments have ways of steering discussion and the public perception of issues to prepare the ground for policy directions they already want to take.
The risk is that the ‘conversation’ on fiscal issues will be a one-sided dialogue designed to prepare the way for tax increases to balance the budget while paying for rising government spending. The government’s economic spokesmen often highlight pressures for more spending on programs such as the national disability scheme, aged care, health services, child care and defence — hinting at the need for more revenue. These pressures are often portrayed as inevitable and a reflection of community preferences.
Those engaged in this discussion should be alert to such biases and insist on a more balanced and rigorous canvassing of the issues. Pressures for more government spending by interested parties are a constant in public discussion of policy issues, and should not be accepted as evidence that certain projections of rising spending are immutable. Both existing government expenditure and claims for additional expenditure should be subjected to close scrutiny.
Among the issues(topics?) that should be canvassed in the public discussion of these issues are:
- The level and nature of risks presented by the public debt burden and how these need to be managed over the years ahead.
- The implications of the desired path of public debt for the budget balance — whether projected deficits are sustainable and how rapidly they should be reduced.
- Projections of aggregate government expenditure and revenue and comparisons with past norms.
- The relative contributions of expenditure and revenue trends to projected budget deficits.
- The main sources (by program) of growth in government expenditure.
- The optimal assignment of expenditure and revenue responsibilities between the federal and state governments.
- Identification of expenditure programs that are failing to meet their objectives, and the scope for reforms to make them more effective.
- To the extent that expenditure growth is the cause of fiscal pressures, the scope for reducing it while making expenditure more effective.
- To the extent that revenue is inadequate, identification of the best ways to raise more.
- For a given level of revenue, how the tax system can be reformed to make it more consistent with criteria such as efficiency and equity.
This is a wide-ranging agenda of issues to which this paper aims to make a start by examining past, current and projected levels of federal government expenditure and revenue and highlight where the major shifts are occurring.
While the focus here is on the federal budget, discussion also needs to be broadened to encompass the states; as their finances raise similar issues, and the Commonwealth budget has a major role in funding state functions.
The following review is based mainly on the 2022–23 federal budget in October 2022 and the Parliamentary Budget Office (PBO) December 2022 publication Beyond the Budget 2022–23: Fiscal Outlook and Scenarios.
The fiscal problem
Australia’s fiscal problem at its most basic can be stated as a budget deficit that won’t go away without deliberate policy action to reduce it.
The deficit defined as the underlying cash balance shrank dramatically — and much faster than expected — after the pandemic-induced depths of 2020–21, when it reached a post-war record of 6.5 per cent of GDP. It was 1.4 per cent of GDP in 2021–22 and was estimated to be 1.5 per cent in the 2022-23 budget, although this now looks likely to be an over-estimate and the outcome could be much closer to a balanced budget.iii
This would be the quickest budget recovery from a deep dive into deficit in modern history. The surprisingly rapid improvement stems from high commodity export prices and the strong labour market feeding into tax receipts. How much of this improvement carries over into later years remains to be seen, but when the budget was tabled in October 2022 the temporary or cyclical element was expected to dissipate fairly quickly, leaving a deficit remaining in the range of 1.5–2.0 per cent of GDP out to 2032–33 — and there lies the structural problem (see Figure 1).
FIGURE 1
Estimates just a few years ahead, let alone 10 years ahead, are subject to a wide margin of error. However, following the change of government in May 2022, the new government was quick to weave a narrative around an entrenched and unacceptably large deficit over the next 10 years as a basis for changes to fiscal policy in its first term. This narrative has become widely accepted and will remain in place unless and until it is called into question by new information. Indeed, recent developments in inflation have added a sense of urgency to the calls for fiscal consolidation.
The large deficits associated with the global financial crisis of 2008-09 and its aftermath, and then the pandemic of 2020 and 2021, have seen federal gross debt rise from only 5 per cent of GDP in 2007–08 to 39 per cent in 2021–22. Continuing deficits, as discussed above, are expected to push gross debt up further to around 45 per cent of GDP by 2032–33. The level and trajectory of debt need to be part of the public discussion of fiscal issues.
Benchmarking the size of government
The size of government is best defined as the quantum of its expenditure; as this is what ultimately needs to be financed from taxation. There is a vast literature on the optimal level of expenditure in a mixed private/public sector economy such as ours, and one school of thought is that the actual size of government has grown beyond the optimum.
The CIS in 2013 argued that spending at all levels of government in Australia could be reduced below 30 per cent of GDP consistent with the core functions of government (including the social safety net) being met.iv Total spending at that time was around 35 per cent of GDP and rose above 40 per cent during the coronavirus pandemic. Even in a post-pandemic world there is no prospect of achieving 30 per cent or even getting all the way back to 35 per cent.v
While there are always pressures for government to do more, what is often lacking is an explanation of the extent to which government needs to intervene at all; an assessment of how effective its intervention will be; and whether the benefits of the expenditure can justify the economic costs of the taxation needed to finance it.
The purpose of this paper is not to revisit theoretical issues about the optimal size of government, but to use past levels of government spending and taxation — which reflect how pressures for increased spending have been balanced in practice in the past — as a benchmark to assess current and projected levels.
Expenditure trends and composition
There is no doubt that spending is at historically high levels and that this excess alone is sufficient to account for the persistent budget deficit. Moreover, this conclusion does not depend on the exceptionally high levels of spending in the pandemic years of 2019–20 to 2021–22, which should be treated as a one-off event.
On a cash basis payments were 26.8 per cent of GDP in 2021-22 and are estimated in this year’s budget to decline to 25.9 per cent as temporary spending on the pandemic finally washes out of the budget. But then underlying structural factors are expected to drive payments back up to 27 per cent of GDP in the next few years and further to 27.9 per cent by 2032-33 (see Figure 2).
FIGURE 2
Payments at 27–28 per cent of GDP will be well above any past norms. The 20 year average to 2018-19 (ie, excluding the pandemic) was 24.6 per cent, and in the 20 years prior to that, 25.2 per cent. In the last year in which the budget was close to balance, 2018–19, payments were 24.6 per cent of GDP. A level around 25 per cent is therefore a reasonably consistent benchmark in the history of federal spending. The budget is, we are told, heading for a figure 2 to 3 percentage points above that unless policy action is taken to prevent it.
Accrual-basis data for expenses only extend back to the late 1990s. On this basis expenses were 27.1 per cent of GDP in 2021–22, declining to 26.2 per cent in the current year and then growing again to reach 27.3 per cent in 2032–33. The 20 year average to 2018–19 was 25.1 per cent, and in 2018–19 itself, it was 25.0 per cent. So on this measure also, 25 per cent emerges as a reliable benchmark from the past and we are heading for levels 2 to 3 percentage points above that.
These findings place the burden of proof on those who argue that currently projected levels of government spending are unavoidable and must be funded with increased tax revenue. Some go further and argue for additional spending over and above what is currently projected, such as recent calls for increased Medicare rebates and JobSeeker benefits.
Composition of expenditure
A thorough examination of trends in aggregate expenditure, instances of wasteful and ineffective spending, the scope for savings and the demands for increased spending in some areas, requires close study of individual programs. This would require a well-resourced audit of $650 billion of federal budget expenditure and is well beyond the scope of this paper. Regrettably the new government has shown no appetite for such a thorough review of spending as a basis for expenditure reform.
However, it is possible to discern from publicly available data where the upwards pressure on spending has been concentrated in the past and where it will be concentrated in the future. As discussed above, expenses (accrual basis) have risen from a 20year pre-pandemic average of 25.1 per cent of GDP to 26.2 per cent currently and are projected to rise to 27.3 per cent over the next 10 years.
Looking at individual years, 2002–03 is representative of the 20 year average as expenses in that year were 25.1 per cent of GDP. Table 1 shows functional categories of expenses and key program components that have grown faster than GDP over the 20 years to the 2022–23 budget estimates.
TABLE 1
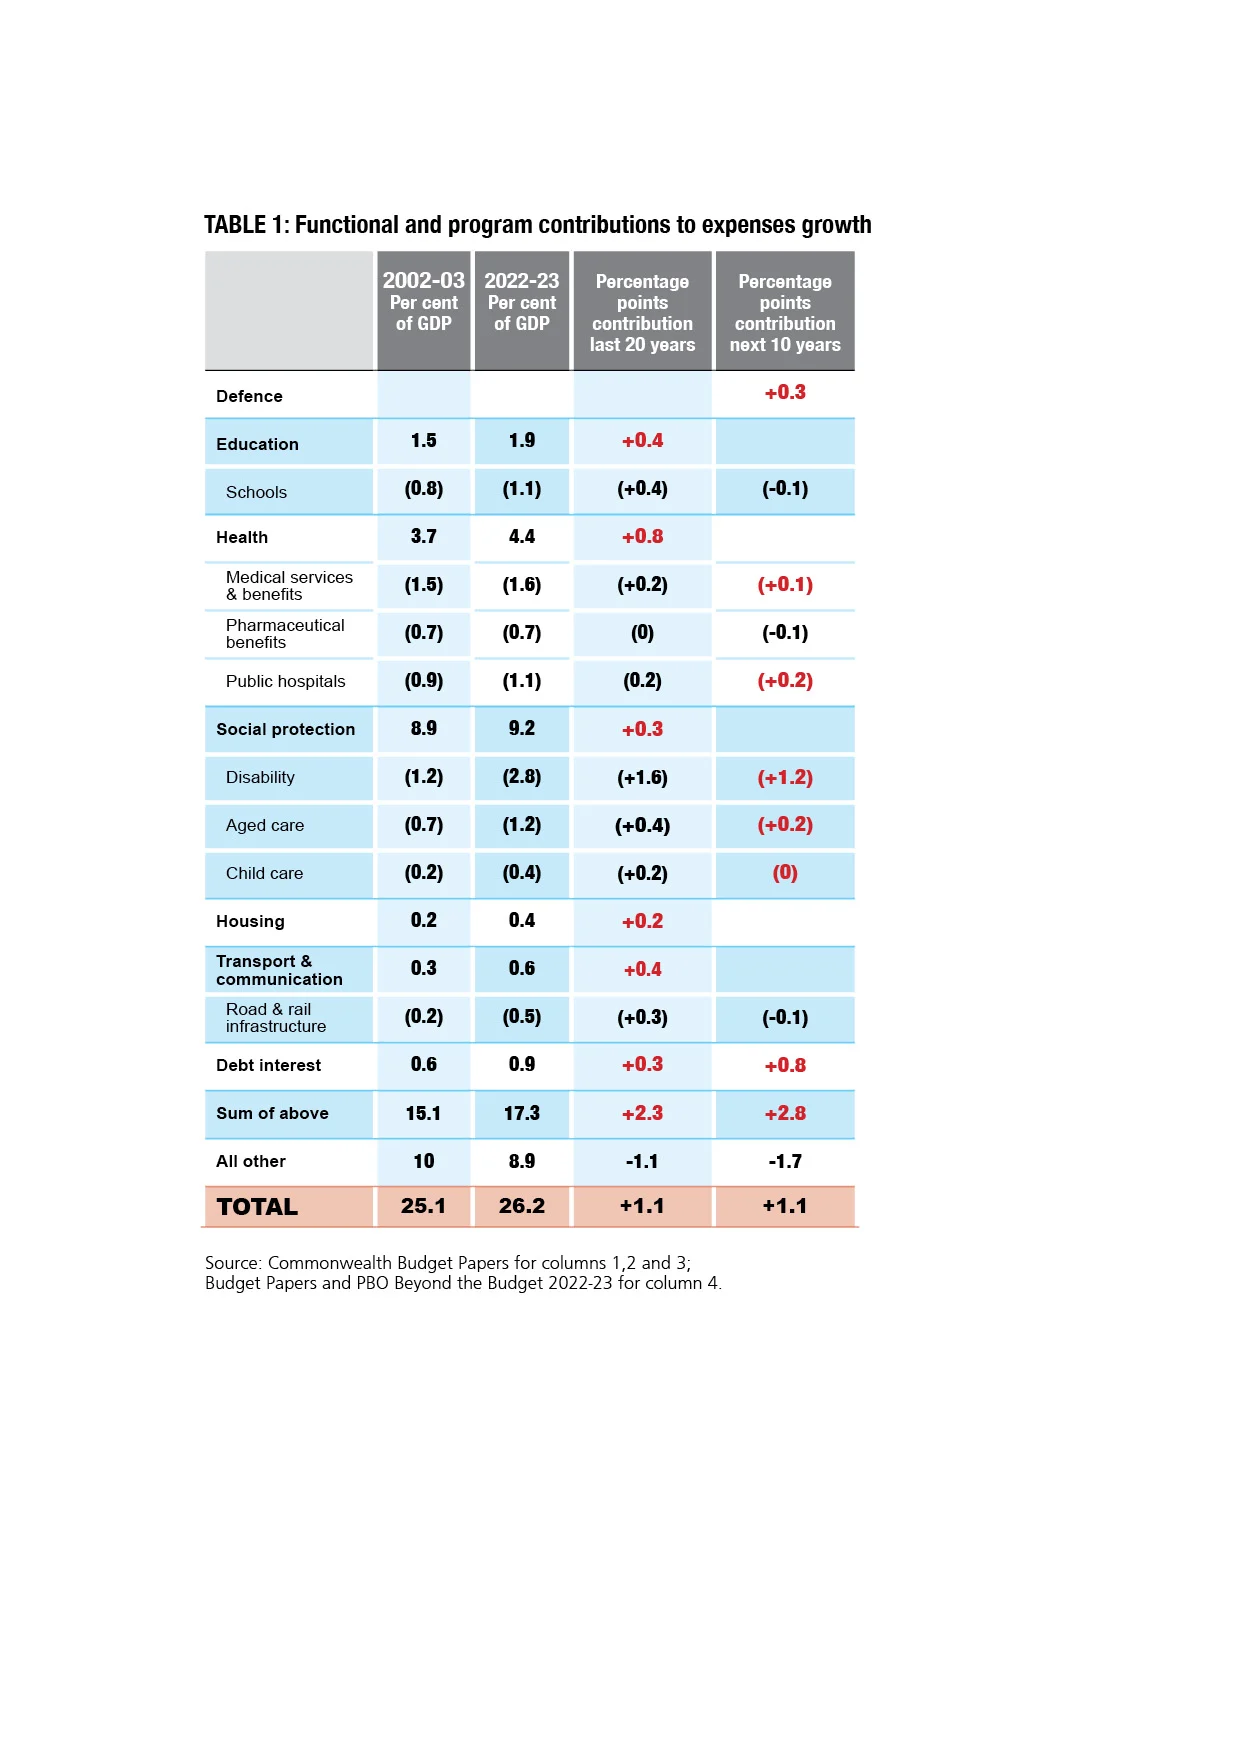
Increases as a share of GDP have been concentrated in education (entirely in school funding); health (across the board including grants to the states for public hospitals, medical benefits and the pharmaceutical benefits scheme); social security and welfare (particularly in disability care, aged care and child care); transport and communication services (particularly for road and rail infrastructure); and public debt interest. These areas of spending increased their share of GDP from 15.1 per cent to 17.3 per cent over the 20 years, which more than accounts for the increase in total spending. All other areas shrank from 10.0 per cent to 8.9 per cent.
Looking ahead, the PBO’s Beyond the Budget 2022–23 report provides partial data that suggest disability services (the NDIS), aged care, health and public debt interest will continue to put upward pressure on spending relative to GDP, joined by defence. However, spending on schools, child care and road and rail infrastructure is expected to moderate to rates of increase at or below GDP — implausible though this may seem given the pressure for more federal funding at least for schools and child care.
It must be emphasised that the fact that different categories of government spending are growing at different rates, and some of them above the growth of GDP, is normal and not in itself a sign of excesses. However, a review of large programs with persistent rapid growth should be the starting point for any attempt to curb the growth of overall spending.
The stand-out in this respect is the NDIS, the growth of which on its own accounts for the increase in the total government expenditure to GDP ratio over the past 20 years and is set to do so again over the next 10 years. It is rare for a major deterioration in the fiscal position to be attributable to such a large extent to a single program. It is therefore fitting that the government has commissioned a review of the NDIS, though it is not to report until after the 2023–24 budget, and curbing the growth of expenditure on the scheme is not its stated objective.
Public debt interest also stands out as a contributor to expenditure growth, particularly over the next 10 years. This is not surprising in view of the accumulation of public debt since 2008 and the recent lift in interest rates. However, debt interest is not a service delivery program like other items of public expenditure and is not amenable to control by the government other than through its control of other expenditure programs and revenue. If the budget excluding interest (the ‘primary’ budget) is restored to balance or surplus then interest expense will eventually fall subject to trends in interest rates.
Revenue trends and composition
For all that is being asserted about inadequate government revenue, federal budget revenue is currently very strong by historical standards and is expected to remain strong. This places the onus on those calling for tax increases to explain why current revenue is insufficient and why the fiscal problem should not be remedied by making policy changes on the expenditure side of the budget.
Revenue can be defined as total budget revenue, which is what enters the calculation of the budget balance (deficit or surplus); or tax revenue, which is more politically sensitive as it relates to the ‘hip pocket nerve’ effect of revenue collection. Tax revenue constitutes more than 90 per cent of total revenue, but here we will examine both concepts to avoid confusion.
Total revenue
Total cash receipts were 25.4 per cent of GDP in 2021–22 and were predicted to decline to 24.5 per cent in 2022–23 before rising again to 25.1 per cent in 2024–25 and 26.0 per cent in 2032–33. The decline in 2022–23 reflects the temporary nature of some of the factors contributing to revenue strength in the previous year or two.
However, since the 2022–23 estimates were made in October 2022, actual revenue has been stronger than estimated. In the six months to December, actual revenue was some $9 billion or 0.7 per cent of GDP above what would have been expected in that period consistent with the October budget estimates.vi It therefore looks likely that the result for 2022–23 will be materially above the budget estimate, as has been the case for the last few years. It remains to be seen how much of this the Treasury treats as ‘temporary’ and how much will be ‘permanent’ and add to revenue estimates in future years.
It can safely be said, however, that with cash receipts running at close to 25 per cent of GDP this year following a result above 25 per cent in 2021–22, remaining above 25 per cent in 2024–25 and rising to 26 per cent in 2032–33, this measure of revenue is historically very strong.
The last time the budget was close to balance was in 2018–19, when receipts were at 24.9 per cent of GDP. The average in the 20 years to 2018–19 was 24.0 per cent. Why should receipts of 25 per cent of GDP in the years ahead not be sufficient to run a balanced or surplus budget again?
On an even longer historical perspective going back to the early 1970s, receipts have only once exceeded 26 per cent of GDP and in most years have been in the 23–25 per cent range except in periods of economic weakness. In years of notable economic strength levels of 24–25 per cent have been the norm.
The other concept of revenue is the accrual-based measure, which only extends back to 1996–97. On this measure, the 20 year average is 24.5 per cent of GDP and in the last year of budget balance (2018–19) it was 25.3 per cent. In 2021-22 however, this measure was already at 26 per cent of GDP — a result that looks likely to be repeated this year. Total revenue is projected to be 26.2 per cent of GDP in 2032–33; a level that has only been matched or exceeded twice looking back to 1996-97.
Tax revenue
As tax revenue comprises more than 90 per cent of total revenue, not surprisingly it has shown similar trends to total revenue.
Cash tax receipts were 23.4 per cent of GDP in 2021–22, above the 20 year average of 22.5 per cent and above the level of 23.1 per cent in 2018–19 when the budget was last in balance (Figure 3). Tax receipts are likely to be close to 23 per cent of GDP again this year before dipping slightly in the first year of the stage 3 income tax cuts (2024–25) and then rising again to 23.9 per cent in 2032–33.
FIGURE 3

On a long-term view back to the early 1970s, tax receipts have never exceeded 24.2 per cent of GDP and have usually not exceeded 23 per cent, but when they have the budget has been in surplus or balance with only one exception.
On the accrual basis, tax revenue was 24.0 per cent of GDP in 2021–22, exceeding the 20 year average of 23.0 per cent and the level of 23.4 per cent when the budget was last in balance. A slight dip to 23.5 per cent is estimated for 2024–25 but then an increase to 24.4 per cent in 2032-33, which has only been matched or exceeded in the peak years of budget surpluses in the mid-2000s.
Composition of tax revenue
The projected increases in tax receipts and revenue out to 2032–33 are driven overwhelmingly by personal income tax bracket creep. This is offset by a projected weakening in company tax revenue, which is currently running above average owing to the strength of commodity prices and resultant buoyant tax collections from mining companies.
One way to look at bracket creep is to trace the aggregate average personal income tax rate — that is, income tax payable as a proportion of taxable income. In the absence of discretionary tax cuts or automatic adjustment of tax thresholds for inflation, this average rate will increase automatically as average nominal incomes increase, the more so the stronger the growth in average incomes. As Figure 4 illustrates, the average income tax rate is projected to reach 26.4 per cent in 2032–33, which would equal the highest level reached in the history of personal income tax (in the late 1980s and the late 1990s). Both of those previous spikes in the average rate were brief and preceded large discretionary tax cuts that pushed the average rate sharply lower.
FIGURE 4
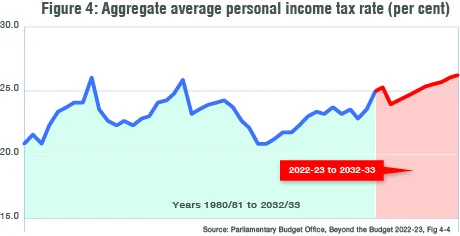
The projected changes in the composition of tax revenue are expected to see personal income tax rise to 50 per cent of federal tax revenue by 2032-33, which has been exceeded only in the past before the goods and services tax came into being resulting in a rebalancing of taxation from income to consumption. Heavy reliance on personal income tax has long been seen as a key flaw in the tax system and was one of the main considerations behind the advent of the GST with accompanying large income tax cuts in 2000. Bracket creep is projected to take us back to a state of over-reliance on personal income tax — indeed, there is a good case that we are already there.
Implications for Stage 3 tax cuts and future tax reform
The third and final stage of income tax cuts set in train in 2018 is set in law to be implemented in July 2024. Although criticised in some quarters as excessive in the fiscal circumstances, the above examination of revenue trends demonstrates that the tax cuts will make only a small dent in a rising trend of tax revenue relative to GDP. Even in the first year of the cuts, revenue will remain at an historically high level, and thereafter will resume growth (owing to the resumption of bracket creep) towards record levels.
The aggregate average income tax rate will fall in 2024–25, but to a level that is still well above the long-term historical average, and will then resume its climb towards a record level unless there are further discretionary tax cuts.
Seen in this perspective, the Stage 3 tax cuts are in the mould of past tax cuts that have been implemented periodically to correct for the effects of bracket creep. Indeed, the longer term outlook for personal income tax growth suggests a strong case for further tax cuts later in the current decade.
The starting point for fiscal consolidation should not be that more revenue is needed, but this does not rule out structural changes to the tax system that leave revenue unchanged or lower. An assessment of possible tax reforms is beyond the scope of this paper and will be taken up in a follow-up paper.
Suffice to say here that while revenue-neutral or revenue-reducing tax restructuring can be worthwhile, it should pass the test that it improves the economic efficiency, equity, simplicity and sustainability of the tax system while satisfactorily managing the trade-offs among these objectives. Any reforms should also be designed to endure. For example, the GST and its replacement of other indirect taxes and certain state taxes has endured, but most income tax cuts have not endured because they have been neutralised by subsequent bracket creep.
The aggregates in per capita terms
While this discussion has focused on expenditure and revenue relative to GDP, another way to illustrate the same points is to look at the aggregates in per capita and real per capita terms — that is, after allowing for inflation and population growth.
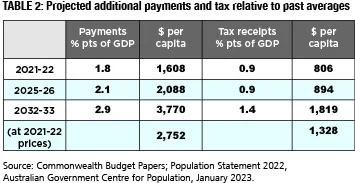
Per capita budget payments in 2021–22 were $23,993 and per capita tax receipts $20,889. Table 2 measures the extent to which these and projected per capita amounts are above historic averages of 24.6 per cent of GDP for payments and 22.5 per cent for tax receipts.
TABLE 2
The budget papers now contain data on real per capita payments and receipts.vii Data extending back to 1970–71 show that real per capita federal budget payments, for example, have more than trebled since then. Focusing on more recent periods, we see a 19 per cent increase in the 10 years to 2021–22 and a 28 per cent increase in the previous 10 years.
Over the whole 20 years the average annual rate of increase of 2.1 per cent took real per capita payments to $19,335 in 2021–22. Some such increase is to be expected with economic growth, but real per capita spending has grown ahead of real per capita GDP (1.2 per cent) and real per capita national disposable income (1.8 per cent) over that period. (The faster growth in national disposable income reflects the rise in Australia’s terms of trade over this period.)
Real per capita tax receipts and total receipts have risen by 1.8 per cent annually over 20 years, in line with national disposable income but ahead of GDP. (Tax receipts were $16,800 per capita in 2021–22.) This outcome together with growth of spending faster than revenue has resulted in the emergence of a persistent budget deficit ($1,000 per capita in 2021-22) and the build-up of net debt from a real per capita level of close to $3,000 in June 2002 to over $16,000 20 years later.
The budget estimates that real per capita tax receipts will decline until 2024–25 as the temporary boost from high commodity prices dissipates and stage 3 tax cuts come into effect. However, the author’s projections to 2032–33 based on official projections of revenue, population and prices point to a resumption of strong growth in real per capita taxation with a cumulative increase of 18 per cent (about 2 per cent a year) in the eight years to 2032–33.
Real per capita payments are expected to decline to 2023–24 and then increase by 17 per cent to 2032–33.
Conclusion
Salient among the many issues for a public discussion of fiscal pressures — as foreshadowed by the federal Treasurer — is the fact that government expenditure is growing faster than the economy, is at levels above pre-pandemic norms and is heading for a record high. At the same time, revenue is running at historically strong levels and is also projected to exceed pre-pandemic norms.
If there is a structural budget problem, as projections indicate, the first place to look for a remedy is expenditure reform, not additional revenue from tax increases. Expenditure policy should subject existing and new spending to close scrutiny with the aim of removing low priority programs and reforming others to strengthen effectiveness and efficiency with a clear focus on results rather than inputs. In this way expenditure excesses can be squeezed out of the budget over time, as has been done in the past — but not for many years.viii
Success on this front would leave tax reform to focus not on raising more revenue but on restructuring the tax system to achieve better alignment with criteria of economic efficiency, incentive, fairness, simplicity and sustainability.