

Executive summary
Concern over Australia’s slow rate of productivity growth is justified as it is essential to the nation’s prosperity. Increasing productivity is the main reason why living standards have improved. After strong growth in the 1990s, Australian productivity growth slowed markedly after around 2004 and has been slower than productivity growth in the United States in recent years. The slow productivity growth is a major reason for growing dissatisfaction with conditions in Australia.
Despite its importance, productivity growth is a somewhat elusive quantity to measure. It is typically measured as a residual — that part of economic growth which is not explained by the amount of labour that is provided or the stock of capital that is available for labour. In the short-term, productivity is influenced by temporary factors such as the stage reached in the economic cycle and events such as the COVID-19 pandemic. But longer-term trends in productivity growth provide important information.
The growth rate of productivity matters. Over the longer-term, productivity growth is the main contributor to prosperity and improving living standards. A more prosperous society can enjoy a higher quality of life, including better education, health, environmental protection and assistance to the disadvantaged and disabled, and shorter hours of work.
When incomes are rising slowly politics can easily become a zero-sum process in which groups compete to improve their relative status. This zero-sum approach can result in the adoption of policies that make the problem worse by reducing productivity growth. People will be less concerned about their relative status when growing prosperity is spread widely. This will encourage a less defensive and inward-looking approach in society and greater openness, social mobility and tolerance, and support of democracy.
This paper aims to review Australia’s productivity performance. The first section discusses in a little more detail what is meant by productivity and how it is measured. The second section deals with the fall in Australia’s productivity growth rate. The third section considers some explanations for the falling productivity growth. The final section provides reasons for concern about Australia’s declining productivity performance.
To listen to this research on the go, subscribe on your favourite platform: Apple, Spotify, Amazon, iHeartRadio or PlayerFM.
What do we mean by productivity?
Productivity is the relationship between inputs and outputs. It measures how much input is required to produce one unit of output. This is a measure of how efficiently inputs are used to produce the outputs of economic activity.
Productivity can be measured at several levels for a firm, an industry, a sector of the economy or for the whole economy. In this paper we are most interested in productivity for the market sector and the whole economy. In each case we must value the contribution that the firm or sector makes to economic activity.
The market sector refers to activities where goods and services are sold to customers. The output of these activities can be valued by the amount that customers are willing to pay for them. This makes it possible to add the value of separate activities.
The non-market sector refers to activities such as health, education and public administration whose output is largely not sold on the market. This makes it more difficult to value the output of these activities. Nevertheless, indicators of the level of activity are sometimes available (such as the number of students taught, or patients seen) which can be compared to the cost of undertaking the relevant services. However, this is a different approach to that followed for the market sector and which may not fully capture the value that recipients obtain from these services.
There are two measures of productivity that are frequently calculated: labour productivity and total factor productivity (on calculation methods see ABS, 2025a).
Labour productivity is the value of output that is produced by one hour of labour input. It is a measure of the efficiency with which labour is used and is influenced by the amount of capital with which labour works. Labour productivity is influenced by the composition of the labour force — more highly qualified people are likely to be more productive. Some sophisticated measures have been calculated that take account of this changing composition.
Over the longer-term labour productivity growth has been the main contributor to income growth. However, in the short-term labour productivity can also be affected by factors such as the stage reached in the economic cycle and changes in the terms of trade which are likely to be reversed in time (see Bruno, Dunphy and Georgeakis,2023). Australia’s terms of trade have eased since the mid-2010s and no longer contribute to income growth.
A practical advantage of labour productivity is that it is relatively easy to calculate. Long time series are available for Australia and overseas countries.
Multifactor productivity takes account of the use of capital in production as well as labour. It is more difficult to estimate the use of capital than the use of labour, but measures based on the user cost of capital seem to be gaining acceptance. (The user cost of capital is calculated by adding economic depreciation to the required return on investment, all adjusted for company taxation.) Multifactor productivity is calculated as a residual — it is that part of economic growth which cannot be explained by changes in the use of capital and labour. However, it does not take account of the extent to which production uses up the services that are provided by the natural environment.
Particularly over the longer term, it is useful to think of multifactor productivity as a measure of the innovative performance of an economy. Innovation here refers to the extent to which new knowledge is used to produce new goods and services. It includes innovation in organisation and marketing as well as technical advances. Innovation can include contributions by ordinary employees, managers, suppliers, as well as researchers and scientists and demand by consumers.
Multifactor productivity is not a pure measure of innovation. Because it is calculated as a residual it is potentially influenced by measurement error. Over the short term it is influenced by factors such as policy changes and global economic conditions that are unrelated to innovation. Moreover, multifactor productivity growth can result from factors such as economies of scale, institutional reforms or better resource allocation which, although they require change, may not strictly be innovation. Alternative measures of innovation based on the number of patents granted are likely to be incomplete since not all innovations are patented.
Another important distinction is between the productivity of leading (or frontier) firms and those that lag them (see Duretto, Majeed and Hambur, 2022, for further discussion). A further distinction is between firms at the global frontier, which are often but not always, firms in the United States and those that lag behind them. The difference between the productivity of the frontier firms and the productivity of firms in general provides a useful measure of how quickly new knowledge spreads through the economy.
Except perhaps for mining and agriculture the productivity of the leading Australian firms lags the global frontier. There are good reasons why this might be so, including Australia’s small population that is spread over a large area and our distance from the main centres of global economic activity. However, the extent to which Australian firms lag the global frontier varies through time and has been increasing recently.
What productivity is not
Productivity is not about working harder or longer. The length and intensity of work refer to the amount of labour input that is provided. Productivity, by contrast, is about making the best use of labour input.
Productivity growth is not the same thing as economic growth although it is a source of economic growth. Productivity growth excludes changes in the level of economic output that result from changes in population and labour force participation.
Labour costs (mainly wages) divided by labour productivity provides a measure of unit labour costs (see ABS, 2025b, for further discussion). Unit labour costs will not increase if wages grow in line with productivity.
What has happened to productivity?
Over the longer-term productivity growth has slowed in Australia and overseas countries. However, there have been exceptional periods such as the temporary acceleration of productivity growth that occurred in Australia in the 1990s and early 2000s.
Chart 1 presents ABS data on changes in multifactor and labour productivity from 1995-96 (year 1 on the chart) to 2023-24 (year 29 on the chart: see ABS (2025c) for further details). A downward trend is apparent. For example, labour productivity increased at an average rate of 2.4% a year during the first half of the period and by 1.2% a year during the second half. Multifactor productivity increased by 0.9% a year during the first half of the period and by 0.5% a year during the second half. As expected, multifactor productivity growth has been slower and less variable than labour productivity growth
Chart 1: Market sector productivity growth in Australia
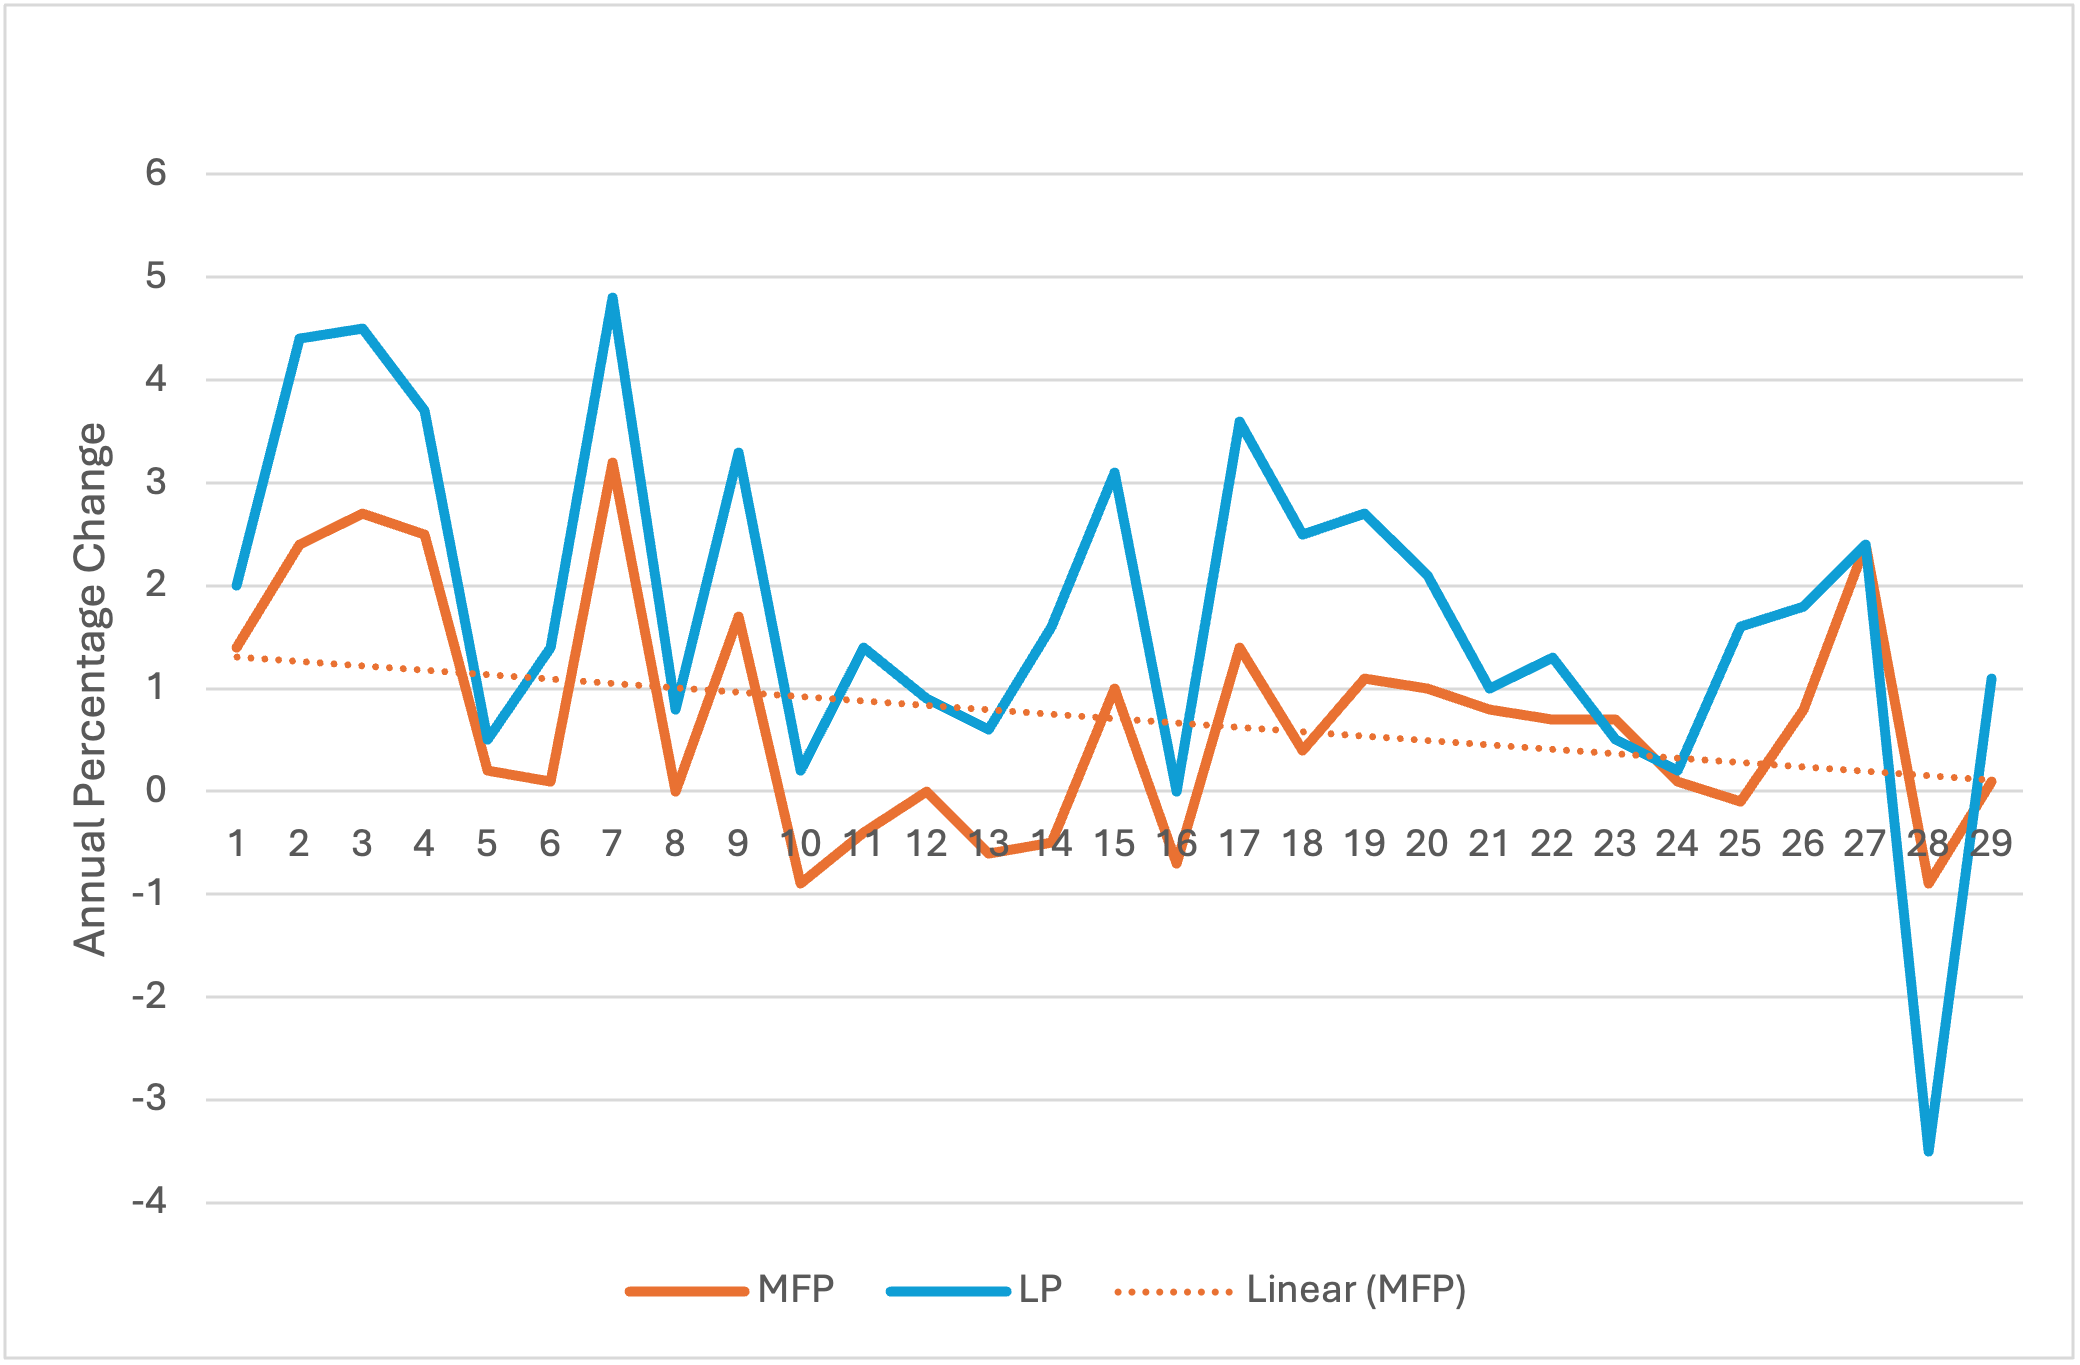
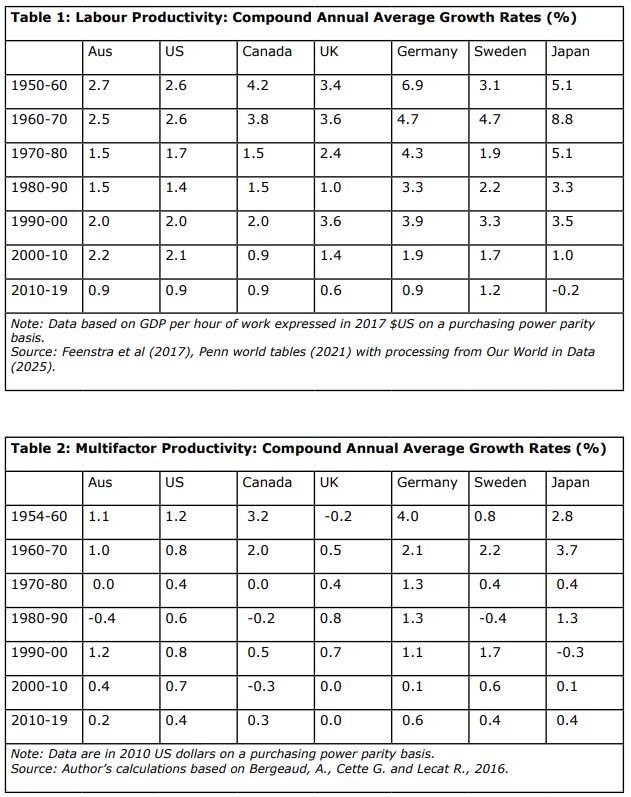
This chart, however, raises several questions. For example, were the 1990s an exceptional period for Australian productivity growth? If so, the subsequent slowdown in growth would be less surprising. Also, is the productivity slowdown a purely Australian phenomenon or did it also affect other countries? If so, a purely Australian explanation is likely to be insufficient. To throw light on these questions some longer term data are shown in Table 1 for labour productivity and Table 2 for multifactor productivity. To reduce the importance of cyclical events and short-term shocks, I have calculated average annual growth rates for each decade.
Several important points are made in these tables. First, productivity growth has greatly slowed in all these countries during the period after 1970. In particular, the period of the Information and communications technology revolution commencing in the 1990s has not to date been one of particularly rapid productivity growth. Secondly, the decade from 2010 to 2020 was one of slow productivity growth in all these countries. Thirdly, the decade of the 1990s was one of rapid productivity growth in Australia — productivity growth was faster in that decade than in the previous and subsequent decade. Some other countries, including the United States, United Kingdom and Sweden, also had rapid productivity growth during the 1990s.
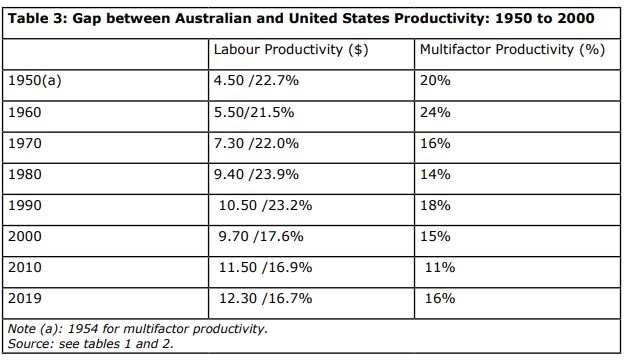
The United States is the economy with the highest levels both of labour productivity and total factor productivity. It is useful to estimate the gap between Australian and United States’ productivity levels to see whether we are advancing towards the frontier or departing further from it. Table 3 provides some information on this point. The percentage gap is calculated by taking the difference between US and Australian productivity levels and dividing the result by the US productivity level.
In general, the gap between Australian and United States labour productivity levels has increased when the gap is calculated in constant dollar terms. The period from 1990 to 2000 saw a partial reversal of the trend. However, the Australian economy has departed further from United States labour productivity levels from around 2000.
When calculated as a percentage of United States labour productivity levels, the gap has reduced throughout the period and especially between 1990 and 2000.
Because multifactor productivity is presented in index form in the data source, it is only possible to calculate the gap in percentage terms. These data show that the gap reduced between 1990 and 2010 but has increased since 2010.
So far, we have been considering estimates of productivity over the longer-term. There is also the important question of what has been happening to productivity in recent years. The Productivity Commission reports extensively on this. Its work shows that labour productivity in Australia grew by an average of 0.66% a year over the five years to 2023-24. Multifactor productivity also increased by 0.46% a year over the same period (PC, 2025a). The commission also provides quarterly updates on productivity data (PC, 2025b). The most recent update includes data up to the December 2024 quarter. Labour productivity was 1.2% lower in the December 2024 quarter than one year earlier.
By the December 2024 quarter, labour productivity for the economy was close to the average level for 2015 to 2019. Labour productivity for the market sector was slightly higher than the 2015-19 average but productivity for the growing non-market sector was lower and has fallen since 2022.
An important recent aspect of the development of the Australian economy has been growth in the care economy. According to Maltman and Rankin (2024), employment in the care economy, which they define as medical, aged, child and disability care, has increased from 10 per cent of the total in the early 2010s to around 15 per cent today. There has been little productivity growth in the care economy, in part because service quality concerns lead governments to prescribe the way in which services must be provided. However, other sectors (such as manufacturing) have also experienced slow productivity growth in recent years. The reallocation of labour to the care economy has reduced productivity growth to some extent for the economy as a whole but is not the main reason for the productivity slowdown.
The Productivity Commission demonstrates that the COVID-19 pandemic and its aftermath have distorted recent Australian data. There was a temporary improvement in productivity which had almost entirely disappeared by June 2023 as hours worked grew more rapidly than output. This demonstrates the importance of looking at longer-term productivity trends.
The December 2024 quarterly bulletin compares recent productivity trends in Australia and the United States. In the US, labour productivity for the non-farm business sector increased by an average of 2.1% a year over the five years from 2019 to 2024 (see BLS, 2025). This was faster than productivity growth in the 2007 to 2019 period of 1.5% a year but below productivity growth of 2.8% a year from 2001 to 2007. Over the 2019-24 period, Australian productivity for the economy as a whole grew by an average of 0.7% a year. Multifactor productivity also increased more slowly in Australia than the United States over the same period. Australian multifactor productivity grew by 0.46% a year, compared with 0.94% a year in the United States.
The Productivity Commission notes that differences between Australian and US productivity growth rates are partly due to compositional differences. The most used United States data exclude the non-market sector and the agricultural sector which are included in the Australian data. The policy response to COVID-19 differed between the countries. The Australian response emphasised maintaining the attachment of employees to their employers, but US policies emphasised unemployment benefits to a greater extent. Compared to the US, the Australian approach may have delayed employees moving to new, more productive employment. Any such effects are temporary and are now being unwound. Moreover, it remains to be seen whether rapid productivity growth can be sustained in the United States.
So far, we have considered data for the economy as a whole or large parts of it such as the market sector. It is useful also to consider data for individual firms. Some interesting work is reported on in the Treasury round-up for October 2022 (see Duretto, Majeed and Hambur, 2022, and Andrews et al, 2022). These authors note that since 2002 Australian firms have lagged further behind global frontier firms especially in sectors with declining entry and exit rates and where measures of competitive pressures have declined. This suggests that Australian firms are slower than in the past to innovate and improve their productivity performance, perhaps reflecting reduced business dynamism.
Taken together, the data presented in this section suggest reduced dynamism in the Australian economy.
Why did this occur?
The productivity of a country depends on its external economic environment, the quality of its institutions and the values of its people. These factors interact with and influence each other. While policies can readily be adjusted to reflect changing circumstances, institutions are more deeply embedded in a country’s culture but are capable of development in the light of changing circumstances (see McLean, 2013, pages 248-256).
Australia’s productivity growth has been strongest when it has been able to export goods and services in which it has a comparative advantage based on a well-functioning international trade system. Examples of such periods include the second half of the 19th century and the long period starting around 1960 during which Australia has provided raw materials and agricultural commodities to booming markets in Asia. Policy changes such as the reduction in industry protection and the microeconomic reform of the 1980s and 1990s enabled best advantage of these favourable conditions. Institutional changes followed, including the expansion of the tariff board ultimately to form the Productivity Commission and the economic regulation of monopoly industries to improve economic efficiency.
Innovation is encouraged when people value thinking for themselves, accepting risk and overcoming obstacles to achieve something (see Phelps, 2020, pages 12-13). Recent times have seen a shift to “self-expression values” that may be less encouraging of innovation, such as emphasis on community solidarity, opposition to dislocation and environmental protection. Continuing prosperity may generate a sense of entitlement or may encourage people to behave in ways that undermine economic growth. For example, McLean (2013, page 250) writes that “the windfall gains arising from the latest resource boom have largely been dissipated through higher consumption expenditure by private and public sectors”. Changing values will be reflected in policies and institutions that may, perhaps unintentionally, reduce innovation and productivity growth.
The slowdown in productivity growth from about 1970 occurred in developed countries including Australia. This points to the importance of values which are changing in many countries (on values, see Inglehart et al, 2022, Phelps, 2013, and Landes, 1998). Landes writes (page 523) “to be sure we are living in a dessert age. We want things to be sweet; too many of us work to live and live to be easy. Nothing wrong with that; it just does not promote high productivity. You want high productivity? Then you should live to work and get happiness as a by-product. Not easy. The people that live to work are a small and fortunate elite. But it is an elite open to newcomers, self-selected, the kind of people that accentuate the positive”.
A useful source of information is the World Values Study which has been conducted in seven waves from 1981 to 2022 and includes 120 societies that comprise 95% of the world’s population (Inglehart et al, 2014). These authors note that the values held by the population of a country depend on its history and religious and cultural traditions. But as economic development proceeds there is a shift first from traditional to secular-rational values (which is associated with industrialisation) and then from survival values to self-expression or post-materialist values (which is associated with a shift to a service or post-industrial economy). However, in adverse circumstances these changes may reverse themselves to some extent to place greater emphasis on materialist values.
During the last 30 years post-materialist values have become increasingly common in almost all post-industrial societies. There has been a shift from concern about physical and economic security towards self-expression, subjective well-being and quality of life. The shift in values has occurred where people have grown up under conditions where survival can be taken for granted. Post-materialist values are associated with an emphasis on environmental protection and increasing expectations of better roles and higher levels of participation by women in economic and social life.
The next stage is to examine some data from the World Values Study (Inglehart et al, 2014). We are particularly interested in any data that indicates that there has been a change in Australian values or that Australian values are unusual by international standards.
The study requests respondents to decide which is more important: protecting the environment or economic growth. The proportion of respondents in Australia selecting protection of the environment increased from 60% in 1994-98 to 66% in 2017-22. This provides evidence of the increasing importance of post-materialist values. The percentage favouring protection of the environment is similar in Australia, Canada and the United Kingdom but higher in Australia than in Germany, Japan or the United States.
Another important change is in the percentage of respondents who agree with the statement that work is very important in life. This has decreased in Australia from 51% in 1994-98 to 33% in 2017-22 and is lower than the percentages in Germany, the United Kingdom and the United States.
However, Australians are relatively accepting of competition. The percentage completely agreeing with the statement that competition is good was 21% in 2017-22 (down from 26% in 1994-98). This is higher than the corresponding percentage in Canada, Japan and the United Kingdom but less than in the United States.
The 2017-22 survey asked respondents to decide which is more important: freedom or security. More Australians chose freedom over security, but both were important. The percentage favouring freedom was higher In Australia than in Germany and Japan, but lower than in the United States.
Finally, the study asked respondents to decide which is more important: freedom or equality. The percentage in Australia in 2017-22 that chose freedom was 73% — higher than in Canada, Germany, Japan or the United Kingdom but less than in the United States.
These results illustrate the diversity of values that are held by the Australian community to which policy must respond. There is evidence of a shift from materialist values (such as the importance of work) to post-materialist values such as environmental protection. Security matters as well as freedom and matters more in Australia than in the United States.
Policy in a democracy will develop to reflect these changing values. An additional and somewhat related point is the role of special interest groups that argue for policies that reduce productivity and economic efficiency. One writer who would not have been surprised by the data on reducing productivity growth is the late Mancur Olson. In his book, The Rise and Decline of Nations, (1982). Olson argued that stable societies with unchanged borders over time tend to accumulate more organisations for collective action, such as unions, lobbies and cartels. Because they focus on distributional issues, special interest groups reduce efficiency and aggregate income in the societies in which they operate. Such organisations have many decisions to take, and decision making is likely to be slow because of the need to obtain widespread agreement. Distributional coalitions slow down society’s ability to adapt new technologies and to reallocate resources to adapt to changing conditions and reduce the rate of economic growth. The accumulation of distributional coalitions increases the complexity of regulation and the role of government and changes the direction of social evolution.
It is useful to distinguish between changes that produce a once-for-all increase in productivity, which then achieves a permanently higher level, and those that result in a sustained increase in the productivity growth rate. For example, the microeconomic reforms of the 1980s and 1990s resulted in a once-for-all increase in the level of productivity. Further microeconomic reform will be needed to continue this source of productivity growth.
Because of the compounding nature of productivity growth, small increases in the growth rate can result in large increases in income in the long term. To illustrate the point, note that $100 growing at 1% a year will result in $135 after 30 years. The corresponding figures for 1.5% and 2% growth are $156 and $181, respectively. Factors that are likely to influence productivity growth rates are discussed in the next section.
Sources of productivity growth
Why productivity growth occurs is a much-discussed topic. Nevertheless, there seems to be agreement that the following are important: the quality of a country’s labour force, the amount of investment in a country and the rate at which innovation occurs.
ABS data show that the percentage of the population with non-school (mainly tertiary) qualifications continues to increase (ABS, 2024a). We have an increasingly well qualified workforce. For example, the percentage of males aged 15 to 74 years with non-school qualifications increased from 58.7% in 2014 to 63% in 2024. The percentage of females with non-school qualifications increased from 55.5% to 63.6% over the same period.
Nevertheless, concern about the skills and attributes of the labour force persists. This is evidenced by CIS publications which, based on the results of standardised tests, have emphasised the poor literacy and numeracy of school leavers due to the less effective teaching methods of recent years (see, for example, Carter, 2004, and Jha, 2004). School leavers in particular and tertiary graduates to some extent are increasingly considered by employers to lack workforce readiness.
Private investment has been subdued in Australia in recent years — see Chart 2, below, and Bruno et al (2023).
Chart 2: Business investment as a percentage of GDP
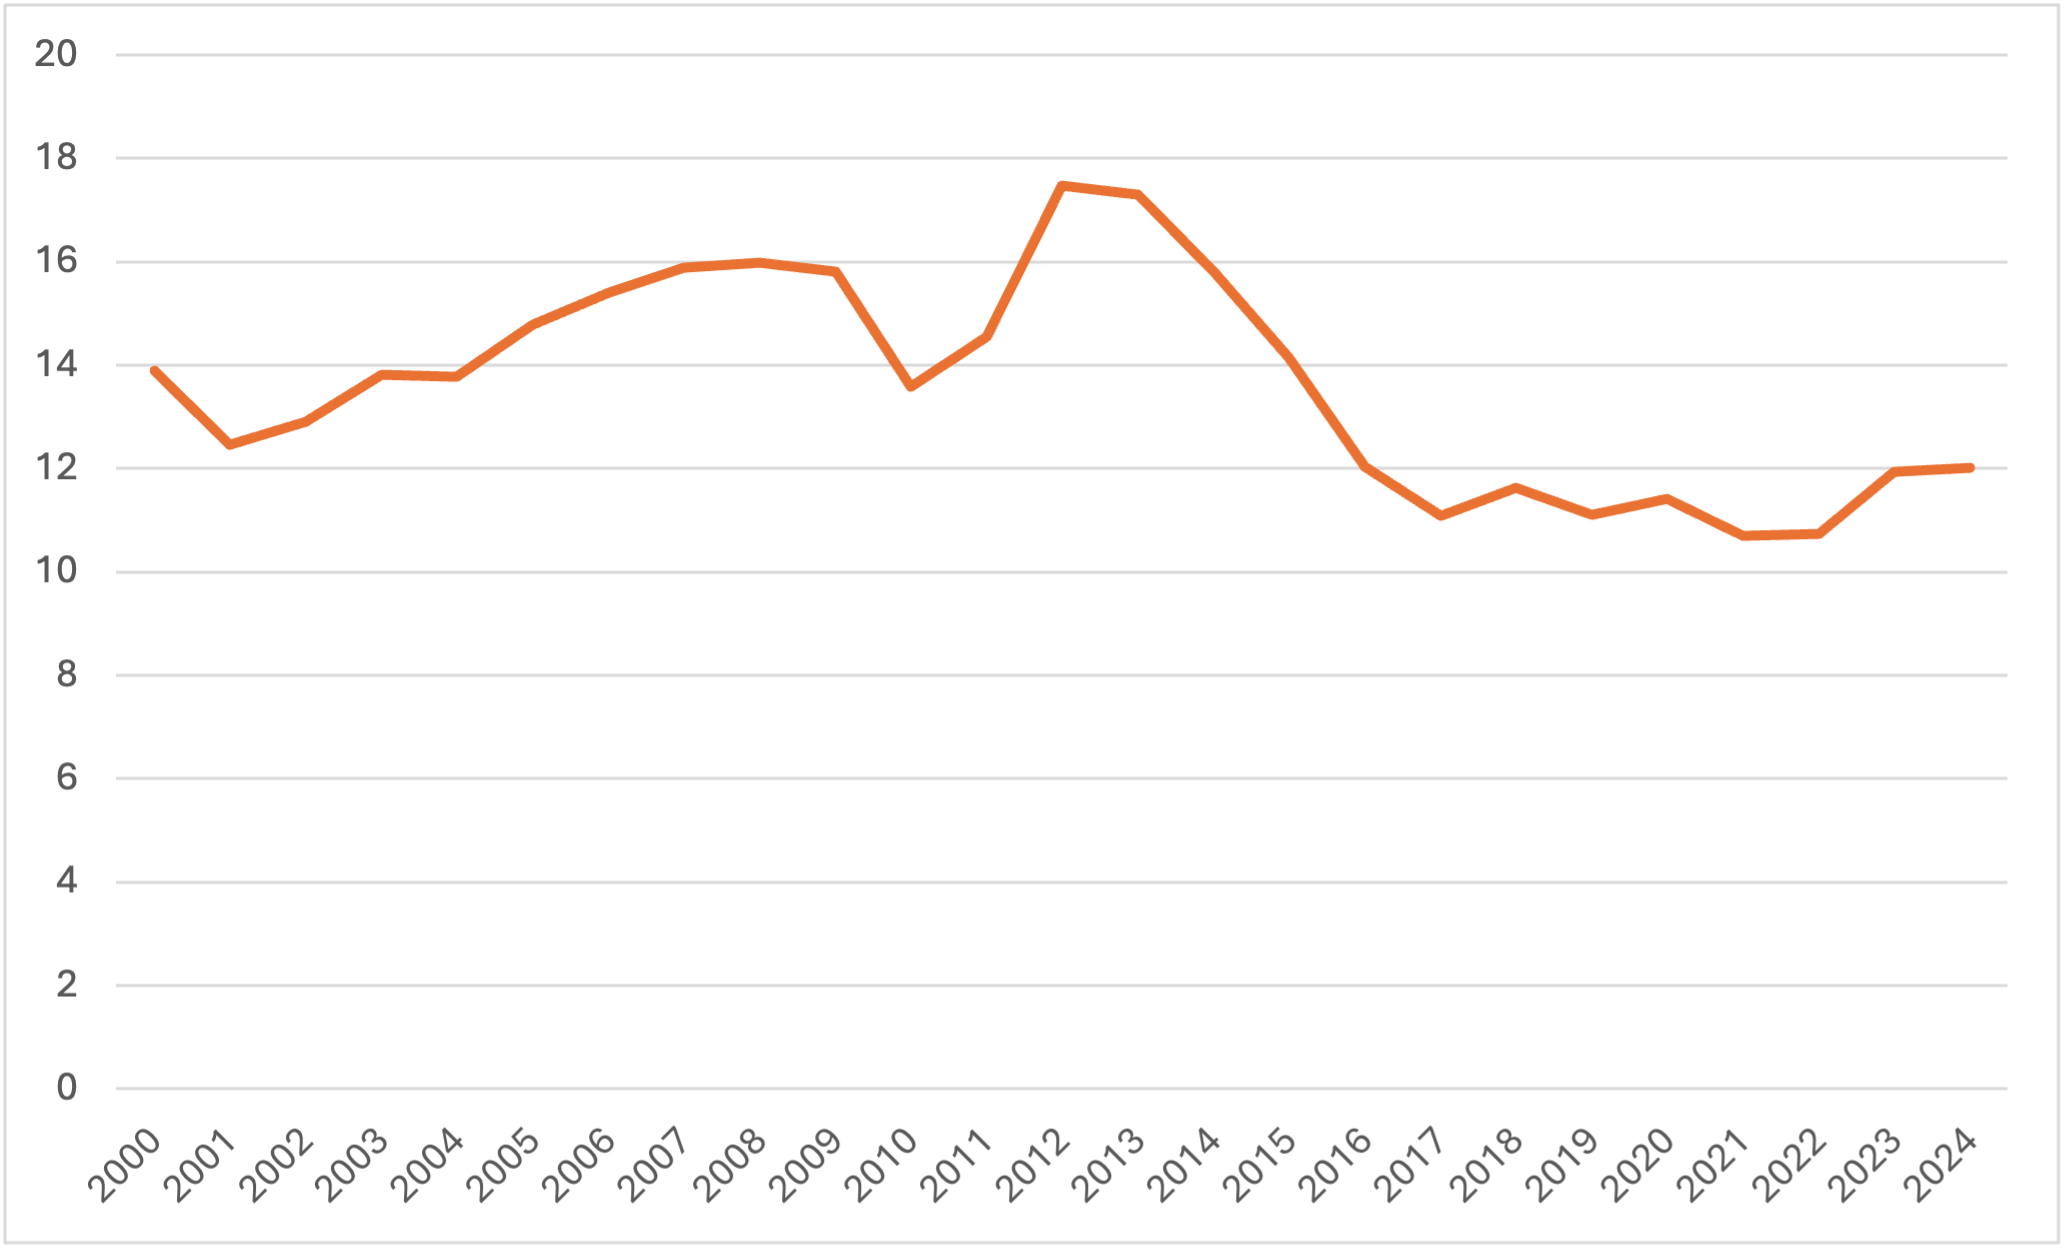
Source: ABS, 2025(d).
Private investment is important for productivity for two reasons. First, private investment increases the amount of capital that labour must work with in production. This increases labour productivity but not multifactor productivity. Secondly, new investment allows the latest (and therefore most efficient) techniques to be introduced into production. Low private investment is therefore indicative of a less dynamic economy.
Public investment is also important because it provides much of the basic infrastructure on which production depends. ABS data indicate that public investment has consistently been around 4 to 5% of GDP over the period from 2000 to 2024, perhaps with a slight tendency to increase over the period (see ABS, 2025e). Because much public investment is directed to non-economic objectives, the rate of return on this investment can be hard to assess. Nevertheless, it is important that public investment occurs where it provides benefits to society that exceed the cost. The problem, of course, is that public investment may be directed excessively to projects that are of benefit to a particular group rather than the whole population.
Innovation, the introduction of new and better ways of doing things, is widely seen as the key to improving productivity. Innovation is not the same as invention. What matters is not just that a technology exists but that it is used to provide goods and services. Successful innovation requires a balance between investment in research and development, the organisation of production and sales and marketing. It requires the cooperation of entrepreneurs, researchers, managers, employees, makers of intermediate inputs to production and venturesome consumers who are willing to try new products and services and suggest improvements (see Bhide, 2009).
Uncertainty is an important characteristic of innovation. Before an innovation is attempted, it may be impossible to say whether the benefits of the innovation to society will exceed the costs. The brave people who undertake innovation, and especially inventors and entrepreneurs, have been much studied (for examples, see Ridley, 2020 and Zoega, 2020). These studies have emphasised that innovation is a trial-and-error process that involves imagination, experimentation, openness to change and willingness to accept risks, including the risk of failure.
There is also an extensive historical literature on the characteristics of societies that have been successful at innovation (see Rosenberg and Birdzell, 1986, Landes, 1998 and Phelps, 2013). These societies have accepted that trade and commerce is in the public interest and government should support them. They have been willing to delegate decisions on whether to innovate rather than centralise decision making in government and have allowed experimentation and for the market to provide substantial rewards for success and penalties for failure. Zoega, in his study of Iceland’s successful innovators, notes that the following factors support innovation: simple laws and regulations; easy access to financing; trust in business relations; innovation for the world rather than domestic market; a culture that is forgiving of failure and appreciative of risk taking; and a welfare state to limit the penalty for unsuccessful innovation.
But there is another side. Innovation involves change and change is often resisted by those who have every reason to do so. Innovation involves dislocation, threatens carefully developed skills and ways of working and may weaken community ties and family relationships. Innovation involves losses as well as gains; the losses are not only financial ones. In principle, the gainers could compensate the losers, but this is not always done adequately or completely. For these reasons there has often been opposition to policies that encourage a rapid rate of innovation.
The rate at which new knowledge is diffusing through the Australian economy seems to be slowing down (see Duretto et al, 2022, Andrews et al, 2022 and Day et al, 2022). They show that the entry of new firms and the exit of old firms slowed over the period from 2005-06 to 2021-22; industry concentration and mark-ups have increased; the reallocation of labour to the more productive firms is occurring more slowly; and Australian firms are falling behind the global frontier firms and the rate at which they catch up to the frontier has slowed.
Similar trends have been noted in overseas countries. Akcigit and Ates (2019) note that these trends are consistent with a decline in the diffusion of new knowledge between frontier and laggard firms. They suggest that possible explanations for the decline in diffusion include the increasingly data dependent nature of production, regulation that favours existing firms, the increasing offshoring of production, and the anti-competitive use of intellectual property rights.
A slowdown in the rate of innovation could result from characteristics of some markets such as economies of scale, difficulties for small firms in obtaining finance or perhaps an excessively short-term approach in assessing a firm’s financial performance. It could also be the result of regulation that sets standards that benefit incumbents, limits entry through licensing or simply takes too long to make decisions. A particular difficulty is the verbal nature of regulatory processes, with successive rounds of consultations and submissions that may prove challenging for innovators who cannot readily demonstrate in advance that their proposed innovation provides benefits to society that exceed the costs. Australia’s system of labour market regulation, with its emphasis on process, may well discourage innovation by making it difficult to adopt new business models or reallocate capital and labour to expanding activities.
Government subsidy and taxation programs can vary the direction that innovation takes, not necessarily to best advantage. Although investment in research and development is desirable, it may not always be more important than changes in production methods or marketing.
Why does the productivity slowdown matter?
As we have argued, over the longer-term productivity growth is the main contributor to growth in a country’s prosperity and improving living standards. The arguments for productivity growth are in large part those for economic growth itself.
A more prosperous society can enjoy more of whatever it is that its members want. This may be more goods and services. Our lives are more comfortable and convenient than those of people one hundred years ago (see Gordon, 2016). But people may take some of the benefits of productivity growth through reduced hours of work. Hours of work have continued to fall in recent years for men.
Between June 2001 and June 2024, the average hours usually worked in all jobs in a week reduced, for all persons, from 37.0 to 35.3. The average for men reduced from 41.8 to 38.5 but that for women increased from 30.9 to 31.8 (see ABS, 2025e).
A more prosperous society can enjoy a higher quality of life by providing more goods and services that are good in themselves, even though the market demand for them may be insufficient. These non-economic objectives might include better public health, more education, environmental protection, assistance to the disadvantaged and disabled, consumer protection, defence, sporting events and assistance to the arts, and foreign aid. The extent to which each of these objectives is pursued is a decision for the relevant society made through the political process.
Because of the effects of compounding, small differences in productivity growth rates can result over time in large differences in economic output. This has important implications for economic policy. If we take a long-term view, promoting productivity growth should be a priority because it will enable society to meet more of its economic and non-economic objectives.
We should, therefore, be careful about policies to achieve non-economic objectives now that have the side-effect of reducing productivity growth since this will reduce society’s ability to achieve these objectives in future. There are implications here for equity between generations. If non-economic objectives are pursued at present at the expense of productivity growth, this will reduce the capacity of future generations to pursue non-economic objectives.
As noted earlier, the growth of regulation seems to have made innovation harder. This is not to question the non-economic objectives that are pursued through regulation or the regulations themselves. But it suggests that care needs to be taken to ensure that the effect of regulation on innovation is no greater than it needs to be.
These concerns are made more pressing by the growth in the number of regulatory obligations in recent years. The Institute of Public Affairs has estimated this by measuring the restrictive content of legislation and regulations through “a machine-learning textual analysis” (see Wild and Hussey, 2020). They find that the number of regulatory restrictions included in Acts of Parliament at the Commonwealth level increased from 23,558 in 1977 to 122,798 in 2019, or by 10% a year on average. Over the shorter period from 2005 to 2019 regulatory restrictions included in Commonwealth legislation and delegated legislation increased from 197,658 in 2005 to 356,198 in 2019, or by 5.5% a year on average. In addition to this state governments have regulatory obligations that, in some cases, are similar in number to those of the Commonwealth.
So far, we have been discussing the direct effects of productivity growth on economic welfare. There are also indirect effects to consider. Economic growth can have adverse side effects such as damage to the environment or over-tourism. But there are also beneficial side effects (see Friedman, 2005a, 2005b). Where incomes are rising slowly, politics can easily become a zero-sum process in which groups compete to improve their relative status. This zero-sum approach can result in the adoption of policies that make the problem worse by reducing productivity growth. People will be less concerned about their relative status where growing prosperity is spread widely. This will encourage a less defensive and inward-looking approach in society and greater openness, social mobility and tolerance, and support of democracy. Productivity growth should be supported to encourage these developments in society.
There is evidence in support of these propositions. The World Values Study authors note that the past few decades have witnessed some of the most dramatic cultural changes in recorded history (Inglehart et al, 2023). “Equal rights for women, gays and lesbians, foreigners and other outgroups tend to be rejected in societies where survival is uncertain but are increasingly accepted in societies that emphasise self-expression values.” A specific set of self-expression values, emancipation values, encourages movements towards democracy and participation in civic life. Moreover, “in any given society those with higher incomes, higher education and jobs in the service sector tend to emphasise self-expression values more strongly than the rest of their compatriots”.
For all these reasons the slow productivity growth of recent years is, in my view, an unwelcome development. The question is what might be done about it given the diversity of values and interests that exists in Australia. This will be the subject of an ensuing paper.
References
ABS (2024a), Australian Bureau of Statistics, Education and Work, Australia, table 26, released
ABS (2025a), Australian Bureau of Statistics, Estimates of Industry Multifactor Productivity Methodology, 2023-24, released 22/01/2025.
ABS (2025b), Australian Bureau of Statistics, Australian National Accounts, National Income, Expenditure and Product Methodology, released 5/03/2025.
ABS (2025c), Australian Bureau of Statistics, Estimates of Industry Multifactor Productivity, released 22/01/2025.
ABS (2025d), Australian Bureau of Statistics, Australian National Accounts, National Income, Expenditure and Product (5206.4), table 3, released 5/03/2025.
ABS (2025e), Australian Bureau of Statistics, Labour Force Australia, Detailed, employed people by hours normally worked in all jobs, table 10, released 22/01/2025.
Akcigit U. and Ates S.(2019), “Ten Facts on Declining Business Dynamism and Lessons from Endogenous Growth Theory”, NBER Working Paper No 25755.
Andrews D., Hambur J., Hansell D., and Wheeler A. (2022), Reaching for the Stars: Australian Firms and the Global Productivity Frontier, Treasury Working Paper 2022-01.
Bergaud A., Cette G., and Lecat R. (2016) “Productivity Trends in Advanced Countries between 1890 and 2012” Review of Income and Wealth, volume 62 no 3.
Bhide A.(2009) “The Venturesome Economy: How Innovation Sustains Prosperity in a More Connected World”, Journal of Applied Corporate Finance, volume 21 no 1.
BLS (2025) US Bureau of Labor Statistics, productivity home page (www.bls/gov/productivity).
Bruno A., Dunphy J., and Georgiakis F.,(2023), “Recent Trends in Australian Productivity”, Reserve Bank of Australia Bulletin, September 2023.
Carter J. (2024), Shaping Teacher Tools: Creating an Evidence -Based Standard for Quality Instructional Methods, Centre for Independent Studies, Analysis Paper 69.
Day I., Duretto Z., Hartigan P., and Hambur J.(2022), “Competition in Australia and its Impact on Productivity Growth”, Treasury Round Up, October 2022.
DISR (2024), Department of Industry, Science and Resources, Australian Innovation Statistics, published 18/10/2024.
Duretto Z., Majeed O., and Hambur J. (2022), “Overview: Understanding Productivity in Australia and the Global Slowdown, Treasury Round Up, October 2022.
Feenstra R.C., Inklaar R and Timmer (2015), “The Next Generation of the Penn World Table”, American Economic Review, 105(10), available for download at www.rug.nl/ggdc/productivity/pwt.
Friedman B. (2005a), The Moral Consequences of Economic Growth, New York, Alfred A. Knopf.
Friedman B. (2005b), “The Moral Case for Growth”, The International Economy, Fall 2005.
Gordon R.J. (2016), The Rise and Fall of American Growth: The US Standard of Living since the Civil War, Princeton University Press, Princeton and Oxford.
Inglehart R., Haerpfur C., Moreno A., Welzel C.,Kizlova K., Diez-Medrano J., Lagos M., Norris P., Poriarin E., Piranen B., et al (2014), World Values Survey: All Rounds, Country-Pooled Data Filed Version.
Inglehart R., and Welzel C., (2023), World Values Survey 7: Findings and Insights at www.worldvaluessurvey.org.
Jha T., (2024), Implementing the Science of Learning, Centre for Independent Studies, Research Report 47.
Landes D. (1998), The Wealth and Poverty of Nations: Why Some are So Rich and Some so Poor, Little, Brown and Company, London.
Maltman M. and Rankin E. (2024), What if We Didn’t Care: Implications of the Growth in the Care Economy for the Broad Macroeconomy, e61 Institute, Research Note, 10 October 2024, www.e61.in/what-if-we-didn’t-care-implications-of-the-growth-in-the-care-economy-for-the-broader-macroeconomy/
McLean I. (2013), Why Australia Prospered: The Shifting Sources of Economic Growth, Princeton University Press, Princeton and Oxford.
Olson M. (1982), The Rise and Decline of Nations: Economic Growth, Stagflation and Social Rigidities, Yale University Press, New Haven and London.
Our World in Data (2025), Productivity: Output per hour worked; 2019 (www.ourworldindata.org/labor-productivity-per-hour-pennworldtable). Data sources are Feenstra et al (2015), Penn World Tables (2021) with major processing by Our World in Data.
Penn World Tables (2021), Penn World Table 10.01 by Rober C Feenstra, Robert Inklaar and Marcel P. Timmer. See also Feenstra (2015).
PC (2025a), Productivity Commission, Ongoing reporting: Australia’s productivity performance.
PC (2025b), Productivity Commission, Quarterly Productivity Bulletin – March 2025.
Phelps E. (2013), Mass Flourishing: How Grassroots Innovation Created Jobs, Challenge and Change, Princeton University Press, Princeton and London.
Phelps E., Bojilov R., Hoon H-T., and Zoega G. (2020), Dynamism: The Values that Drive Innovation, Job Satisfaction and Economic Growth, Harvard University Press, Cambridge Mass. And London.
Ridley M. (2020), How Innovation Works, 4th Estate, London.
Rosenberg N., and Birdzell L. (1986), How the West Grew Rich: The Economic Transformation of the Industrial World, Basic Books, New York.
Wild D. and Hussey C., (2019), The Growth of Regulation in Australia, Institute of Public Affairs.
Zoega G. (2020), A Case Study of Iceland’s Successful Innovators, in Phelps et al (2013).