
Executive Summary
The absolute and relative deprivation experienced by Indigenous people in remote and very remote Australia is well known. However, Indigenous people in remote areas are often lumped together as a single national category. There is little understanding of how the different states and territories perform in terms of the economic wellbeing of Indigenous people in remote and very remote areas.
The major finding of this research is that the Northern Territory has the worst economic outcomes for Indigenous people in remote or very remote locations of any state or territory in Australia by some margin, while South Australia has the best.
Introduction
The absolute and relative deprivation experienced by Indigenous people in remote and very remote Australia[1] is well known. However, Indigenous people in remote areas are often lumped together as a single national category. There is little understanding of how the different states and territories perform in terms of the economic wellbeing of Indigenous people in remote and very remote areas across the different states and territories.
Remote and very remote locations were the focus of this report because:
- That is where Indigenous deprivation is most acute, and the gap between Indigenous and non-Indigenous Australians is most pronounced. Income and employment rates get worse for Indigenous people the more remote the location.
- A large number of Indigenous people live in those locations in absolute numbers and particularly as a percentage of the total population. The Australian Institute of Health and Welfare (AIHW) projected that 153,700 Indigenous people, 17.8% of the Indigenous population, lived in remote or very remote locations by 2020.[2] In the 2016 census, Indigenous people made up 18.2% of people in remote locations and 47.2% of people living in very remote locations.[3]
The major finding of this research is that the Northern Territory has the worst economic outcomes for Indigenous people in remote or very remote locations of any state or territory in Australia by some margin. South Australia has the best. Based on the data,[4] the ranking for economic outcomes for Indigenous people in remote and very remote locations is:
1) South Australia
2) Western Australia
3) Queensland
4) New South Wales
5) The Northern Territory
This paper argues that extractive economic and political institutions for Indigenous people in the NT are contributing to the ‘Territory Gap’,[5] as the NT has the most extractive institutions of all — specifically, the Aboriginal Land Rights (Northern Territory) Act 1976 (ALRA) and the powerful regional Land Councils both in terms of their statutory functions under ALRA and their operational performance.
The long-term solution to Indigenous deprivation in remote and very remote NT is the development of a set of authentic, robust and inclusive political and economic institutions organically from those communities. For that to occur, the extractive institutions currently in place must be removed or reformed.
It could also be argued that general features of the NT affecting both non-Indigenous and Indigenous people might be driving the Territory Gap. These might include lack of economic opportunities, inhospitable climate, small population, or low population density. Proponents of this view may attribute the comparative economic success of non-Indigenous Territorians in remote and very remote areas to the large number of non-Indigenous service providers attracting generous public sector salaries. Either way, the Territory Gap must become a focus for leaders and policy-makers.
Research methodology
The Northern Territory, Western Australia, Queensland, New South Wales, and South Australia were selected for this analysis because they have significant Indigenous populations in remote and very remote areas. Data for six indicators was collected from the 2006, 2011 and 2016 censuses to provide insight on the State and Territory variations between Indigenous people in remote and very remote locations:[6] median total personal income, unemployment rate, labour force participation rate, employment rate, employment in private sector, and percentage of privately owned dwellings.
These indicators measure employment and its effects, and housing. Employment and housing are the basic building blocks of economic life in Australia, leading to myriad other positive economic, social and cultural outcomes. The jurisdictions examined were selected due to having significant Indigenous populations in remote and very remote areas.
Remote and very remote populations
The Australian Institute of Health and Welfare (AIHW) projected that 17.8% of Indigenous people lived in remote or very remote locations by 2020, a total of 153,700 out of 864,200 Indigenous Australians.[7] In the 2016 census, Indigenous people made up 18.2% of people in remote locations (53,507 out of 293,402) and 47.2% of people living in very remote locations (95,222 out of 201,551).[8] The Northern Territory has the highest Indigenous population in remote and very remote locations of any jurisdiction (see Table 1). In very remote NT communities, Indigenous people are in the majority — the only remoteness category anywhere in Australia where that’s the case.
Table 1: Indigenous population in remote and very remote areas
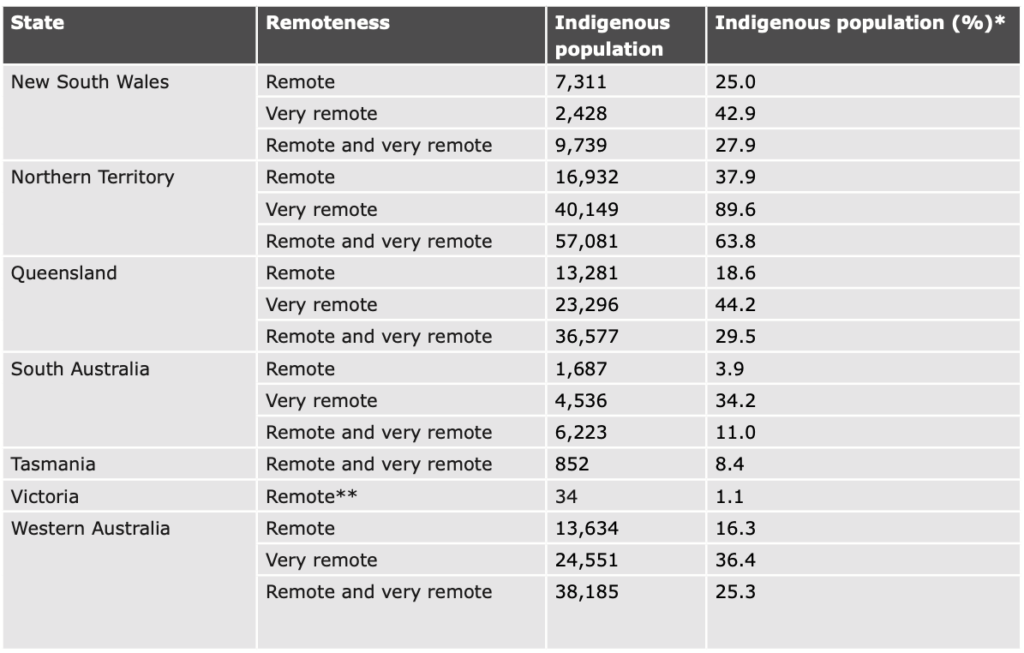
Source: AIHW analysis of Australian Bureau of Statistics (2018). Estimates of Aboriginal and Torres Strait Islander Australians, June 2016, ABS cat. no. 3238.0.55.001, Canberra. * Percentage of Indigenous people in that specific remoteness category in that jurisdiction. For example, 25.0% of people living in remote NSW are Indigenous. The AIHW analysis didn’t include percentages. Percentages have been calculated by combining the AIHW population figure with the raw ABS data. ** AIHW did not provide a discrete figure for remote Victoria. In this case raw ABS data only was used.
The ABS estimates that the Indigenous population in remote and very remote areas will increase by between 0.5% and 0.8% by 2031, to a total of between 161,100 and 167,300. This growth rate is lower than the predicted growth rate of the overall Indigenous population of 1.8% to 2.1%.
It’s also lower than the predicted rate of growth of the Indigenous population in major cities, inner regional areas, and outer regional areas.[9] No doubt this low growth rate is at least in part attributable to some of the issues raised in this paper.
Figure 1: ABS remoteness categories for Australia 2016
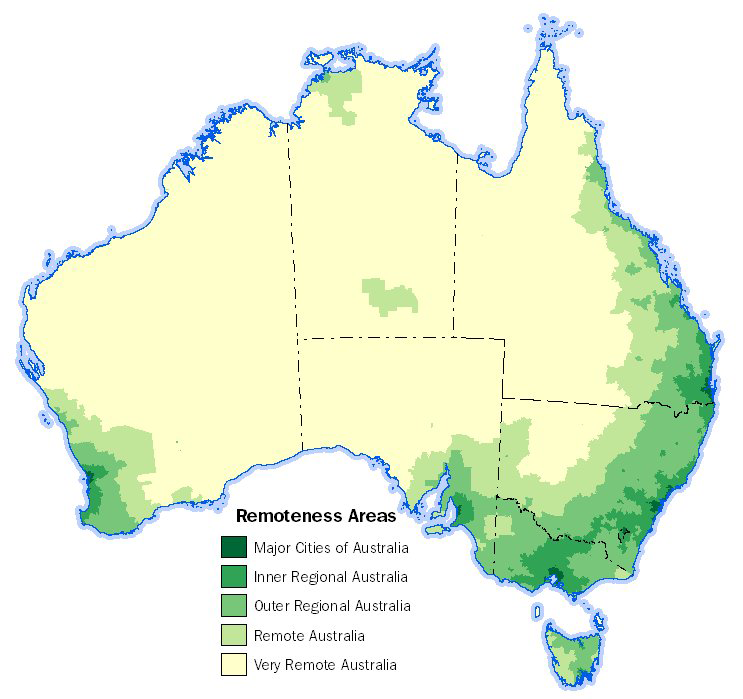
Source: ABS (2016), ‘Remoteness Structure’, accessed 15/6/21 <https://www.abs.gov.au/websitedbs/d3310114.nsf/home/remoteness+structure>
In the most recent ‘Closing the Gap’ (CtG) Annual Data Compilation Report, it was noted that new disaggregation of data by remoteness for eight targets was introduced.[10] While this is a positive step towards recognising that Indigenous disadvantage and disparity occurs most acutely in remote and very remote areas, it is astonishing this has not happened earlier — given the CtG framework was introduced in 2008.
Crucially, this report in part focuses on very remote areas. Frequently remote and very remote areas are combined and analysed as a bloc and it’s possible many believe remote areas to be more common than very remote areas. However, approximately 75% of the Australian landmass is considered very remote by the ABS. Almost double the number of Indigenous people live in very remote areas compared to remote areas (53,507 remote v 95,222 very remote). Furthermore, Indigenous people make up 18.2% of people living in remote areas, but 47.2% of people living in very remote areas.[11] In the NT, Indigenous people make up 89.6% of people living in very remote areas — the only remoteness category anywhere in Australia where Indigenous people are in the majority.[12] The ABS designates almost all of the NT as very remote with only relatively small areas around Alice Springs and Darwin not in that category (see Figure 1). The very remote designation is a vital category for understanding Indigenous deprivation.
Overall remote area disparities
Indigenous deprivation is most acute in remote areas. In 2016, the median personal disposable income per week for Indigenous people in major cities was $499, and decreased with remoteness down to $292 in very remote areas. The median disposable income per week for Indigenous households in major cities was $647, but was $389 in very remote areas.[13]
In the 2017-18 to 2018-19 period, after adjusting for inflation, the difference between non-Indigenous and Indigenous Australians in median personal income per week was most pronounced in remote areas; where it was 85% higher for non-Indigenous Australians ($813 to $440). It was 52.5% higher for non-Indigenous Australians in major cities and 51.2% higher in inner regional areas (data was not available for very remote areas).[14]
Likewise, employment rates get worse for Indigenous people the more remote the location. The employment rate in major cities for Indigenous Australians from 2017-19 was 59.3%. It was 35.1% in very remote locations (see Table 2).[15] This is significant when current CtG targets are taken into account. CtG target number 8 is: “By 2031, increase the proportion of Aboriginal and Torres Strait Islander people aged 25-64 who are employed to 62%”.[16] That has almost been achieved in major cities. Remote and very remote communities are clearly where the work needs to be done.
Senator Jacinta Nampijinpa Price noted last year that throughout Australia, Indigenous unemployment is three times higher than non-Indigenous unemployment, however, in very remote communities that disparity is much greater — a 29% Indigenous unemployment rate compared to a 3% non-Indigenous unemployment rate.[17]
Table 2: Proportion of employed people aged 15–64, by remoteness area 2017–19
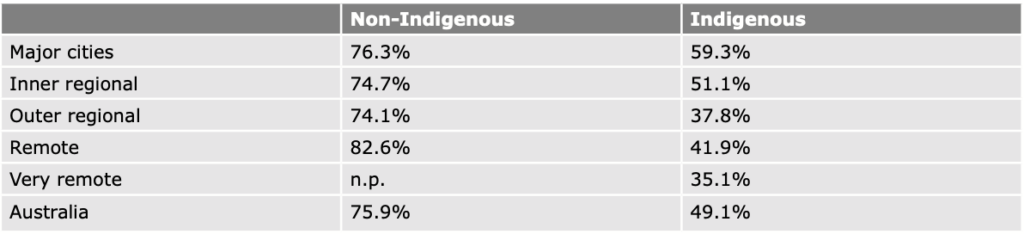
Source: AIHW analysis of ABS (2019a) ‘Microdata: National Aboriginal and Torres Strait Islander Social Survey 2018-19’, Findings based on the use of TableBuilder data. cat. no. 4720.0.55.002. Canberra; ABS (2019b) ‘Microdata: National Health Survey 2017-18’, Findings based on the use of TableBuilder data. cat. no. 4324.0.55.001. Canberra; Steering Committee for the Review of Government Service Provision (2020) ‘Overcoming Indigenous disadvantage: Key indicators 2020’, Canberra: Productivity Commission, Viewed 5 August 2021.
Note: Data categorised as 2017-19 are from 2018-19 for Indigenous Australians and 2017-18 for non-Indigenous Australians.
The gap between non-Indigenous and Indigenous mean life expectancy for men in 2015-17 for all of Australia was 8.6 years. In remote and very remote areas it was 10.1 years. The gap between non-Indigenous and Indigenous mean life expectancy for women in 2015-17 for all of Australia was 7.8 years. In remote and very remote areas it was 10.4 years.[18] The number one CtG target is “Close the gap in life expectancy within a generation, by 2031.”[19] Once again, it would seem that remote and very remote areas should be the focus.
The Territory Gap
The Northern Territory has the worst economic outcomes for Indigenous people in remote and very remote areas of any state or territory in Australia.
Income gaps
Remote
Based on the below data, the ranking[20] of the states for income for Indigenous people in remote and very remote locations is:
1) Western Australia
2) New South Wales and Queensland
3) South Australia
4) The Northern Territory
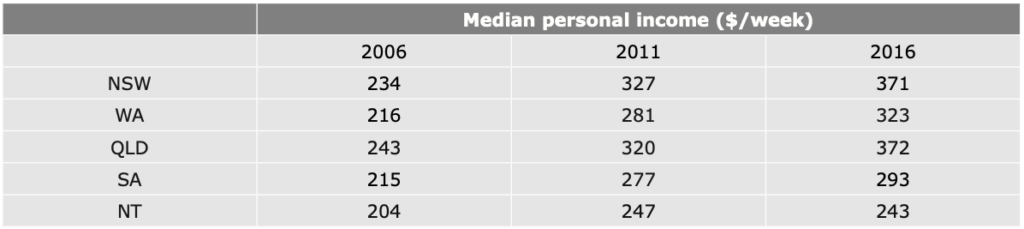
The NT came last for median personal weekly income in remote areas both in 2016 and going back to the 2006 and 2011 censuses. Indeed, the median personal weekly income of Indigenous people in remote NT was 24.5% lower than the average[21] of the other four states.
Table 3: Indigenous income in remote areas – 2006, 2011, 2016 censuses
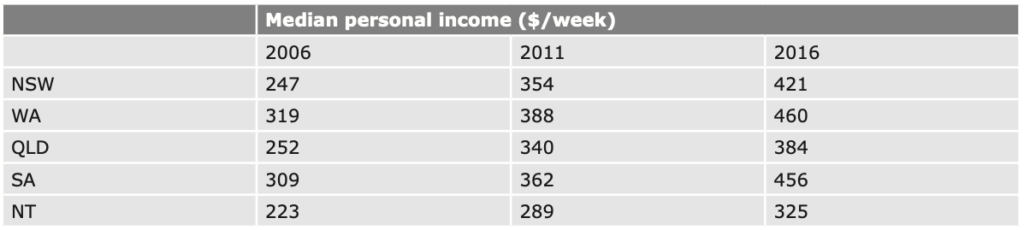
Source: ABS (2017), ‘2016 Census of Population and Housing, Aboriginal and Torres Strait Islander Peoples Profile’, ABS cat. no. 2002.0, Canberra; ABS (2012), 2011 Census of Population and Housing, Aboriginal and Torres Strait Islander Peoples (Indigenous) Profile’, ABS cat. no. 2002.0, Canberra; ABS (2007), ‘2006 Census Community Profile Series, Indigenous Profile, ABS cat. no. 2002.0, Canberra.
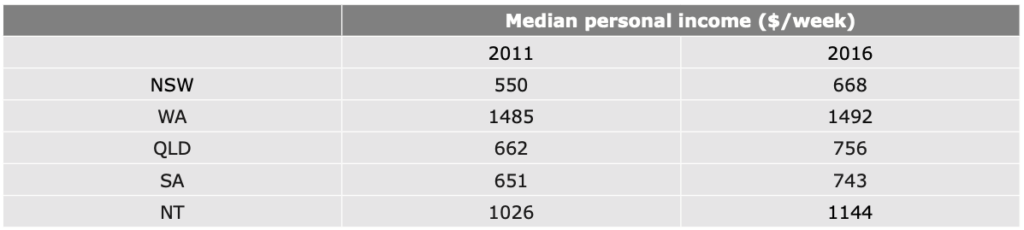
For non-Indigenous people, the NT came first, both in 2016 and in the 2011 census. In 2016, weekly median personal income of non-Indigenous people was 44.6% higher than the average of the other states examined in this analysis.
Table 4: non-Indigenous income in remote areas – 2011 & 2016 censuses
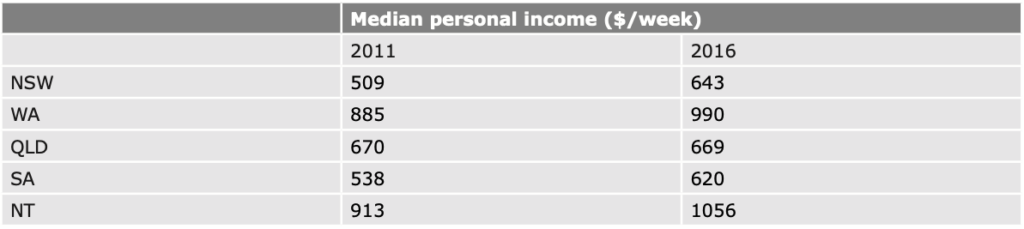
Source: ABS (2017), ‘2016 Census of Population and Housing, Aboriginal and Torres Strait Islander Peoples Profile’, ABS cat. no. 2002.0, Canberra; ABS (2012), 2011 Census of Population and Housing, Aboriginal and Torres Strait Islander Peoples (Indigenous) Profile’, ABS cat. no. 2002.0, Canberra.
Very remote
Indigenous people in very remote NT also come last in median weekly personal income. This is also true in the 2006 and 2011 censuses. In 2016, the median personal income of Indigenous people in very remote NT was 28.5% lower than the average of the other states.
Table 5: Indigenous income in very remote areas – 2006, 2011, 2016 censuses
Source: ABS (2017), ‘2016 Census of Population and Housing, Aboriginal and Torres Strait Islander Peoples Profile’, ABS cat. no. 2002.0, Canberra; ABS (2012), 2011 Census of Population and Housing, Aboriginal and Torres Strait Islander Peoples (Indigenous) Profile’, ABS cat. no. 2002.0, Canberra; ABS (2007), ‘2006 Census Community Profile Series, Indigenous Profile, ABS cat. no. 2002.0, Canberra.
Unlike with remote areas, the NT did not come first in very remote areas for median weekly personal income for non-Indigenous people either in 2016 or 2011. However, non-Indigenous people in very remote NT still have a 25.1% higher median weekly personal income than the average of the other states in this analysis.
Table 6: non-Indigenous income in very remote areas – 2011 & 2016 censuses
Source: ABS (2017), ‘2016 Census of Population and Housing, Aboriginal and Torres Strait Islander Peoples Profile’, ABS cat. no. 2002.0, Canberra; ABS (2012), 2011 Census of Population and Housing, Aboriginal and Torres Strait Islander Peoples (Indigenous) Profile’, ABS cat. no. 2002.0, Canberra.
Unemployment and economic participation gaps
Based on the below data, the ranking of the states for unemployment and the participation rate for Indigenous people in remote and very remote locations is:
1) South Australia
2) Queensland
3) Western Australia
4) New South Wales
5) The Northern Territory
Remote
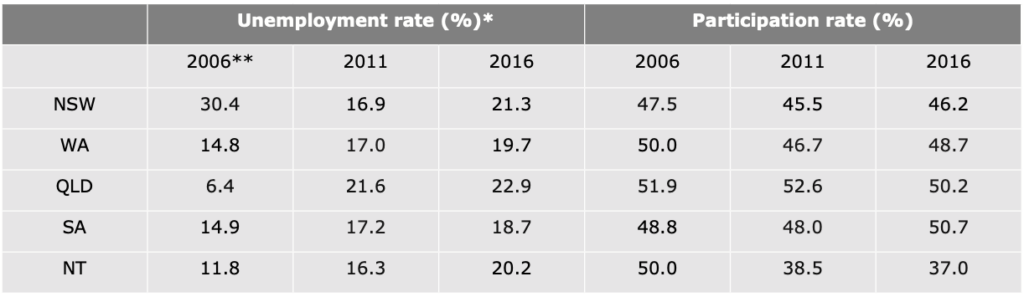
The NT didn’t come last for unemployment for Indigenous people in remote areas in 2016, but it did come last in participation rate — a factor contributing to a lower unemployment rate. Remote NT actually had the lowest Indigenous unemployment rate in 2011, but once again the lowest participation rate. In 2006, it had neither the worst unemployment rate nor participation rate. In 2016, the remote Indigenous participation rate in the NT was 24.5% lower than the average of the other states. The unemployment rate was actually 0.5% lower than the average of the other states — the only indicator in remote or very remote areas where the NT actually performed better than the average of the other states. However, this result is impacted by the NT’s significantly lower participation rate.
Table 7: Indigenous unemployment and participation in remote areas – 2006, 2011, 2016 censuses
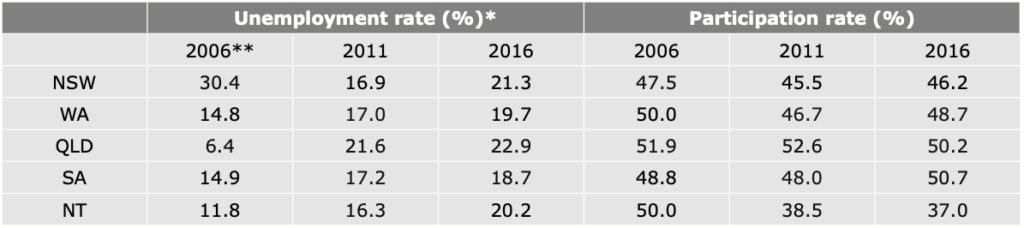
Source: ABS (2017), ‘2016 Census of Population and Housing, Aboriginal and Torres Strait Islander Peoples Profile’, ABS cat. no. 2002.0, Canberra; ABS (2012), 2011 Census of Population and Housing, Aboriginal and Torres Strait Islander Peoples (Indigenous) Profile’, ABS cat. no. 2002.0, Canberra; ABS (2007), ‘2006 Census Community Profile Series, Indigenous Profile, ABS cat. no. 2002.0, Canberra.
*For 2011 and 2016 the ABS provided a figure for the Indigenous unemployment rate, participation rate, and employment to population in remote areas. These were not provided for 2006 and were calculated manually for this research using ABS data.
**In ABS surveys and Censuses conducted before July 2009, Community Development Employment Projects (CDEP) participants were classified as employed. ABS products have not considered participants in CDEP’s replacement scheme, the Community Development Program, to be employed. This has contributed to an overstatement of Indigenous employment prior to July 2009.
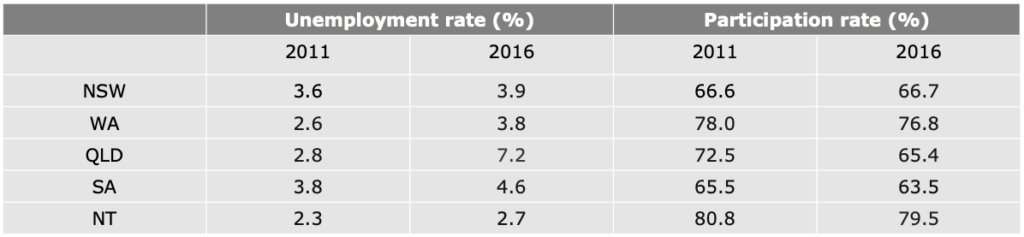
Non-Indigenous Territorians in remote areas had the lowest unemployment and highest participation rate of any of the jurisdictions considered in this report in 2016 and 2011. The unemployment rate is 44.6% lower than the average of the other states and the participation rate is 16.7% higher.
Table 8: non-Indigenous unemployment and participation in remote areas – 2011 & 2016 censuses
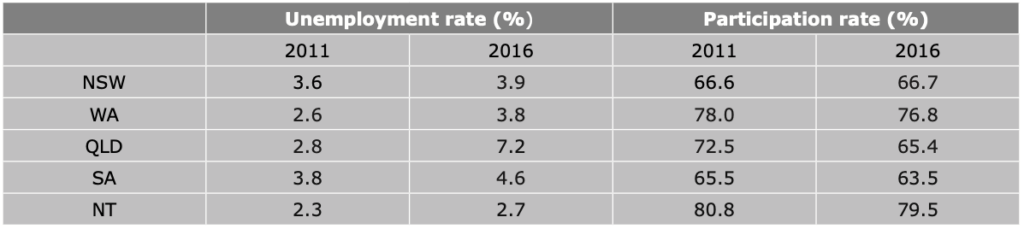
Source: ABS (2017), ‘2016 Census of Population and Housing, Aboriginal and Torres Strait Islander Peoples Profile’, ABS cat. no. 2002.0, Canberra; ABS (2012), 2011 Census of Population and Housing, Aboriginal and Torres Strait Islander Peoples (Indigenous) Profile’, ABS cat. no. 2002.0, Canberra.
Very remote
In very remote areas in the NT, the unemployment and participation rates are significantly worse for Indigenous people than in remote areas. This is significant given, as outlined above, 40,149 Indigenous people live in very remote areas in the NT while only 16,932 live in remote areas. Indigenous people in very remote areas of the NT rank last in unemployment and participation rate in the 2006, 2011 and 2016 censuses. The unemployment rate in 2016 was 51.8% higher than the average of the other states and the participation rate was 16.1% lower.
Table 9: Indigenous unemployment and participation in very remote areas – 2006, 2011, 2016 censuses
Source: ABS (2017), ‘2016 Census of Population and Housing, Aboriginal and Torres Strait Islander Peoples Profile’, ABS cat. no. 2002.0, Canberra; ABS (2012), 2011 Census of Population and Housing, Aboriginal and Torres Strait Islander Peoples (Indigenous) Profile’, ABS cat. no. 2002.0, Canberra; ABS (2007), ‘2006 Census Community Profile Series, Indigenous Profile, ABS cat. no. 2002.0, Canberra.
*For 2011 and 2016 the ABS provided a figure for the Indigenous unemployment rate, participation rate, and employment to population in remote areas. These were not provided for 2006 and were calculated manually for this research using ABS data.
** In ABS surveys and Censuses conducted before July 2009, Community Development Employment Projects (CDEP) participants were classified as employed. ABS products have not considered participants in CDEP’s replacement scheme, the Community Development Program, to be employed. This has contributed to an overstatement of Indigenous employment prior to July 2009.
The situation is the opposite for non-Indigenous people living in very remote areas in the NT, which ranks best for unemployment and participation rate in the 2016 and 2011 censuses (they are equal best for unemployment rate in 2011). The unemployment rate in very remote NT for non-Indigenous people is 34.4% lower than the average of the other states. The participation rate is 15.6% higher.
Table 10: non-Indigenous unemployment and participation in very remote areas – 2011 & 2016 censuses
Source: ABS (2017), ‘2016 Census of Population and Housing, Aboriginal and Torres Strait Islander Peoples Profile’, ABS cat. no. 2002.0, Canberra; ABS (2012), 2011 Census of Population and Housing, Aboriginal and Torres Strait Islander Peoples (Indigenous) Profile’, ABS cat. no. 2002.0, Canberra.
Employment gaps
Based on the below data, the ranking of the states for employment and employment in the private sector for Indigenous people in remote and very remote locations is:
1) South Australia and Western Australia
3) Queensland
4) New South Wales
5) The Northern Territory
Remote
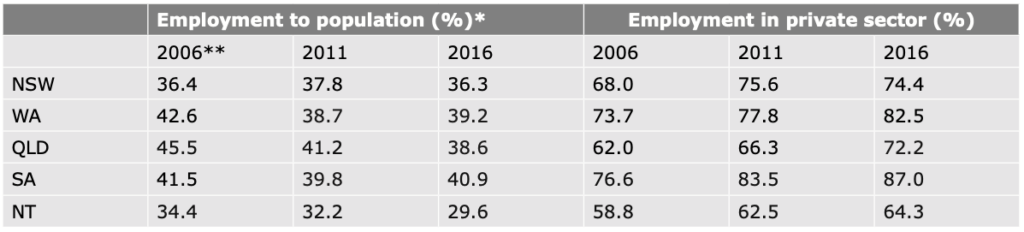
Indigenous people in remote NT rank last in Australia for rate of employment and employment in the private sector in 2016, and going back to the 2011 and 2006 censuses. The Indigenous employment rate in the NT was 23.7% lower than the average of the other states. And employment in the private sector was 18.7% lower.
Table 11: Indigenous employment in remote areas – 2006, 2011, 2016 censuses
Source: ABS (2017), ‘2016 Census of Population and Housing, Aboriginal and Torres Strait Islander Peoples Profile’, ABS cat. no. 2002.0, Canberra; ABS (2012), 2011 Census of Population and Housing, Aboriginal and Torres Strait Islander Peoples (Indigenous) Profile’, ABS cat. no. 2002.0, Canberra; ABS (2007), ‘2006 Census Community Profile Series, Indigenous Profile, ABS cat. no. 2002.0, Canberra.
*For 2011 and 2016 the ABS provided a figure for the Indigenous unemployment rate, participation rate, and employment to population in remote areas. These were not provided for 2006 and were calculated manually for this research using ABS data.
**In ABS surveys and Censuses conducted before July 2009, Community Development Employment Projects (CDEP) participants were classified as employed. ABS products have not considered participants in CDEP’s replacement scheme, the Community Development Program, to be employed. This is has contributed to an overstatement of Indigenous employment prior to July 2009.
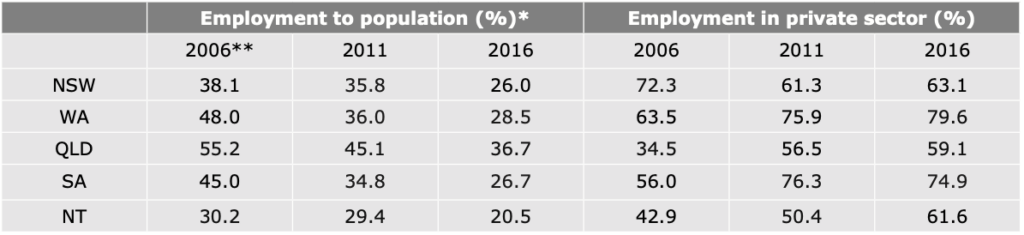
The results are different for non-Indigenous Australians in remote NT. The NT came first for employment rate in 2011 and 2016. However, non-Indigenous Territorians in remote areas came last for employment in the private sector. This adds weight to the idea that one source of the disparity in economic outcomes for Indigenous and non-Indigenous Territorians living in remote and very remote areas is the possibility that many non-Indigenous workers are service providers earning government salaries. The employment rate for non-Indigenous people in remote NT is 19.5% higher than the average of the other states. The percentage of people employed in the private sector is 21.1% lower than the average of the other states.
Table 12: non-Indigenous employment in remote areas – 2011 & 2016 censuses

Source: ABS (2017), ‘2016 Census of Population and Housing, Aboriginal and Torres Strait Islander Peoples Profile’, ABS cat. no. 2002.0, Canberra; ABS (2012), 2011 Census of Population and Housing, Aboriginal and Torres Strait Islander Peoples (Indigenous) Profile’, ABS cat. no. 2002.0, Canberra.
Very remote
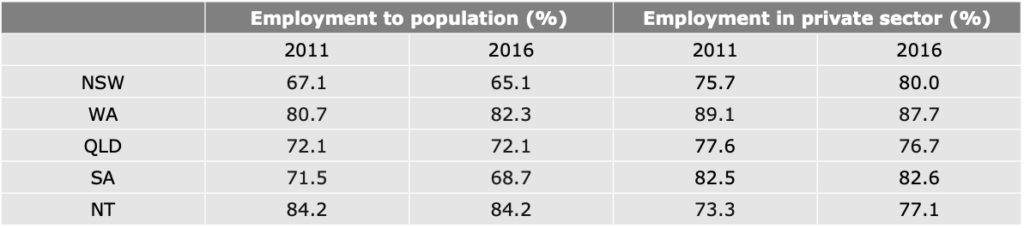
The NT ranks last for the Indigenous employment rate in very remote areas in 2016, and also going back to the 2011 and 2006 censuses. However, it only ranks last in employment in the private sector in 2011. For 2016, it is 30.5% lower than the average of the other states for the employment rate. This is a wider gap than remote areas. For Indigenous employment in the private sector in 2016 in very remote areas, the NT is 7.6% lower than the average of the other states.
Table 13: Indigenous employment in very remote areas – 2006, 2011, 2016 censuses
Source: ABS (2017), ‘2016 Census of Population and Housing, Aboriginal and Torres Strait Islander Peoples Profile’, ABS cat. no. 2002.0, Canberra; ABS (2012), 2011 Census of Population and Housing, Aboriginal and Torres Strait Islander Peoples (Indigenous) Profile’, ABS cat. no. 2002.0, Canberra; ABS (2007), ‘2006 Census Community Profile Series, Indigenous Profile, ABS cat. no. 2002.0, Canberra.
*For 2011 and 2016 the ABS provided a figure for the Indigenous unemployment rate, participation rate, and employment to population in remote areas. These were not provided for 2006 and were calculated manually for this research using ABS data.
**In ABS surveys and Censuses conducted before July 2009, Community Development Employment Projects (CDEP) participants were classified as employed. ABS products have not considered participants in CDEP’s replacement scheme, the Community Development Program, to be employed. This is has contributed to an overstatement of Indigenous employment prior to July 2009.
In the very remote non-Indigenous category, the NT had the highest employment rate in both the 2016 and 2011 censuses. The NT employment rate was 17.3% higher than the average of the other states. The NT had the second lowest rate of employment in the private sector in 2016 and the lowest in 2011 for non-Indigenous people living in very remote areas. In 2016, private sector employment was 5.7% lower than the average of the other states.
Table 14: non-Indigenous employment in very remote areas – 2011 & 2016 censuses
Source: ABS (2017), ‘2016 Census of Population and Housing, Aboriginal and Torres Strait Islander Peoples Profile’, ABS cat. no. 2002.0, Canberra; ABS (2012), 2011 Census of Population and Housing, Aboriginal and Torres Strait Islander Peoples (Indigenous) Profile’, ABS cat. no. 2002.0, Canberra.
Housing gaps
Based on the below data, the ranking of the states for home ownership for Indigenous people in remote and very remote locations is:
1) New South Wales
2) South Australia
3) Queensland
4) Western Australia and the Northern Territory
Remote
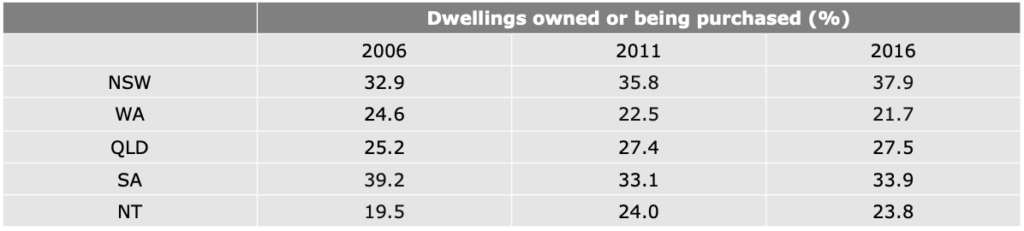
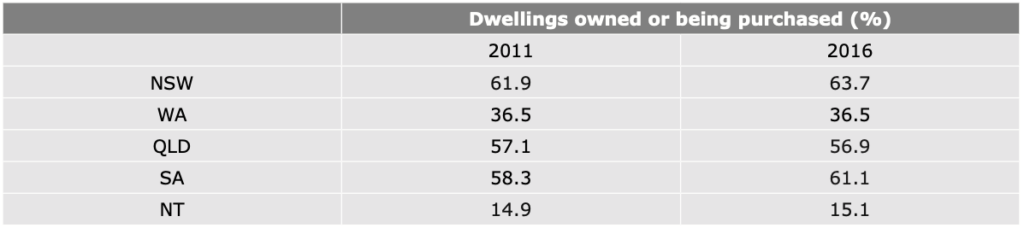
For dwellings owned or being purchased by Indigenous people in remote areas, the NT came second last in 2016 and 2011, and last in 2006. In 2016, the percentage of dwellings owned or being purchased by Indigenous people in remote NT was 6.4% lower than the average of the other states.
Table 15: Indigenous housing in remote areas – 2006, 2011, 2016 censuses
Source: ABS (2017), ‘2016 Census of Population and Housing, Aboriginal and Torres Strait Islander Peoples Profile’, ABS cat. no. 2002.0, Canberra; ABS (2012), 2011 Census of Population and Housing, Aboriginal and Torres Strait Islander Peoples (Indigenous) Profile’, ABS cat. no. 2002.0, Canberra; ABS (2007), ‘2006 Census Community Profile Series, Indigenous Profile, ABS cat. no. 2002.0, Canberra.
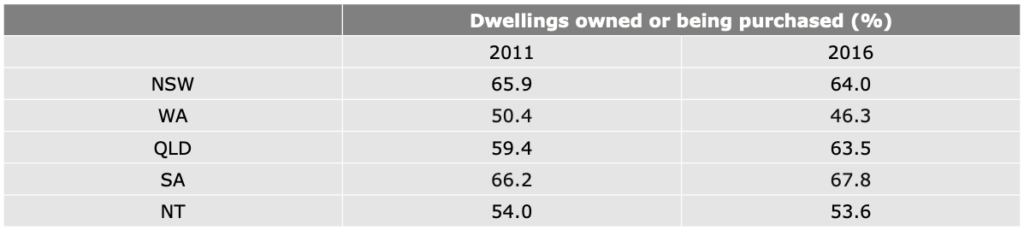
The NT ranked second last for non-Indigenous private home ownership in remote areas in 2011 and 2016. In 2016 non-Indigenous private home ownership in remote NT was 11.3% below the average of the other states.
Table 16: non-Indigenous housing in remote areas – 2011 & 2016 censuses
Source: ABS (2017), ‘2016 Census of Population and Housing, Aboriginal and Torres Strait Islander
Peoples Profile’, ABS cat. no. 2002.0, Canberra; ABS (2012), 2011 Census of Population and Housing, Aboriginal and Torres Strait Islander Peoples (Indigenous) Profile’, ABS cat. no. 2002.0, Canberra.
Very remote
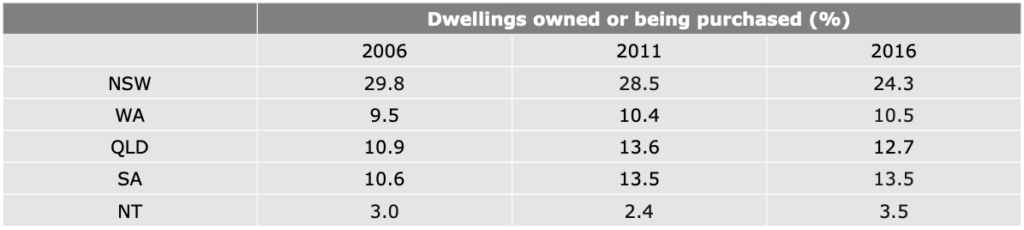
For dwellings owned or being purchased by Indigenous people in very remote areas, the NT came last in all three censuses analysed. In 2016, the percentage of dwellings owned or being purchased by Indigenous people in very remote NT was 77.3% lower than the average of the other states. A big factor in this outcome is likely the influence of ALRA which makes it almost impossible for Indigenous people living on ALRA land to own their own home. Large swathes of very remote NT are covered by ALRA.
Table 17: Indigenous housing in very remote areas – 2006, 2011, 2016 censuses
Source: ABS (2017), ‘2016 Census of Population and Housing, Aboriginal and Torres Strait Islander Peoples Profile’, ABS cat. no. 2002.0, Canberra; ABS (2012), 2011 Census of Population and Housing, Aboriginal and Torres Strait Islander Peoples (Indigenous) Profile’, ABS cat. no. 2002.0, Canberra; ABS (2007), ‘2006 Census Community Profile Series, Indigenous Profile, ABS cat. no. 2002.0, Canberra.
The NT ranked last for non-Indigenous private home ownership in very remote areas in 2011 and 2016. In 2016 non-Indigenous private home ownership in very remote NT was 54.6% below the average of the other states. This is likely also impacted by ALRA, which bans non-Indigenous ownership of ALRA land. This deprives Indigenous people on ALRA land of access to the non-Indigenous markets devaluing their assets and property rights.
Table 18: non-Indigenous housing in very remote areas – 2011 & 2016 censuses
Source: ABS (2017), ‘2016 Census of Population and Housing, Aboriginal and Torres Strait Islander Peoples Profile’, ABS cat. no. 2002.0, Canberra; ABS (2012), 2011 Census of Population and Housing, Aboriginal and Torres Strait Islander Peoples (Indigenous) Profile’, ABS cat. no. 2002.0, Canberra.
Overall Rankings
Based on the above data, the ranking of the states for economic outcomes for Indigenous people in remote and very remote locations is:
1) South Australia
2) Western Australia
3) Queensland
4) New South Wales
5) The Northern Territory
For non-Indigenous people in remote and very remote areas, the rankings are:
1) The Northern Territory
2) Western Australia
3) Queensland and South Australia
4) New South Wales
In 2016, the NT came last in nine of 12 categories across remote and very remote areas. In remote areas, the NT came last in four out of six categories: personal income, participation rate, employment to population rate, and employment in the private sector.
In very remote areas, the NT came last in five out of six categories: personal income, unemployment rate, participation rate, employment to population, and the percentage of dwellings owned or being purchased.
Furthermore, these rankings have remained relatively consistent over the course of the previous two censuses (2006 and 2011). The NT came last 28 out of 36 times across the remote and very remote categories for the 2006, 2011 and 2016 censuses.
Significantly, while the NT has the worst economic outcomes for Indigenous people in remote and very remote areas of any state or territory in Australia, it has the best outcomes for non-Indigenous Australians. The NT comes first in four of the six categories for non-Indigenous Australians in remote areas: median personal income, unemployment, participation rate and employment to population. For three of those (median personal income, participation rate, and employment to population) Indigenous people in remote NT came last in the county. It should also be noted non-Indigenous people in remote NT came last in employment in the private sector.
Non-Indigenous Australians in very remote NT come first in three out of the six categories in very remote areas: unemployment rate, participation rate, and employment to population. Indigenous Australians in very remote NT come last in the country in all three of those categories. It should also be noted non-Indigenous people in very remote NT came last in employment and in dwellings owned or being purchased.
Furthermore, these rankings have remained relatively consistent going back to the 2011 census.[22] Non-Indigenous people in the NT came first 14 out of 24 times across the remote and very remote categories for the 2011 and 2016 censuses.
While the NT is last for Indigenous economic outcomes in remote and very remote areas, it’s first for non-Indigenous economic outcomes. Western Australia and Queensland rank the same for both Indigenous and non-Indigenous outcomes and New South Wales does poorly in both, coming second last and last respectively. The other state with a large divergence is South Australia, which comes first for Indigenous economic outcomes in remote and very remote locations and second last for non-Indigenous economic outcomes.
The size of the Territory Gap
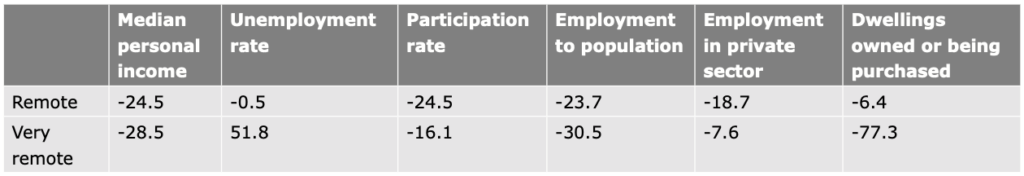
What is arguably most significant about the gap is the extent to which the Northern Territory is behind. The 2016 median personal income of Indigenous people in the remote NT is 24.5% lower than the average median income of Indigenous people in remote areas in the four other states examined in this analysis. In very remote areas it’s 28.5% lower. These are significant disparities. By way of comparison, the latter is more than double the so-called ‘gender pay gap’ of 13.8% to which a significant portion of our political culture including entire government agencies is dedicated to eradicating.[23] These — often frankly enormous — differences are present across all six indicators (see Table 19).
The only indicator in which the NT compares favourably with the other states is the remote unemployment rate, which was 0.5% lower than the average (although this is impacted by the lower participation rate in the NT). It performs significantly worse than the average of the other states in every indicator in very remote areas.
Table 19: Percentage difference between Indigenous people living in remote and very remote NT and Indigenous people living in remote and very remote NSW, WA, QLD & SA (average*) – 2016 census
Source: ABS (2017), ‘2016 Census of Population and Housing, Aboriginal and Torres Strait Islander Peoples Profile’, ABS cat. no. 2002.0, Canberra.
*Averages for NSW, WA, QLD & SA are not weighted for population.
The sheer size of the disparity indicates that a third ‘gap’ should become a focus of Indigenous policy in Australia — the Territory Gap. This should be considered alongside the other gaps in Indigenous policy: the general gap between Indigenous and non-Indigenous people and the remoteness gap between Indigenous people in remote and very remote communities and Australians (Indigenous or otherwise) living everywhere else.
What has caused the Territory Gap?
It may be argued the presence of causal factors unique to the NT, compared to the other states examined in this analysis, are driving the Territory Gap. These might include low population, low population density, lack of economic opportunity, inhospitable climate, lack of government expenditure or distance from government services. While many of these factors are present to varying degrees in the other jurisdictions, it may be that they exert a more profound influence in the NT. Indeed, the NT has come last in the last four ‘State of the States’ report (2019-2022) — an annual state and territory economic performance report released by CommSec. However, the data in this report is mostly from the 2016 census, when the NT ranked 4th out of 8 in the State of the States report.
In this explanation, the comparable economic success of non-Indigenous Territorians in remote and very remote areas may be attributed to the high number of service providers earning government salaries. Indeed, as outlined above, the percentage of non-Indigenous workers in the public sector in remote areas is much higher in the NT than any other state considered in this research. In very remote areas the percentage of non-Indigenous workers in the public sector is second highest of the jurisdictions examined in this research (see Table 14).
On the other hand, the positive economic outcomes for non-Indigenous people living in remote and very remote NT compared to non-Indigenous people living in remote areas in other states and territories may be interpreted as demonstrating that there is nothing structurally amiss with economic life in the NT. This could be interpreted as proof that the unique features of the institutional arrangements for Indigenous people in the NT are the sole cause of the Territory Gap.
Either way, whether institutional arrangements for Indigenous people in remote and very remote NT are the sole or partial cause of the Territory Gap, it’s likely that — at least to some extent — they are holding back Indigenous economic development. In particular, the extensive land rights regime, and the powerful Land Councils that impact on Indigenous life in the NT have become a barrier to fixing the problems. They are also likely easier to fix than more intractable issues like population and remoteness.
Population
It might be argued that the significant population difference between the Northern Territory and the other states in this analysis contributes to the Territory Gap. For example, the population of New South Wales is more than 33 times larger than the population of the NT. And while the population density of remote and very remote areas in the different jurisdictions is comparable, it’s possible there’s an economic benefit to being ‘remote’ or ‘very remote’ from a populous economic powerhouse like Sydney, Brisbane or Perth, compared to being ‘remote’ or ‘very remote’ from Darwin or Alice Springs. However, if this had a significant impact on the disparity between Indigenous people in the different jurisdictions, it would be expected to be borne out in the non-Indigenous data as well. As outlined above, non-Indigenous people do economically better in remote and very remote NT than any of the other jurisdictions examined in this research. However, this may be due to the high number of non-Indigenous public sector workers in remote and very remote NT.
Government expenditure
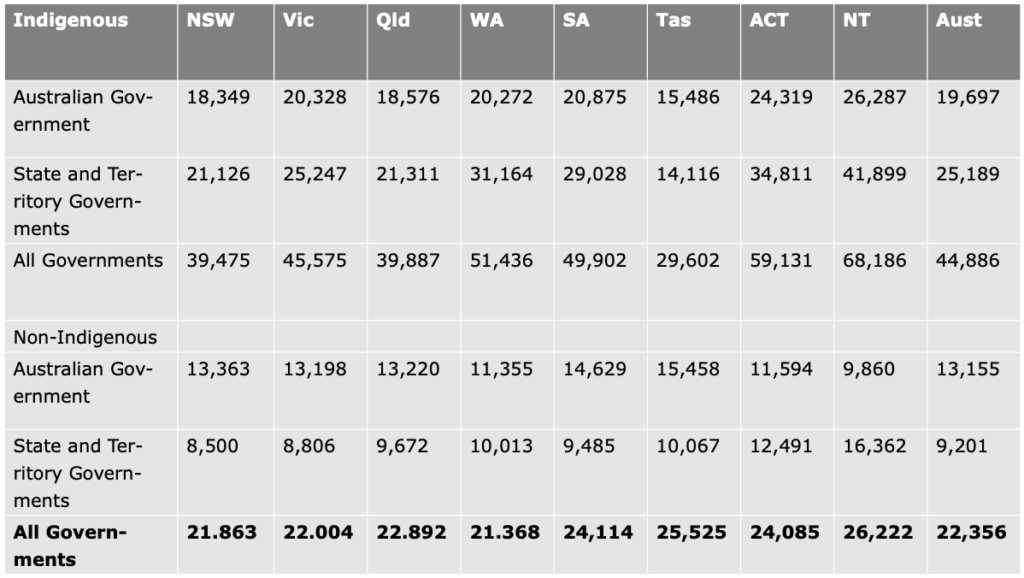
It is unlikely that Indigenous economic disadvantage in the NT is caused by a lack of government expenditure. As Table 11 indicates, Indigenous people in the NT receive more expenditure per person than other states and territories in Australia — $68,186 per Indigenous person per year in the NT, compared to $44,886 per Indigenous person per year for the whole of Australia.[24] This is largely driven by the higher rates of Indigenous poverty in the NT and the large number of Indigenous people living in remote and very remote areas (making service provision more expensive).
Table 20: Government direct expenditure on Indigenous and non-Indigenous Australians ($ per person), 2015-16
Source: Steering Committee for the Review of Government Service Provision (2017), ‘2017 Indigenous Expenditure Report’, Productivity Commission, Canberra.
These figures compare states and territories, not the remote and very remote areas of different states and territories. In 2011, researchers Helen and Mark Hughes estimated $100,000 was spent by the government per year for each Indigenous Australian living in a remote location.[25] Despite receiving higher levels of government expenditure than anywhere else in Australia, Indigenous people in remote and very remote NT live in the worst conditions. If recent and current government expenditure is insufficient, it’s hard to imagine what level of expenditure would be adequate.
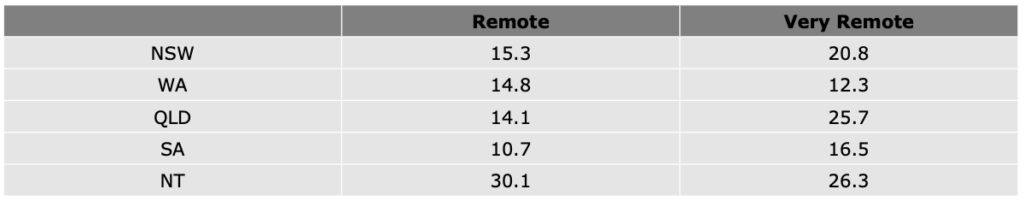
Indeed, a large public sector may be a causal factor of deprivation in the NT, given the correlation globally and historically of free enterprise with economic prosperity. In the NT, the percentage of workers (both Indigenous and non-Indigenous) in the public sector is more than double the average of the other four states (see Table 21). In very remote areas, the NT has the largest per capita public sector workforce of the states examined in this analysis, however, the difference isn’t as profound as in remote areas. That said, it is still 39.7% higher than the average of the other states.
Table 21: public sector workers (%) – 2016 census
Source: ABS (2017), ‘2016 Census of Population and Housing, Aboriginal and Torres Strait Islander
Peoples Profile’, ABS cat. no. 2002.0, Canberra.
A large unwieldly public sector in remote and very remote NT may enervate and crowd out dynamism and entrepreneurship; exacerbating Indigenous deprivation and bolstering non-Indigenous income and employment outcomes.
Distance from services
The ABS classifies remoteness by relative access to services. This means people in very remote areas in Australia have the worst access to services by definition. This is likely not the cause of the disparity between the Northern Territory and other areas covered in this analysis, given remote and very remote areas are being compared with other remote and very remote areas.
However, as above, it’s possible there’s a benefit from a services perspective to being ‘remote’ or ‘very remote’ from Sydney or Brisbane, compared to being ‘remote’ or ‘very remote’ from Darwin or Alice Springs. But it does beg the question of why such large numbers of the most vulnerable group in Australian society have been encouraged to take up residence in incredibly inhospitable conditions as far away as possible from services and — in some cases — economic opportunity. This has occurred because of one of the chief ideological preoccupations that has underpinned Indigenous policy for at least half a century. That is, the anthropological notion that Indigenous wellbeing will be achieved by protecting Indigenous people from the broader Australian culture and economy and allowing them to revert to the traditional hunter-gatherer lifestyle in remote locations.[26]
While it’s true that Indigenous people living in remote areas are more likely to be satisfied with their knowledge of their own culture than their non-remote counterparts,[27] they lag tragically behind on economic and social indicators. There is nothing culturally authentic about living in destitution. We have spent half a century, and untold human suffering, on the attempt to recreate an imagined Indigenous golden age in remote and very remote Australia. It is time for Indigenous leaders to pursue innovative hybrid models that enable individuals to divide their time between remote and non-remote areas for genuine work and study opportunities — allowing them to flourish in modern Australia while still maintaining ties to their culture and ancestral homelands. Indeed, this has already occurred with some success in some places.
Nonetheless, while distance from services and economic opportunity may be contributing to Indigenous deprivation in remote locations in the NT and elsewhere, it has not affected non-Indigenous people there to the same extent. It should still be possible for Indigenous people in remote and very remote locations to thrive as non-Indigenous people do. Likewise, it doesn’t explain the especially pronounced dysfunction taking place in the NT.
Inclusive vs extractive institutions
A large part of the deprivation of Indigenous people in remote and very remote locations in the NT is caused by extractive institutions. Institutions are the political, legal, economic, and cultural formal and informal mechanisms that govern and direct human activity. The more inclusive they are, the more prosperous and stable a society is in the long term. The more extractive they are, the less prosperous and stable society is.[28]
Extractive political and economic institutions concentrate political decision making within a narrow elite and deprive broad sections of the community of the fruits of their economic effort meaning only the elites derive benefit from economic activity. Due to there being little or no benefit for most people in pursuing economic outcomes, innovation, dynamism, and productivity is stifled.
Remote and very remote Indigenous communities in Australia have more extractive institutions, while remote and very remote Indigenous communities in the NT have the most extractive institutions of all. [29] For this to change, the extractive institutional framework currently constraining Indigenous communities must be reformed or removed — and a set of authentic, culturally appropriate and inclusive political and economic institutions needs to emerge organically from those communities.
The Aboriginal Land Rights (Northern Territory) Act 1976
A total of 50% of the NT has been returned to Traditional Owners under the Aboriginal Land Rights (Northern Territory) Act 1976 (ALRA). Unfortunately ALRA gives economic decision-making powers to Land Councils rather than Traditional Owners. Land Councils will only grant leases and licenses if Traditional Owners understand and consent to the proposal, the affected community (including non-Traditional Owner community members) has been consulted, and the Land Council considers the terms of the agreement to be “reasonable”.
These requirements are restrictive and prohibitive in practice. The Aboriginal Investment Group reported in 2020 on the barriers faced by a Traditional Owners Aboriginal Corporation seeking to create a youth drop-in café on their own land. Under the current system, these Traditional Owners required a lease under Section 19 of ALRA and would have to be consulted by the Land Council before the lease would be issued. Furthermore, the lease would have to include rental or land use payments. And the Traditional Owners would have to pay the costs of the Land Council consultation (including staff time and travel) with the whole process taking six months.[30]
Indigenous communities have often been criticised for lacking a culture of work and enterprise. Yet to undertake a small community project, these Traditional Owners had to present a proposal to themselves, from themselves. They were then to be consulted on their own proposal by the Land Council, whose costs they were paying. To get the lease approved, they would have to charge themselves commercial rates of rent. And the whole process would take half a year. It’s difficult to imagine a process more averse to enabling a robust culture of work and enterprise to re-emerge in Indigenous communities in the NT.
By way of comparison, some townships on ALRA land in the NT have gained the right to issue leases within their townships without having to seek the approval of a Land Council through the advent of Township Leasing. These townships accrue almost eight times as much rental income as communities overseen by the Central Land Council despite having only about a quarter as many people.[31]
Furthermore, ALRA land is inalienable and can’t be sold. This has restricted the ability of Indigenous communities to buy and sell land, including residential land, and leverage their land holdings for business creation. It’s noteworthy that NSW introduced freehold title to the Aboriginal Land Rights Act 1983 in 1990. This allows Local Aboriginal Land Councils to sell or otherwise dispose of land. This is unique for ALRA land in Australia and, according to the NSW Department of Aboriginal Affairs, allows for “greater economic opportunities from land holdings, and freedom for Aboriginal people to determine their community aspirations.”[32]
While there is land rights legislation in most states and territories, ALRA in the NT is more onerous, covers more area and houses more people than elsewhere.
The Land Councils
Land Councils stymie economic activity in the NT through their statutory obligations (as outlined in the previous section), and through operational shortcomings.
Given the size of the Land Councils, it’s hardly a surprise that getting economic decisions made is difficult. Land Councils are vast bureaucratic bodies. The Central Land Council (CLC) is made up of 90 council members representing 24,000 people, living across 777,000 kms², who speak more than 15 different languages. The Northern Land Council (NLC), the other major Land Council in the NT, has 83 members that meet twice a year.
Reviews by Deloitte and the Australian National Audit Office over the last decade have found the Northern Land Council suffered from poor governance[33] and a lack of transparency and accountability,[34] don’t appear to represent the interests of their constituents effectively,[35] and have inadequate financial reporting mechanisms.[36]
Perhaps most emblematic of these ramshackle financial arrangements was the payment of meeting fees in cash up until November 2016; leading to the extraordinary situation of staff transporting upwards of $90,000 cash to meeting venues around Northern Australia.[37]
Furthermore, Land Councils aren’t subject to Freedom of Information requests unlike most government agencies. This leads them to operate like a “secret society” according to Chairman of Rirratjingu Aboriginal Corporation in Arnhem Land, Bakamumu Marika. [38]
Along with the enormous gap in rental incomes between those ALRA townships able to issue leases themselves, and those having to go through the Land Councils, Native Title also appears to operate less effectively in the NT. Native title holders, the government and companies are able to negotiate future developments on native title land through Indigenous Land Use Agreements (ILUAs). In the NT they are facilitated and certified by the relevant Land Council. It’s telling that ILUAs cover 58.9% of South Australia, 50.7% of Queensland, 36.9% of Western Australia, but only 13.4% of the NT.[39][40]
In late 2021, Section 28A of ALRA was repealed by the federal Coalition. Section 28A allowed for the delegation of certain Land Council powers to Traditional Owners. These included mining exploration and permissions, and the issuing of leases and licenses on their land and essentially allowed Traditional Owners to bypass the Land Councils on certain matters. In light of the problems with Land Councils outlined in this section, the decision to remove this right is exceedingly regrettable.
Conclusion
There are two well known ‘gaps’ in Indigenous policy in Australia. Firstly, the gap in economic and social outcomes between Indigenous and non-Indigenous Australians. And secondly, the gap between Indigenous people living in remote and very remote Australia and Australians (Indigenous or otherwise) living in the rest of Australia. This report proposes that there’s a third gap that warrants attention — the Territory Gap. This refers to the disparity between Indigenous Australians in remote and very remote NT and Indigenous Australians in remote and very remote locations elsewhere in Australia.
Indeed, it may even be more accurate to consider the disparity between Indigenous and non-Indigenous Australians in the following way:
- The gap between Indigenous Australians living in cities and towns and their non-indigenous neighbours (this gap is shrinking).
- The gap between Indigenous Australians living in cities and towns and Indigenous people living in remote and very remote Australia (this gap is growing).
- The Territory Gap (the gap identified in this report).
In 2016, remote and very remote NT came last in nine out of the 12 categories examined in this report. It performs significantly worse than the average of the other states in 11 out of 12 categories. In some instances the disparities are enormous. The 2016 median personal income of Indigenous people in remote NT is 24.5% lower than the average median income of Indigenous people in remote areas in the four other states examined in this analysis. In very remote areas it’s 28.5% lower. By way of comparison, the latter is more than double the so-called ‘gender pay gap’ of 13.8% to which a significant segment of our political culture including entire government agencies is dedicated to eradicating.
Incredibly, while the NT has the worst economic outcomes for Indigenous people in remote and very remote areas of any state or territory in Australia, it has the best outcomes for non-Indigenous Australians. The NT comes first in four of the six categories in remote areas and three of the six categories in very remote areas.
This paper argues that extractive institutions are contributing to the Territory Gap. Specifically, the Aboriginal Land Rights (Northern Territory) Act 1976 (ALRA) and the powerful regional Land Councils both in terms of their statutory functions under ALRA and their operational performance.
The long-term solution to Indigenous deprivation in remote and very remote Northern Territory is the re-emergence of a set of authentic, robust and inclusive political and economic institutions organically from those communities. For that to occur, the extractive institutions currently in place must be removed or reformed. The Territory Gap must become a focus for leaders and policy-makers.
Indeed, it’s worth noting that the jurisdiction with the most extractive institutional framework for Indigenous affairs in Australia appears to have created the worst outcomes for Indigenous people, and the highest levels of racial inequality.
Endnotes
[1] This publication utilises the designations of ‘remote’ and ‘very remote’ developed by the Australian Bureau of Statistics (ABS). The ABS divides Australia into 5 classes of remoteness based on the relative access to services. The five classes are: major cities, inner regional, outer regional, remote and very remote. More detail on the ABS remoteness structure can be accessed here: https://www.abs.gov.au/websitedbs/D3310114.nsf/home/remoteness+structure
[2] In the 2016 Census of Population and Housing (the most recent Australian census publicly available at the time of writing), an estimated 798,400 Australians identified as Indigenous. But using estimated resident population projections based on the 2016 census, the Australian Institute of Health and Welfare (AIHW) estimated there would be 864,200 Indigenous Australians by 2020 and that 153,700 lived in remote and very remote areas. ABS (2019). ‘Estimates and projections, Aboriginal and Torres Strait Islander Australians, 2006 to 2031’, ABS cat. no. 3238.0. Canberra.
[3] ABS (2018), ‘Estimates of Aboriginal and Torres Strait Islander Australians, June 2016’, ABS cat. no. 3238.0.55.001, Canberra.
[4] Overall rankings were devised by ranking each state or territory 1-5 for each indicator in both remote and very remote areas. These indicator rankings were then added together to formulate an overall score for each state or territory with a lower score indicating better performance/higher rank.
[5] For a detailed historical account of how institutions came to be extractive for many Indigenous people, particularly in the Northern Territory, see Gregory, P. (2021), ‘Township Leasing and the Democratisation of Opportunity’, The Centre for Independent Studies, AP 30, pp. 2-6.
[6] The 2016 Census of Population and Housing is the most recent Australian census containing disaggregated data on Indigenous people by remoteness across the different states and territories at the time of writing. It will be referred to as the ‘2016 census’ throughout this paper. The ABS has announced that remoteness data from the 2021 census will be available in early-mid 2023. The 2021 census product release guide can be accessed here: https://www.abs.gov.au/census/2021-census-data-release-plans/2021-census-product-release-guide
[7] ABS (2019). ‘Estimates and projections, Aboriginal and Torres Strait Islander Australians, 2006 to 2031’, ABS cat. no. 3238.0. Canberra.
[8] ABS (2018), ‘Estimates of Aboriginal and Torres Strait Islander Australians, June 2016’.
[9] ABS, ‘Estimates and Projections, Aboriginal and Torres Strait Islander Australians 2006 – 2031’,
[10] Productivity Commission, ‘Closing the Gap: Annual Data Compilation Report July 2022’, Canberra, p. 12.
[11] ABS (2018), ‘Estimates of Aboriginal and Torres Strait Islander Australians, June 2016’, ABS cat. no. 3238.0.55.001, Canberra.
[12] AIHW (2020), ‘Profile of Indigenous Australians’, accessed 15/6/22 <https://www.aihw.gov.au/reports/australias-health/profile-of-indigenous-australians>. The AIHW analysis didn’t include percentages. Percentages have been calculated by combining the AIHW population figure with the raw ABS data.
[13] Markham, F. & Biddle, N. (2018), ‘Income, poverty and inequality’, 2016 Census Paper 2, Centre for Aboriginal Economic Policy Research, Australian National University, Canberra, p 12.
[14] AIHW (2021), ‘Indigenous income and finance’, accessed 15/6/21 <https://www.aihw.gov.au/reports/australias-welfare/indigenous-income-and-finance>.
[15] Australian Institute of Health and Welfare (2021), ‘Indigenous employment’, accessed 13/6/21 <https://www.aihw.gov.au/reports/australias-welfare/indigenous-employment>.
[16] Productivity Commission, ‘Closing the Gap Targets and Outcomes’, accessed 3/8/22 <https://www.closingthegap.gov.au/national-agreement/targets>
[17] Price, J. N (2021), ‘Worlds Apart: Remote Indigenous disadvantage in the context of wider Australia’, The Centre for Independent Studies, PP 34, p 3.
[18] Davey, R. X. (2022), ‘Decoding the Gap: Australia’s ongoing struggle to address Indigenous health outcomes’, The Centre for Independent Studies, p 2.
[19] Productivity Commission, ‘Closing the Gap Targets and Outcomes’, accessed 3/8/22 <https://www.closingthegap.gov.au/national-agreement/targets>
[20] All the rankings in this section are devised by ranking each state or territory 1-5 for each indicator in question in both remote and very remote areas. These indicator rankings were then added together to formulate an overall score for each state or territory with a lower score indicating better performance/higher rank.
[21] The averages of the other states (NSW, WA, QLD, SA) throughout the paper are not weighted for population.
[22] The analysis for the non-Indigenous cohort doesn’t include 2006 because the unemployment rate, participation rate, employment to population and employment to private sector percentage was not collected for non-Indigenous people in remote and very remote areas as a discrete cohort in the 2006 census.
[23] Workplace Gender Equality Agency, ‘The Gender Pay Gap’, accessed 23/6/22,
<https://www.wgea.gov.au/the-gender-pay-gap>
[24] Steering Committee for the Review of Government Service Provision (2017), ‘2017 Indigenous Expenditure Report’, Productivity Commission, Canberra.
[25] Hughes, H. & Hughes, M. (2011), ‘Rivers of Money Flow into the Sand’, Quadrant, Volume LV, No. 6.
[26] Hughes, H. (2007), Lands of Shame: Aboriginal and Torres Strait Islander ‘Homelands’ in Transition, The Centre for Independent Studies, Sydney, p. 12.
[27] AIHW (2022), ‘Profile of Indigenous Australians’, accessed 13/7/22 <https://www.aihw.gov.au/reports/australias-health/profile-of-indigenous-australians>
[28] Acemoglu, D. & Robinson J. A. (2012), Why Nations Fail: The Origins of Power, Prosperity, and Poverty, Crown Business, New York.
[29] For a detailed historical account of how institutions came to be extractive for many Indigenous people, particularly in the Northern Territory, see Gregory, P. (2021), ‘Township Leasing and the Democratisation of Opportunity’, The Centre for Independent Studies, AP 30, pp. 2-6.
[30] Aboriginal Investment Group (2020), ‘Submission to the Joint Standing Committee on Northern Australia’, pp. 15-16.
[31] Gregory, P. (2021), ‘Township Leasing and the Democratisation of Opportunity’, p. 9.
[32] Aboriginal Affairs NSW, ‘Timelines of the NSW Aboriginal Land Rights Act 1983’, accessed 11/7/22 <https://www.aboriginalaffairs.nsw.gov.au/land-rights/the-aboriginal-land-rights-act-1983-alra/land-rights-history/>
[33] ibid, p. 35.
[34] ibid, p. 7.
[35] ibid, p. 24.
[36] ibid, p. 37.
[37] ibid, p. 34.
[38] Davidson, H. (2016) ‘FoI exemption: Aboriginal land councils can be ‘secret societies’, says Indigenous group’, The Guardian, 16/11/16, accessed 6/6/22 < https://www.theguardian. com/australia-news/2016/nov/16/foi-exemptionaboriginal-land-councils-can-be-secret-societiessays-indigenous-group>
[39] National Native Title Tribunal (2022), ‘Indigenous Land Use Agreements’, accessed 14/7/22 <http://www.nntt.gov.au/Maps/ILUAs_map.pdf>
[40] For a more detailed discussion of the extractive nature of Land Councils in the Northern Territory, see Gregory, P. (2021), ‘Township Leasing and the Democratisation of Opportunity’, p. 3-6.
Peter Gregory is a former Research Fellow at the Institute of Public Affairs. His areas of expertise are in development economics, entrepreneurship in developing countries, and free market solutions to poverty.
Peter’s articles have appeared in most major Australian newspapers including The Australian, Australian Financial Review, The Sydney Morning Herald, The Courier Mail and The Spectator. He has also had pieces published in major newspapers in South Africa, Cambodia, Uganda, and India. He has commented extensively on development economics and other issues on television and radio and as a former co-host of The Young IPA Podcast.
In 2014 he was a member of the Planning Group for the Y20 conference in Sydney – the youth counterpart of that year’s G20 conference. Peter has worked in the Latin America, Middle East and Asia Teams at World Vision Australia and in the Research and Development Team of the Small Enterprise Foundation – a microfinance institution in South Africa.
Peter has an Honours degree in Political Science from Monash University and is in the final stages of a PhD in development economics from RMIT.