Introduction
As the end of the Australian financial year approaches, thoughts often turn to taxation and how to minimise it (legally). While the focus is on income tax paid to the federal government, the reality is that individuals and businesses are constantly paying a wide range of taxes; not only to the federal government but also to state and local governments. On one count, there are at least 125 different taxes in Australia, although 10 of them account for 90% of the revenue.[i]
Any tally of how much we have paid in 2023-24 must include all these taxes, and not just those levied by one government. At the level of the individual, all taxes come out of the one income — whether they go to Canberra or to state governments. We don’t have a different income to finance our share of each type of tax.
When all taxes are brought into the picture, it can be surprising just how much tax we pay. Hence, the income tax cuts that come into effect on 1 July are put into a different perspective; in fact, they will be only about 3% of a year’s total taxation. For this reason, the focus of this report is on total taxation at all levels of government, and the shares of each level of government — federal, state and local — are of secondary importance.
Measure 1: Tax as share of GDP at market prices
By far the most commonly-cited measure of the overall tax burden is tax revenue as a percentage of GDP, and while it is never made explicit, this is GDP estimated at market prices. (The distinction between this and the ‘factor cost’ measure is important, as we shall see later.)The highest this measure has ever been in Australia — at least since the Second World War when taxes were very high to finance the war effort — was 30.3% in 2000-01, but it has fluctuated around an average of 28% since the 1990s; before which the average was lower, and much lower in the 1950s and 1960s. (See Figure 1.)
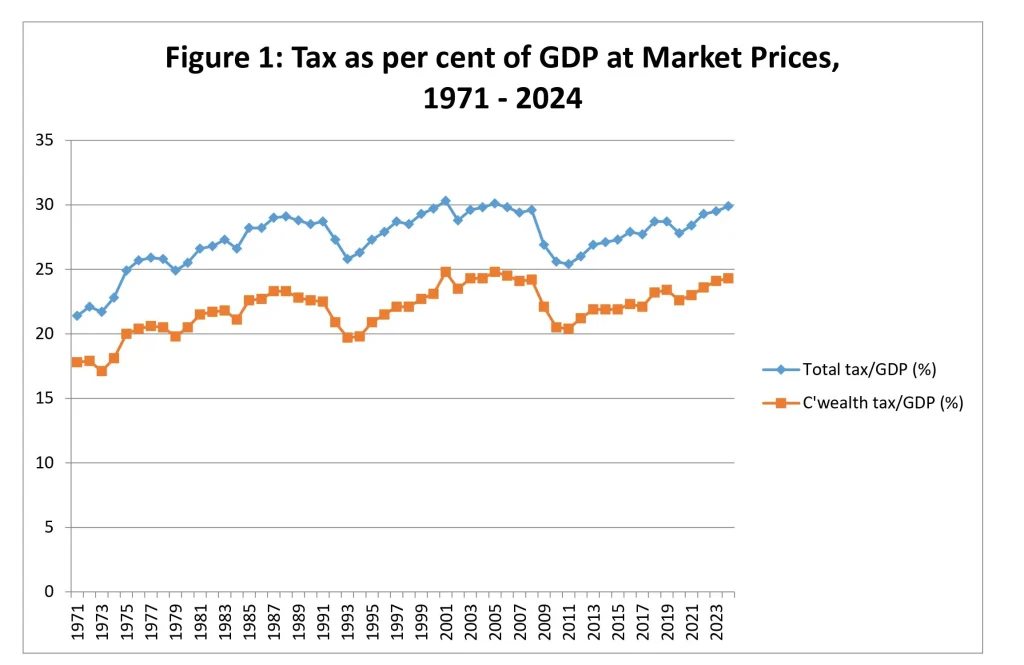
Significantly, this tax share has been rising in recent years (subject to some disruption during the Covid-19 pandemic) and, based on federal and state government mid-year budget reviews, it is likely to be close to 30% in 2023-24. It is fair to say this measure of the tax burden is close to the highest it has ever been in peacetime.
This tax share is the outcome of many variables and tax policy decisions by different governments and is not something any one government or the National Cabinet targets or can be held accountable for. But it is an important variable that National Cabinet should be concerned about and coordinate efforts to control.
The federal government alone does not have a fiscal rule for a particular tax/GDP ratio. The previous Coalition government set a ceiling of 23.9% of GDP (based on the average for a period of years in the past) but the newly elected Labor government abandoned this in 2022. This may be because, in practice, the ratio is impossible for any government to control with any precision. But the more likely reason is that the new government aspires to spend more freely and does not wish to be constrained by a tax ceiling.
It is somewhat ironic that the record of 30.3% occurred under the Coalition government in 2000-01 even though that government espoused the benefits of lighter taxation. The federal government was not responsible for the national tax total, but the federal component of the total was also at a record level of 24.9%, which was repeated in 2004-05. However, to be fair to the Howard government, it did implement major personal income tax cuts from that point onwards, which led to the federal tax/GDP ratio shrinking to a low of 20.4% in 2010-11.
The tax/GDP share is widely cited and is the most readily available measure for consistent international comparisons. However, in other respects it is not the best measure of the tax burden because GDP is not a tax base. We expand on this below.
Measure 2: Tax freedom day
The tax/GDP ratio has been popularised first in the US, and later in Australia (by the CIS) as tax freedom day, which expresses the ratio in calendar days as a measure of how far into the year the economy is working only to pay taxes.
When the tax/GDP ratio was at its peak in the 2000s decade tax freedom day was 22 April in calendar year terms or 20 October in Australian financial year terms. This means that if all the economy’s output went to paying tax until the year’s tax demands were satisfied, the economy would have worked entirely for government for the 111 days until 21 April and be free of tax from 22 April until the end of the year. (See Figure 2.)
Figure 2: Tax Freedom Day Since 1968-69
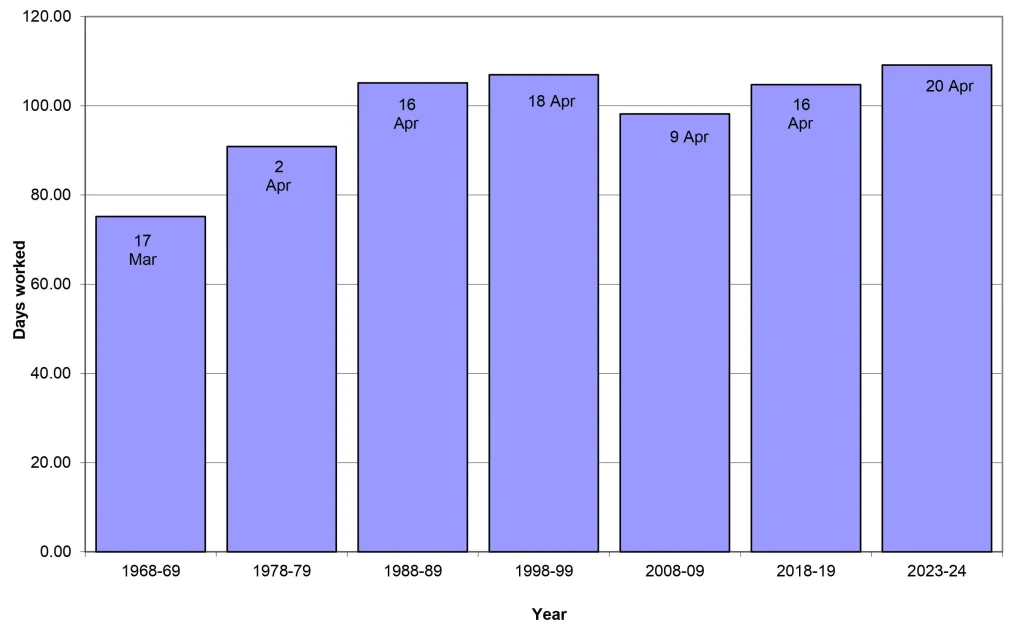
The estimate of tax freedom day this year is 20 April in calendar year terms, or 18 October in financial year terms. Although the day has been slightly later a few times in the past, until the 1990s it was generally much earlier in the year.
The concept of tax freedom day is useful in reformulating the tax/GDP ratio in a way that is understandable to more people and in facilitating comparisons with the past and with other countries but suffers the same defects as that ratio as a measure of the tax burden.
Measure 3: Tax as a share of GDP at factor cost
The problem with using GDP as a proxy tax base is that it includes taxation. There is an element of circularity in calculating taxation as a proportion of an aggregate that itself includes taxation, and calling this a measure of the tax burden. Government cannot tax itself.
As David Smith of the Institute of Economic Affairs has argued, the first step in removing this circularity is to use GDP at factor cost instead of GDP at market prices — which includes the effects of indirect taxes and subsidies on prices.[ii] GDP at factor cost is a broad measure of the income accruing to the factors of production, mainly labour and businesses.
In Australia, removing the net effect of indirect taxes and subsidies takes roughly 10% out of GDP at market prices. Therefore, the tax/GDP ratio this year, for example, will be around 33% when GDP is — more appropriately for this purpose — measured at factor cost rather than 30% when GDP is measured at market prices. Taxation is taking around one-third of income generated by the factors of production.
On this basis, tax freedom day would come about 10 days later and the economy would be working almost four months of the year just to finance government.
Measure 4: Tax on the private sector
The notion that the government cannot tax itself needs to be taken further than only removing indirect taxes net of subsidies from GDP. What is left is factor income, but this also includes government activity: namely the gross operating surplus of general government and public corporations. When these are deducted from factor income to obtain a better measure of private factor income, the tax/GDP ratio becomes 34% in 2023-24.
But there is another adjustment that arguably should be made. Private factor income includes a sizeable amount of gross operating surplus of dwellings owned by people. Although this is included to make the national accounts complete, it is in a sense ‘pretend’ income because it is based on a calculation of the rent homeowners would receive if they paid rent to themselves. It is not cash income that makes paying taxes easier.
If this hypothetical income is excluded, private factor income is reduced further, and tax becomes 37% in 2023-24.
Measure 5: Tax on households
If we want to focus on individual people as taxpayers, rather than entities such as companies and superannuation funds, then in national accounting terms we need to look at the household sector.
There are relatively few of our vast array of taxes for which individuals are directly accountable. Personal income tax, local government rates, motor vehicle taxes, stamp duty on property transactions and land tax are the main ones. Businesses are accountable for paying many other taxes. Yet tax theorists often assert that the ultimate burden of all taxation can be traced to individuals.[iii]
This apparent contradiction rests on the distinction between the legal and economic incidence of taxes. Taxes for which the business sector is legally responsible are in effect passed on to the household sector through higher prices and lower wages and shareholder returns.
The Goods and Services Tax (GST) is a good example of this: businesses are legally responsible for paying the GST and they collect the revenue by building it into the prices they charge consumers. Likewise, businesses collect excise duty in the petrol prices they charge consumers and send the money to the government.
These are obvious examples, but less obvious are taxes like payroll tax and company income tax. The legal incidence clearly falls on businesses but there is much research concluding that the economic incidence is passed on to the household sector in less obvious ways such as wages being lower, prices higher and shareholders’ dividends and capital gains being lower than they would be in the absence of such taxes.[iv]
Household income in the national accounts includes not only factor income but also various transfers from other sectors, including social benefit payments by government. Gross household income in 2023-24 will be around $2.1 trillion. However, this includes ‘pretend’ income such as that from owner-occupied dwellings. If we exclude this, then in the extreme case of the economic incidence of all taxes falling on households, the tax burden so defined would be 45%.
If we exclude company income tax, petroleum resource rent tax, payroll tax and land tax (most of which is paid by businesses) from tax incidence on households, then they bear a tax burden of about 35% of income.
As it is unlikely the economic incidence of all these taxes falls on businesses, or that all of it falls on households every year, the truth lies somewhere between 35% and 45%. In either case, it is a heavy burden and much heavier than most people would realise.
Measure 6: Per capita tax revenue
The Australian Bureau of Statistics has for many years published data on tax revenue per capita, but the latest available at this time are for 2021-22.[v] Total tax per capita in that period was $26,501, of which $21,365 was attributable to the federal government and $5,171 to state, territory and local government.
The CIS estimate for 2023-24 is considerably higher at $29,700, reflecting two more years’ growth. This means that for every adult and child in the resident population, our governments are collecting $29,700 in tax this year. To put this into perspective, Figure 3 expresses tax per capita in inflation-adjusted (real) terms at five-yearly intervals over 20 years.
Figure 3: Real Tax and GDP per capita Index 2003-4 = 100
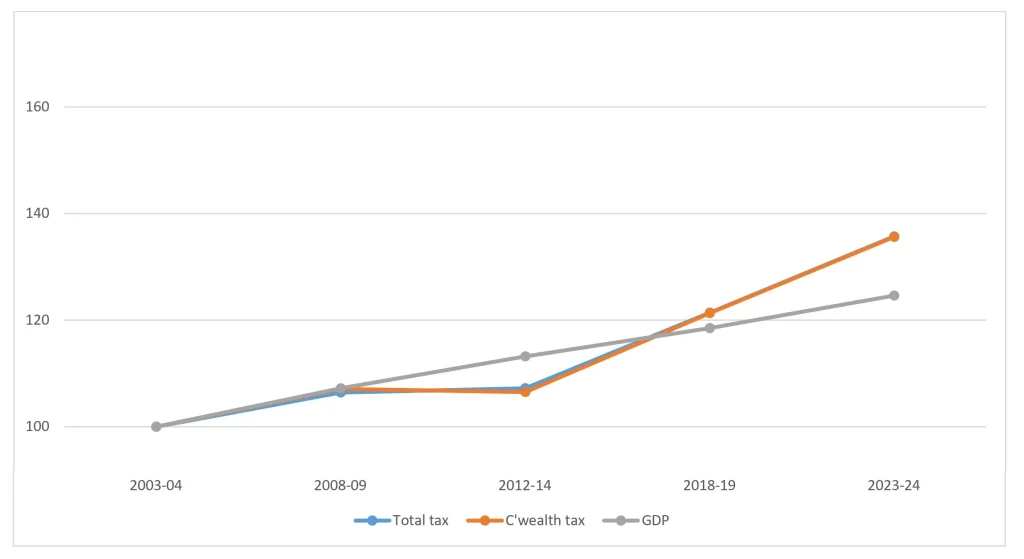
The compound average growth rate over those 20 years is 1.5% per year, but it has been more rapid over the past 10 years at 2.4%. By comparison, the growth of real GDP per capita (a measure of living standards) has slowed from 1.2% over 20 years to around 1.0% over the last 10 years. So while real income per capita has increased, the tax burden on it has increased at a faster rate, particularly over the last 10 years.
Federal budget papers in recent years have also provided information on real per capita taxation, but in this case it is real per-capita federal tax receipts, which have increased by 1.4% a year over 20 years and 2.2% a year over 10 years to 2023-24.[vi]
What measures 1 to 6 do not tell us
There is much more to the tax burden story and the total economic burden of government than these six measures reveal:
- Governments also rely on a sizable amount of non-tax revenue to finance their activities. Non-tax revenue has averaged around 6% of GDP over the past 10 years. This includes the mining royalty revenue collected by state governments.
- The measures are very broad and tell us nothing about the composition or distribution of the tax burden at different income and wealth levels or by state. Exploring these paths would take us to well-known issues such as the extent of reliance of our tax system on income taxes and whether the burden falls unduly on the most productive people in our economy; penalising self-improvement, success and hard work.
- International comparisons are another dimension. It is often claimed Australia is a ‘low tax’ country when comparisons are made with other advanced economies based on the tax/GDP ratio. However, detailed research reveals a more nuanced picture; such as that the international average thus calculated is heavily dependent on the very high taxing countries of Europe and that on some measures Australia’s tax burden is above average.[vii]
- The true economic burden of taxation is larger than any of the measures suggest because there is what is called in economics an ‘excess’ burden of taxation over and above each dollar collected. This arises because the responses of people and businesses to taxation reduce total economic well-being below what it would otherwise be. The actual excess burden depends on the composition of taxation, as the marginal excess burden varies for different types of tax. Estimates suggest that it is 10–20 cents per dollar of revenue raised for a broad-based consumption tax and as high as 70 cents per dollar for the most distorting taxes such as stamp duty on property transfers.[viii]
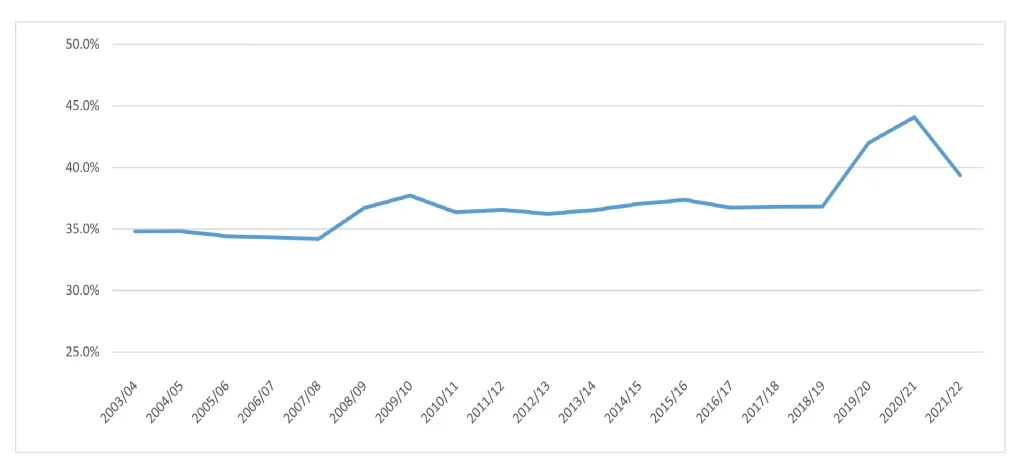
- Governments also finance their activities by running deficits and borrowing, which has additional economic impacts. Some economists would say that borrowing is just deferred taxation, so the true tax burden is not measured by tax revenue but by total government expenditure. Governments have borrowed heavily, particularly over the years since the Covid-19 pandemic began — although the federal government was in surplus last year and is likely to be again this year. Total government expenditure peaked at an exceptional 44% of GDP in 2020-21 and fell to 39.4% in 2021-22 as pandemic-related spending subsided[ix] (see Figure 4). It has fallen further since. The data are incomplete, but the total would still be above 35% of GDP.
Figure 4: General Government Expenditure as % of GDP 2023-4 to 2021-22
- The overall economic cost of government does not only derive from its spending and taxing activities. Regulation is another important dimension, the economic cost of which has been estimated to be more than 5% of GDP.[x]
- While this analysis has focused on the gross ‘burden’ or ‘cost’ of government, this is not to suggest that there are no offsetting benefits from government expenditure and regulation. The question, rather, is one of balance between burden and benefits, and the suggestion here is that government expenditure and intervention has become so large and pervasive that the marginal economic burden from financing it has become greater than the marginal benefit.
- Finally, there is the question of what can and should be done to lower the tax burden. This is a very large question that cannot be answered satisfactorily here. One thing that can be done to lower the excess economic burden is to change the composition of taxes from the most to the least economically damaging. However this in itself will not reduce the total tax take, which ultimately depends on the level of government spending. In fact, medium- to long-term projections of expenditure suggest there will be pressure to increase the tax burden further to record levels unless federal and state governments make a concerted effort to curb the growth of spending and improve its effectiveness. Regrettably at this juncture there is no sign of that happening.
Conclusion
A measure of the total tax burden is important to understanding the impact of government intervention on the economy. It is by no means the only information relevant to that assessment, but it is an important part of the overall story.
The various measures of the tax burden include tax revenue as a percentage of GDP at market prices and at factor cost, tax freedom day, revenue as a percentage of total private income in the economy, revenue as a percentage of household income, and revenue per capita.
These measures point to a growing tax burden in recent years and a level in 2023-24 likely to be about as high as it has ever been. Tax as a percentage of total private income in 2023-24 is about 34% and as a percentage of household income it is at least 35% and as high as 45% depending on assumptions made about tax incidence.
Medium to long term projections of government expenditure suggest there will be pressure to increase the tax burden further to record levels unless federal and state governments make a concerted effort to curb the growth of spending and make it more effective in achieving its objectives.
Endnotes
[i] Australia’s Future Tax System Review, Report to the Treasurer, Dec 2009, Part One: Overview, p 12.
[ii] David B. Smith, How should government spending and tax burdens be measured?, in Taxation, Government Spending and Economic Growth, edited by Philip Booth, Institute of Economic Affairs, London, 2016.
[iii] For example, Justin Fox, ’Who Pays Corporate Taxes? Possibly You‘, Harvard Business Review, August 26, 2014.
[iv] For example, Matthew Crowe, ’The Case for Payroll Tax’, Research and Information Paper TRP 99-3, NSW Office of Financial Management, Sydney, Sept 1999.
[v] Australian Bureau of Statistics (2021-22), Taxation Revenue, Australia, ABS website.
[vi] Commonwealth Budget 2023-24, Mid-year Economic and Fiscal Outlook, Appendix E. Results differ slightly from those in this report owing to different methodologies, the difference between total and Commonwealth taxation, and Treasury’s use of tax receipts (cash) rather than revenue (accrual).
[vii] Potter, M, ’The Case Against Tax Increases in Australia: The Growing Burden’, Research Report 15, Centre for Independent Studies, Sydney, June 2016.
[viii] Cao, L et al, ’Understanding the Economy-Wide Efficiency and Incidence of Major Australian Taxes’, Working Paper 2015-01, Australian Government Treasury, Canberra, April 2015.
[ix] Australian Bureau of Statistics (2021-22), Government Finance Statistics, Australia, Annual, ABS website.
[x] Douglas, J, ’Deregulation in Australia’, Economic Roundup, Issue 2, 2014, Australian Government Treasury.


“It will start big and get bigger and grow to become the new leviathan of...