
This Policy Paper reviews the evidence regarding wages growth in Australia since the 2008 financial crisis and discusses what it means for policy.
Introduction: wages growth in Australia
One of the big issues in the 2022 Australian federal election campaign was wages growth. The then Labor opposition, which won the election, pointed to low wages growth over the last decade, and the current negative real wages growth implied by higher inflation. So wages growth naturally became an issue considered in the new federal government’s Jobs and Skills Summit, out of which came a variety of new policy measures. For instance, the new government is pursuing a return to industry-wide bargaining, investing more in training, and returning Australia to a high level of immigration, among other things.
The government is arguing its policies will boost productivity and hence wages, recognising the strong long-run link between productivity and real wages.
This Policy Paper reviews the evidence regarding wages growth in Australia since the 2008 financial crisis and discusses what it means for policy. This includes the pros and cons of new policy measures such as a return to multi-employer bargaining and a boost to planned permanent immigration, which the current government is planning.
Wages growth has been low
In its Jobs and Skills Summit: Issues Paper, the Treasury observed: “Even before COVID-19, nominal wage growth had been weak and real wages had not risen significantly for around a decade.”1 What is the evidence for this?
There are various measures of average wages in Australia, including average weekly earnings, the wage price index (WPI), and average earnings from the National Accounts. All these data are produced by the Australian Bureau of Statistics (ABS). Average weekly earnings was once the preferred measure but it has since been superseded by the WPI, which is viewed as superior as it is an index of wages for a certain set of jobs, so it is not influenced by changes in the composition of employment. This could be both a virtue and vice in the debate over wages in Australia, as we shall see, but for now let us consider the data for WPI growth compared with CPI inflation (Figure 1). CPI inflation is much more volatile than WPI growth and this means real WPI growth is more volatile than WPI growth. Note the spike in CPI inflation in 2000 was associated with the implementation of the GST. The spike in CPI inflation in 2022, which was probably unexpected by many employers and employees in prior wage negotiation, has indeed seen real wages growth, as measured by WPI, turn negative.
Figure 1. WPI (excluding bonuses) and CPI, through-the-year percentage changes, Sep-98 to Sep-22
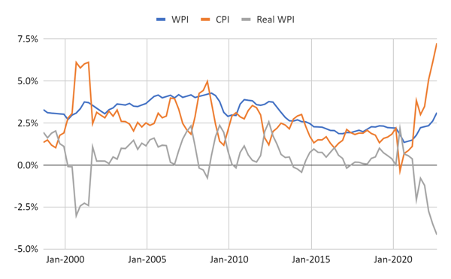
Source: ABS.
The year 2010 is identified by US economic historian Brad DeLong as the end of the long 20th century from 1870 to 2010.2 After that, in advanced economies, the recovery from the 2008 financial crisis was relatively weak compared to previous economic recoveries. This has had implications for productivity growth and real wages growth in other advanced economies, not just Australia, as I will discuss below. Taking 2010 as a breakpoint, average growth rates over the before-and-after periods are consistent with the view that wages growth has fallen (Table 1).
Table 1. Average annual growth rates in WPI (excluding bonuses), private and public sectors, before and after 2010
|
Dec-97 to Dec-10 |
Mar-11 to Jun-22 |
Change |
|
|
WPI |
3.61% |
2.46% |
-1.16% |
|
CPI |
2.87% |
2.42% |
-0.45% |
|
Real WPI |
0.74% |
0.03% |
-0.71% |
Source: ABS. Calculations based on seasonally adjusted quarterly data. December quarter 1997 is the first quarter for which a quarterly growth rate can be calculated.
Lower wages growth has occurred across the private and public sectors (Figure 2). Since 2010, private and public sector wages have grown at around 2.5 per cent in annual average terms. Incidentally, in September quarter 2022, private sector WPI recorded a 3.4 per cent through-the-year growth rate, up from 2.6 per cent in June quarter, suggesting wages could be beginning an acceleration by which they eventually catch up with inflation and make up for any unexpected real wage declines.
Figure 2. WPI (excl. bonuses) growth: private and public sectors, through-the-year percentage changes, Sep-98 to Sep-22
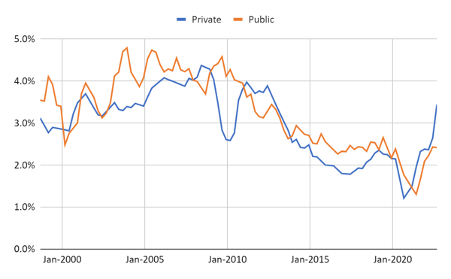
Source: ABS.
The WPI does a good job of holding all else equal, but that may be problematic when it comes to understanding how Australian workers are really doing. For instance, the core measure excludes bonuses. This does not appear to be a significant cause of understatement of the overall WPI, however. The WPI inclusive and exclusive of bonuses both grew at an average annual rate of around 2½ per cent since 2010.
There are other issues with the WPI. The WPI does not include superannuation, so it would not reflect increases in the superannuation guarantee. The superannuation guarantee rate is currently at 10.5 per cent and will continue to escalate 0.5 percentage points each financial year until it gets to 12 per cent in 2025-26. This would be a 3 percentage point increase in effective compensation since 2020-21, when it was a 9 per cent rate, not reflected in the WPI. Also, as noted by economists such as Outlook Economics’ Peter Downes and ANZ’s Catherine Birch, the WPI does not pick up wage gains due to job switching.3
There is also the possibility the CPI overstates cost-of-living pressures for many households. The deficiencies evaluating real wage changes using the WPI and the CPI are clear if we consider a measure of average hourly compensation in the National Accounts and use the consumption price deflator in the National Accounts rather than the CPI. Recently, this has not increased at the same rate as CPI, because it does not include the costs of building houses which the CPI does (Figure 3). As Financial Review columnist John Kehoe suggests, this means it could be more relevant as a cost-of-living measure than CPI.4 Since 2010, the household consumption deflator has increased at an average annual rate of 1.9 per cent compared with a 2.3 per cent annual average increase in the CPI, up to June quarter 2022 (the latest quarter for which National Accounts data are available).
Figure 3. CPI versus personal consumption deflator from the National Accounts, through-the-year percentage changes, Sep-98 to Jun-22
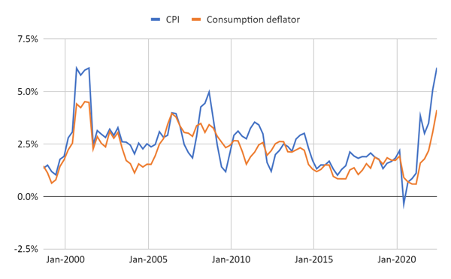
Source: ABS.
Hence a measure of real wages growth based on the National Accounts, and taking into account bonuses, superannuation and compositional change, gives a more optimistic view of the economy in recent quarters than a real wages growth measure based on WPI (Figure 4). That said, real wages growth on the National Accounts measure has declined from around 2.2 per cent on average from 1998 to 2010, to 1.1 per cent post-2010, so this is not to deny that wages growth has declined. Note the spike in real wages growth in 2020 is related to compensation of employees being stabilised by JobKeeper and hours worked dropping sharply due to the pandemic. Using National Accounts estimates of aggregate compensation of employees, an index of hours worked, and the household consumption deflator, the National Accounts-based real wages measure shows real wages growth staying positive, albeit low, over 2021-22 while it goes negative on the WPI measure.
Figure 4. National Accounts real wages growth versus real WPI growth, through-the-year percentage changes, Sep-98 to Jun-22
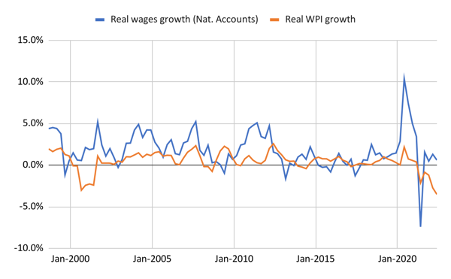
Source: ABS. Note the National Accounts real wages growth measure has been calculated using the household final consumption expenditure deflator, while the real WPI growth measure is calculated using CPI.
Clearly, compositional changes in the workforce are having a material impact on measured wages growth, given the WPI data suggest bonuses are not a big part of the story. The gap between the broader measure of earnings growth and the WPI appears strongly related to the upskilling of the economy over recent decades. ANZ senior economist Catherine Birch has observed: “There has been a structural shift towards higher-paying occupations over the longer term.”5 According to her estimates, employment in occupations in the highest-earning and second highest earning quintiles increased 18 per cent and 9 per cent respectively since February 2020, just before the pandemic. In contrast, employment in the middle and second lowest quintiles has fallen, while employment in the lowest quintile has slightly risen.6 Partly this would be related to population movements associated with the pandemic, such as skilled expatriates returning home and foreign students leaving Australia, but Birch’s point is correct over an even longer period excluding the pandemic.
Consider for example growth in employment by occupational groups (Figure 5). Over the low wages growth period since 2010, the proportion of total employed persons in the highest skilled occupations, Managers and Professionals, has increased from around 35 per cent to 39-40 per cent. This is further confirmation of the point made by Birch that structural change could be leading to a misleading impression regarding real wages growth coming from the WPI.
Figure 5. Total employed persons by skill level, proportion of total employed, four-quarter moving averages, Aug-98 to Aug-22
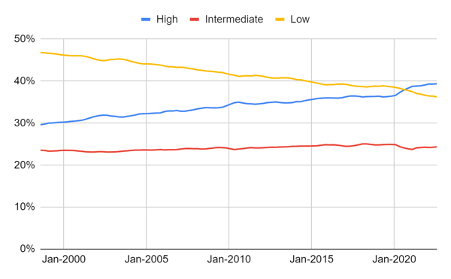
Source: ABS Labour Force Survey data on employment by ANZSCO occupational groups. Notes: For the purposes of this chart, the high-skilled occupational groups are Managers and Professionals, the intermediate groups are Technicians and Trades Workers and Community and Personal Service Workers, while the remaining are categorised here as low-skilled.
All this is not to say that the WPI is a bad measure. It is arguably a good measure for gauging inflationary pressures relevant to monetary policy. But it is not necessarily a good measure of wages growth when it comes to assessing what has been happening with the real wages of Australian workers, many of whom have been benefiting from higher wages associated with upskilling.
What has caused the low wages growth?
Various explanations, some more plausible than others, have been advanced for low wages growth since 2010. These can be divided into two broad categories: those related to the declining rate of productivity growth and those related to imbalances in labour market power between workers and employers.
As we shall see, the decline in productivity growth appears sufficient to explain the observed reduction in real wages growth, without the need for explanations related to imbalances between capital and labour in bargaining or immigration.
Productivity growth
Low wages growth is partly the result of lower productivity growth since at least the financial crisis. In this context, we are referring to labour productivity: real output or GDP per hour worked. All else equal, if labour productivity does not increase, then there is no additional GDP which would allow an increase in real wages. It is possible that real wages could increase in the short-term at the cost of business profitability, but that may not be sustainable in the long-run, given the need to earn an adequate return on capital invested. So economists consider labour productivity growth as a precondition for sustainable growth in real wages. In its 2017 Analysis of Wage Growth, the federal Treasury concisely summarised the link between productivity and real wages, noting it is not necessarily a close relationship in the short-run:
Over the long-term, wage growth is driven by productivity and inflation expectations. This means that real wage growth reflects labour productivity growth. Fluctuations across the business cycle can result in real wage growth diverging from productivity growth.7 In Australia, labour productivity growth has been on a downward trend since around the mid-2000s. In the issues paper for the Jobs and Skills Summit, the Treasury reported:
Recently, productivity growth in Australia has been low. It averaged 2.1 per cent per year from 1989 to 2004 but has only been 1 per cent per year since 2004. Average productivity growth over the past decade is now at its lowest rate in half a century.8 This is based on GDP per hours worked data in the Annual National Accounts (Figure 6).
Figure 6. Annual labour productivity growth, Australia, 1989-90 to 2021-22
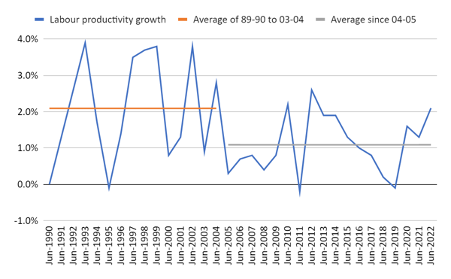
Source: ABS.
The productivity slowdown in Australia started prior to the financial crisis in the mid-2000s. In part, there was a reversion to the mean after the productivity surge of the 1990s.9 Partly, it may also have been related to the end of the era of microeconomic reform, which may have provided some one-off productivity gains.10 Ross Garnaut in his 2021 book Reset: Restoring Australia after the Pandemic Recession, wrote that “large productivity raising reform stopped at the beginning of the 21st century.”11 Governments would no longer advocate for good policy in the face of opposition from “a well-resourced part of the community”, in his view.12
Australian specific factors are likely only part of the productivity slowdown, however. A productivity slowdown has afflicted many advanced economies, and former US Treasury Secretary Larry Summers has talked about ‘secular stagnation’. World Bank economist Alistair Dieppe observed that “the productivity slowdown since the 2007-2009 crisis has been steep and prolonged.”13 Reasons suggested by Dieppe include a stabilisation in rates of educational attainment and lower rates of reallocation of labour from less to more productive sectors of the economy. The latter could be related to the long period of ultra-easy monetary policy which made it easier for faltering firms to survive. Other explanations offered by economists include an absence of fully transformative technological change, a view advanced notably by Robert Gordon.14 Also, some commentators suggest an increase in the concentration of the market power of large firms, although the relevance of this possibility in Australia is questionable, given Grattan Institute analysis in 2017 found “the market shares of Australia’s large firms have not changed much lately, on average.”15 This is speculative, but one possibility is the growth of government-subsidised services – in education, health, child care et cetera – could be reducing the reallocation that would otherwise occur. Moreover, even as these sectors have expanded, productivity challenges in these sectors have been ignored.
Using Australian longitudinal business data, Treasury researchers have found some support for the declining labour reallocation story in Australia. The researchers concluded:
While high-productivity firms are more likely to expand and low-productivity firms are more likely to contract (or exit), the extent to which this is true has diminished over time. Counterfactual analysis shows that the weakening responsiveness of employment growth to firm productivity this decade is a significant drag on aggregate labour productivity growth, which motivates further analysis of structural policies that affect competition and labour mobility.16
The call by the Treasury researchers to further analyse structural policies that could be inhibiting reallocation and productivity is a sound one.
To what extent can we attribute the decline in real wage growth to the decline in productivity growth? Certainly, the one percentage point drop in average productivity growth the Treasury identified appears sufficient to account for the drop in real wages growth we have seen. But that is an imprecise way of working out the contribution. OECD researchers have found that a decline in the labour share of income is another important contributing factor.17 This means we need to consider what has been happening in the labour market which could influence the labour or wages share of income.
Imbalances in the labour market
Part of the reason for declining wages growth may be due to factors other than productivity affecting the balance of labour demand and supply. Over the long-term the labour share of income has declined and some commentators have suggested this reflects a change in relative bargaining power between employers and employees in favour of employers. Possible reasons suggested for a decline in bargaining power include declining rates of unionisation – falling from around 46 per cent of the workforce in 1986 to 14 per cent in 2020 – and the rise of the gig economy.18
RBA economist Gianni La Cava has noted that the long-term decline in the labour share of income in Australia is similar to other countries, and is largely associated with higher imputed rents to homeowners as well as higher bank profits since financial deregulation in the 1980s.19 That is, it does not appear to be driven by employers exploiting workers across the whole economy. While the wages share of total factor income fell to below 50 per cent in 2021-22 according to June quarter National Accounts estimates, that is associated with booming commodity prices which have super-charged profits of resources companies (Figure 7).
Figure 7. Wages share of total factor income, percent of total factor income, 1989-90 to 2021-22

Source: ABS.
This is not to deny that there could be elements of imperfect competition across the economy. It is only to say that the declining wages share is not necessarily an indicator of that abuse. The wages share as an indicator is susceptible to structural change, of the kinds identified by La Cava, and also due to people shifting into becoming business owners instead of continuing as employees.
Another way of looking at the role of the labour market is to think about the Phillips Curve, the short-run relationship between unemployment and inflation. Considering the low-inflation outcomes, unemployment was probably above the non-accelerating inflation rate of unemployment (NAIRU) during much of the last decade, and this has resulted in below average wages growth and inflation.
To an extent, the maintenance of an unemployment rate in the 5-6 per cent range pre-COVID may have been due to high levels of immigration. Saul Eslake, among other economists, has identified the role played by the drop in immigration during the pandemic on the unemployment rate.20 Over the pandemic period, the drop in immigration meant the economy had to produce fewer jobs to employ people coming into the labour force.23 As Eslake explained in August 2021:
Since the closure of our international borders in March last year, the civilian working age population has grown at an average of 4,300 a month…That means that, all else being equal, we’ve only needed to ‘create’ around 3,000 new jobs a month in order for the unemployment rate to fall.21
A large gap opened up between employment and labour force growth (Figure 8) and subsequently large reductions in unemployment followed as employers turned to previously unemployed people.
Figure 8. Immigration and labour supply growth, Australia, through-the-year changes of monthly ABS Labour Force estimates, Sep-98 to Oct-22

Source: ABS.
Arguably, the pandemic has represented a quasi-experiment during which immigration was shut off. Net overseas migration was in the range of 200,000 to 300,000 people annually leading up to the pandemic, but ended up negative, at around -89,000, in 2021, according to ABS estimates. Of course, the combination of massive monetary and fiscal stimuli was important in driving up labour demand once pandemic restrictions on business activity were removed, but no doubt the big drop in labour supply growth contributed to the national unemployment rate falling to a rate of around 3½ per cent, not seen since the early 1970s.
The impact of immigration on unemployment and also wages is a challenging one to estimate, however, as immigration also adds to the demand for goods and services and hence the derived demand for labour. There are mixed results regarding the impact of migration on domestic labour markets. In the US, negligible impacts have been found by some economists such as Berkeley’s David Card, while Harvard’s George Borjas has found significant responses of wages to immigration, finding that, for every 10 per cent increase in labour supply that immigration brings about, the wages of competing workers fall 3-4 per cent.22
In 2016, in its Migrant Intake into Australia Inquiry Report, the Productivity Commission concluded that immigration did reduce hourly wages:
While recent immigration was not associated with Australian unemployment, it was associated with fractionally lower hourly wages, slightly longer working hours and marginally higher participation rates for the local labour force.
It is unclear exactly what the commission meant by “fractionally” regarding hourly wages, as one study led by ANU Professor Bob Breunig that it cited found a 2.6 per cent fall in hourly wages for incumbent workers for every 1 percentage point increase in the share of the community comprised of recent immigrants, defined as those arriving in the last five years, in the Australian community.24 The commission noted the share of immigrants increased 1.6 percentage points over 2006 to 2011 and by 0.7 percentage points over 2001 to 2011.25
University College London economists Courtney Brell and Christian Dustmann reviewed Australian studies of the labour market impact of wages in a paper presented to the RBA’s 2019 Low Wage Growth conference. While Dustmann concluded studies tended not to show adverse impacts from immigration, he acknowledged that further work is needed. In particular, Brell and Dustmann observed:
Despite high youth unemployment and underemployment rates (around 14 per cent and 20 per cent respectively in 2015), the commission estimated that temporary migrants accounted for 13 per cent of youth employment, and half of all growth in the youth labour force in 2014-15. As such, though there is not currently strong evidence that any particular group’s wages are suffering as a result of immigration, concern remains that this may be the case, and so further evidence is needed to resolve the question satisfactorily.26
Whether Australia should return to high levels of immigration in the absence of such further evidence is debatable, as discussed in the next section.
Finally, one possible reason for low wages growth in the last decade could be because of a wage overhang, after wages grew stronger than they otherwise would have during the resources booms in the 2000s. That is workers benefited from a dividend during the terms-of-trade boom, with their real purchasing power increasing, as found by former Productivity Commission researcher Dean Parham.27 Reflecting on the Parham’s research, RBA economist Gianni La Cava observed in 2019:
Seen over a longer timeframe, the divergence between consumer wages and labour productivity appears to have been a temporary phenomenon and some of the stagnation in consumer wages over recent years is part of the adjustment process to the unwinding of the mining boom. Since 1995, the growth in real consumer wages has basically matched the growth in labour productivity.
La Cava reminds us to consider as long a timeframe as possible. We should not overreact to apparent sluggish real wages growth and adopt risky policy responses which could end up being counterproductive, as discussed in the next section.
Policy implications for wages growth
This review of the evidence on wages growth in Australia leads to a number of policy implications, primarily in the areas of structural policy settings broadly, industrial relations (IR) specifically, and immigration.
Structural policy settings
While the extent of the contribution is debatable, there is little doubt that lower productivity growth has translated into lower wages growth. Hence, lifting productivity growth is seen as a desirable way to boost real wages and real incomes more broadly. A wide range of economic policy settings impact on productivity, including industrial relations, covered in the next sub-section, tax, work health and safety, contestability of public services provision, and environmental regulations, among others. In a previous CIS Policy Paper, Rationalising Regulation, this author described the wide range of regulation in Australia that could hamper productivity growth.28 A thorough review of the scope of regulation in Australia would be desirable, with a view to eliminating duplication among state and federal governments, particularly in environmental regulation, and removing regulation where benefits do not exceed the costs.
The debate over appropriate tax policy settings is outside the scope of this paper, but there appears widespread agreement Australia’s tax policy settings could be improved substantially. Some of the worst taxes, such as stamp duty, are at the state level, and hence Commonwealth-state cooperation is arguably needed for a comprehensive tax review. This would certainly need to be the case if any proposed changes involved the Goods and Services and Tax (GST), such as shifting the burden away from more inefficient income taxes to the less inefficient GST.
Other ways to improve productivity would include cutting industry assistance which could be inhibiting the reallocation of workers to more highly productive uses. While Australia no longer has a high tariff wall, as it did up until the 1990s, federal and state governments still provide substantial assistance to industry from the budget. The Productivity Commission’s most recent Trade and Assistance Review revealed $11-12 billion of annual assistance from budgetary outlays and tax concessions to industry even prior to the pandemic when assistance surged, reaching $16 billion of budgetary support in 2020-21.29 This looks like a good place to start in terms of finding budgetary savings and ultimately boosting productivity at the same time.
Industrial relations
As this paper is investigating wages growth, naturally a consideration of IR policy is necessary. This is a fraught area for improved policy, of course, owing to its political nature. But the importance of improved IR policy settings needs to be emphasised. As Judith Sloan wrote in her 2020 CIS Policy Paper Industrial Relations in a Post-COVID World:
Industrial relations regulation in Australia is an historical anomaly. It is highly prescriptive and complex, with substantial third party involvement. Both employers and individual workers are disempowered to the point where mutually acceptable exchange is often forbidden.30
Alas, one of the outcomes of the Jobs and Skills Summit is to make Australia’s IR policy settings worse. There is a view that one reason for low wages growth is an imbalance in bargaining power between labour and capital, in favour of capital. It is argued that one way to rebalance things is to allow industry-wide or multiple-employer bargaining. The federal government plans to legislate to enable this, despite warnings from business groups.
On 27 October 2022, the Albanese government introduced the Fair Work Legislation Amendment (Secure Jobs, Better Pay) Bill to Parliament. In his second reading speech, Minister for Employment and Workplace Relations Tony Burke said:
The bill will rename and remove barriers to access the existing low-paid bargaining stream, with the intention of closing the gender pay gap and improving wages and conditions in sectors such as community services, cleaning, and early childhood education and care, which have not been able to successfully bargain at the enterprise level.
As the Minister’s statement suggests, there is an existing mechanism to bargain across multiple employers, but this is now seen by unions and the government as inadequate. It is being replaced with what the government is labelling as ‘supported bargaining’.
Additionally, it is proposed that there is a broadening of Single Interest Employer Authorisations to allow employee representatives to apply to have two or more employers declared as a single employer, and hence subject to multi-employer bargaining that way. Australian Chamber of Commerce and Industry (ACCI) chief executive Andrew McKellar has warned:
The significant broadening of the ‘single-interest employer’ test exposes the Australian economy to sector-wide strike action, disrupting supply chains and key industries at a time of extraordinary global volatility.31
Conceptually, there are two interrelated problems with attempting to boost real wages by increasing the bargaining strength of employees through IR policy changes. First, any changes only affect the employees’ ability to bargain over nominal wages. If they flow through to higher prices, then they do little, if anything, for real wages. Incidentally, empirical evidence from OECD countries suggests that higher union density predicts higher inflation, which could be taken as some evidence of self-defeating nominal wage increases.32 Second, if higher nominal wages increase inflation, the RBA will react by increasing interest rates, increasing unemployment.
There is the risk of disruptive strike action as employees from multiple employers or across the industry engage in direct action in pursuit of higher wages. There is also the risk of a self-defeating wage-price spiral, a phenomenon the Bank for International Settlements (BIS) warned advanced economies to be wary of recently.33 In the September 2022 RBA Bulletin, RBA economists have suggested the risk of a wage-price spiral in advanced economies, and presumably in Australia, is “probably quite low”.34 But they acknowledge that it remains a possibility, concluding:
…if inflation remains elevated and if monetary policy doesn’t respond sufficiently, there is a risk that medium-term expectations could de-anchor and then feed into firms’ pricing decisions and wage outcomes in these economies.35
Inflation expectations among union officials increased sharply from late 2021 in Australia and presumably will start to be reflected in enterprise agreements (Figure 9). Given the stickiness in wages, and that wages are often only revised every year, it is possible to have an erosion of real wages via unexpected inflation. The inflation expectations data show that it was not until the first half of 2022 that union officials and market economists began to expect inflation above the 2-3 per cent inflation target. As at December quarter 2022, union officials expected inflation over the next year of 5.1 per cent, up substantially from the 3.0 per cent they were expecting over the next year when in December quarter 2021. Given CPI inflation was 7.3 per cent through-the-year to September 2022, the surprise that recent inflation represents is apparent.
Figure 9. Inflation expectation, through-the year percentage rates 1 year and 2 years ahead
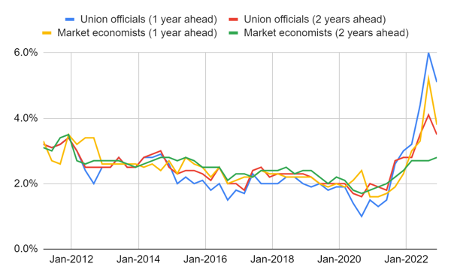
Source: RBA.
Due to union officials and market economists being surprised by recent inflation, the apparent fall in real wages could be a timing issue, due to a lagged response of wages to inflation and could ultimately end up being corrected. Indeed, RBA analysis of inflation and wages growth data has found for advanced economies that “Historically, it has generally been the case that wages growth has tended to fall below the rate of inflation as the latter moves to high rates”.36
The proposed changes to the Fair Work Act appear to be largely a retreat from enterprise bargaining and a move back in the direction of the IR system Australia had prior to the Keating reforms in 1993. ACCI chief executive Andrew McKellar commented: “In a throwback to centralised wage fixing, the legislation will also see bargaining disputes quickly referred to compulsory arbitration.”37 However, McKellar did acknowledge that proposed changes to the Better Off Overall Test (BOOT), giving greater consideration to the views of the parties to a workplace agreement, would be beneficial.
The historical data of working days lost to industrial action in Australia tell a sad tale about an economy operating under the old IR regime (Figure 10). In 1974, there were 6.3 million working days lost, compared with an annual average of only 137,000 over 2010 to 2019. That is, working days lost were 50 times higher in 1974 than they averaged last decade. Of course, there are large differences between 2022 and 1974, including a much lower rate of union membership which may allay concerns over mass industrial action somewhat. That said, it is probably impossible to forecast what could happen under a different IR regime.
Figure 10. Working days lost to industrial action in Australia
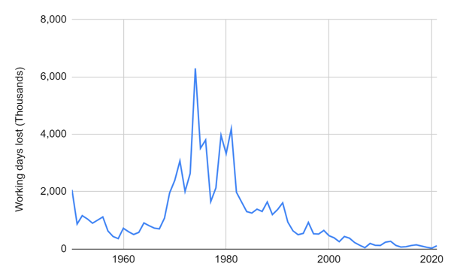
Source: ABS.
Education
One area where Australia could achieve productivity gains is through improving our educational performance, across all levels and arguably most urgently at the school level, which appears to be failing to give Australians a good foundation for future learning. In 2020, the Productivity Commission, reflecting on Australia’s declining Program for International Student Assessments (PISA) scores, commented:
Overall, Australia’s downward trend in school achievement — including relative to a number of OECD peers — is a cause for concern. It is, and should be, a focus for policy attention. Improving educational attainment is a potential source of long-run productivity growth for Australia.38 According to the PISA data, in 2018, average achievement in reading was nine months behind the average achievement of students in 2003, and in mathematics it was one year behind.39
Australia appears to have a particular problem educating boys. As the CIS’s Education Program director Glenn Fahey has highlighted, one in seven boys approaching the school-leaving age do not meet the national minimum standard for reading based on NAPLAN results.40
Improving teacher quality appears to be one promising approach to turn around our declining educational performance. Fahey and CIS research director Simon Cowan have suggested teacher training can be improved by having more workplace-based learning for teachers, with trainee teachers having to spend more time in front of students before becoming qualified.41 Greater quality assurance of teacher training providers would also be desirable.
Attracting high-calibre people into teaching and retaining them is also important, as noted by Grattan Institute CEO Danielle Wood at the 2022 Jobs and Skills Summit.42 Grattan researchers have suggested that offering higher salaries to top teachers could be one way to improve teacher quality. This may have some merit, but would need to be done in a financially sustainable way. It would ideally be part of a performance-based pay scheme which stopped poorly performing teachers from advancing into higher pay grades. Fahey has commented that performance-based pay would help improve outcomes:
While Australian teachers earn relatively high starting salaries — and generally high salaries across-the-board — pay is flat and compressed. That means that, after a few years, a teacher’s salary doesn’t grow much. And there’s little difference in pay between any two teachers who have worked for a similar number of years.
It’s this compression in pay — not necessarily the pay level itself — that’s responsible for suboptimal teacher outcomes.43 Of course, performance-based pay for teachers would probably experience resistance from teachers unions, as has occurred in response to proposed performance-based pay in NSW.
Immigration
Immigration prior to the pandemic may not have been a large contributor to declining real wages growth for the reasons discussed above, but it probably had some impact. Hence, any discussion of policies that could affect wages growth should consider immigration. Australia has had one of the highest rates of immigration in the world in recent decades. As noted above, the quasi-experiment of the pandemic has revealed that the high rate of immigration in the lead up to the pandemic was substantially affecting our domestic labour market, possibly to the detriment of some Australian workers.
The Australian government intends to return to a high level of immigration. Indeed, the current government has announced that the planned level of permanent immigration in 2022-23 will increase to 195,000 places, up from the 160,000 places planned by the previous administration. On top of that will be large numbers of temporary migrants with working rights, particularly international students. Prior to the pandemic, there were around 580,000 international students residing in Australia.44
While employers are concerned about skills shortages, the government is denying itself the opportunity to more gradually increase immigration, to test its impact on labour supply, unemployment and wage outcomes. Various researchers have noted how difficult it is to discern these impacts in the non-experimental empirical data, but the current situation allows us to run another quasi-experiment. It is incumbent on governments to ensure a high level of immigration is in the best interest of Australian workers and the population more broadly, taking into account not only its labour market impacts but its impacts on property prices, urban sprawl, traffic congestion, and the required levels of infrastructure investment.
This Policy Paper has evaluated the evidence relating to wages growth in Australia and various policy recommendations that have been advanced to promote wages growth. While there is no doubt wages growth has been low, it should also be borne in mind that:
- the fall in real wages growth over the last decade or so is probably mainly due to lower productivity growth;
- private sector wages are starting to accelerate (as of late 2022);
- the scale of the problem is likely overstated for various reasons, including the changing composition of the workforce, increases in superannuation contributions, and the surprising (to many, including the RBA) acceleration of inflation;
- this is an international phenomenon; and
- there is a major risk of counterproductive policy measures being advanced.
A return to industry-wide bargaining would be counterproductive. In the short-term, most likely so would a return to high levels of immigration. Governments should adopt a cautious approach in any policy making directed at boosting wages, as there is a high risk they would do more harm than good.
No-regrets policies would include improving our education and training system so it is boosting labour productivity and real wages in the long run. The real challenge is to increase real wages through higher labour productivity, avoiding the risk that increases to nominal wages will simply be eroded by inflation to which they have contributed.
References
- The Treasury (2022, p. 1) By nominal wage growth the Treasury means the rate of change in some measure of average wages paid to employees, not adjusted for inflation. By real wages growth, it means the same measure but where wages have been adjusted for inflation. Real wages growth can be approximated by subtracting the inflation rate from the wages growth rate. Also, for clarity, when we are talking about wages, we are also talking about salaries, and depending on the definition we are also considering any bonuses paid.
- DeLong, J.B. (2022) Slouching Towards Utopia: An Economic History of the Twentieth Century, Basic Books, New York City.
- Kehoe, J. (2022) “Cost of living ‘crisis’ is exaggerated”, Australian Financial Review, 7 September, 2022; Mizen, R. (2022) “Boom in highly paid workers skewing wages data: ANZ”, Australian Financial Review, 17 October, 2022.
- Kehoe, J. (2022) “Cost of living ‘crisis’ is exaggerated”, Australian Financial Review, 7 September, 2022.
- Mizen, R. (2022) “Boom in highly paid workers skewing wages data: ANZ”, Australian Financial Review, 17 October, 2022.
- Ibid.
- Treasury (2017) Analysis of Wage growth, Australian Government, Canberra, p. 16. .
- Treasury (2022) Jobs and Skills Summit: Issues Paper, Australian Government, Canberra, p. 2 .
- Dolman, B., Lu, L. and Rahman, J. (2006) “Understanding productivity trends”, Economic Roundup Summer 2006, Australian Treasury, Canberra.
- Parham, D. (2005) “Is Australia’s Productivity Surge Over?”, Agenda, vol. 12, no. 3, pp. 253-66.
- Garnaut, R. (2021) Reset: Restoring Australia after the Pandemic Recession, La Trobe University Press, Melbourne, p. 64.
- Ibid.
- Dieppe, A. (2020) “The broad-based productivity slowdown, in seven charts”, World Bank Blogs, https://blogs.worldbank.org/developmenttalk/broad-based-productivity-slowdown-seven-charts.
- Gordon, R. (2018) “Why Has Economic Growth Slowed When Innovation Appears to Be Accelerating?”, NBER Working Paper, no. 24554.
- Minifie, J. (2017) Competition in Australia: Too little of a good thing?, Grattan Institute, p. 3.
- Andrews, D. and Hansell, D. (2019) “Productivity-Enhancing Labour Reallocation in Australia”, Treasury Working Paper, Australian Treasury, Canberra.
- Schwellnus, C. (2019) Decoupling of Wages from Productivity, OECD, Paris, p. 2
- Trade union membership estimates are from the ABS. Regarding the gig economy, related earnings would show up in the Gross Mixed Income part of total factor income, making the interpretation of the gig economy’s impact on wages problematic.
- La Cava, G. (2019) “The Labour and Capital Shares of Income in Australia”, Reserve Bank of Australia Bulletin, RBA, Sydney, pp. 1-22.
- Eslake, S. The Economics of Immigration, talk to the Sydney Institute, 3 August, 2021, p. 6.
- Ibid.
- Borjas, G. (2004) “The labor demand curve is downward sloping: Reexamining the impact of immigration on the labor market”, The Quarterly Journal of Economics, vol. 118, no. 4, pp. 1335-74.
- Productivity Commission (2016) Migrant Intake into Australia, Productivity Commission, Canberra, p. 191.
- Ibid, p. 198.
- Ibid.
- Brell, C. and Dustmann, C. (2019) Immigration and Wage Growth: The Case of Australia, paper presented at Low Wage Growth conference held by the Reserve Bank of Australia, Sydney, 4–5 April 2019, p.33.
- Parham, D. (2013) “Labour’s Share of Growth in Income and Prosperity”, Visiting Researcher Paper, Productivity Commission, Canberra, p.2.
- Tunny, G. and Scott, B. (2020) “Rationalising Regulation: Helping the economy recover from the corona crisis”, CIS Policy Paper.
- Productivity Commission (2022) Trade and Assistance Review 2020-21, Productivity Commission, Canberra, p. 5.
- Sloan, J. (2020) Industrial Relations in a Post-COVID World, CIS Policy Paper, p. 1.
- Australian Chamber of Commerce and Industry (ACCI), “Seismic IR shift means increasing strikes, higher unemployment”, Media Release, 27 October, 2022.
- Bowdler, C. and Nunziata, L. (2007) “Trade Union Density and Inflation Performance: Evidence from OECD Panel Data”, Economica, vol. 74, no. 293.
- Boissay, F. (2022) “Are major economies on the verge of a wage-price spiral?”, Bank for International Settlements (BIS) Bulletin, no. 53.
- Suthaharan, N. and Bleakley, J. (2022) “Wage-price Dynamics in a High-Inflation Environment: The International Evidence”, RBA Bulletin,p. 59.
- Ibid.
- Ibid, p. 56.
- Australian Chamber of Commerce and Industry (ACCI), “Seismic IR shift means increasing strikes, higher unemployment”, Media Release, 27 October 2022.
- Productivity Commission (2022) Trade and Assistance Review 2020-21, Productivity Commission, Canberra, p. 19.
- Wood, D. (2022) Thinking Big: Maintaining full employment and boosting productivity, Jobs and Skills Summit Keynote Address, p. 13.
- Fahey, G. (2022a) “Improving literacy levels for boys must be a priority”, Daily Telegraph, 2 November, 2022.
- Cowan, S. and Fahey, G. (2022) “How to solve Australia’s puzzling education conundrum”, Canberra Times, 24 September, 2022.
- Wood, D. (2022) Thinking Big: Maintaining full employment and boosting productivity, Jobs and Skills Summit Keynote Address, p. 15.
- Fahey, G. (2022b) “Linking pay to performance the best way to help teachers”, Daily Telegraph, 26 June, 2022.
- Hurley, P. (2022) “International students are returning to Australia, but they are mostly going to more prestigious universities”, The Conversation, published 2 November, 2022.