Executive summary
The federal, state and territory Energy Ministers have introduced a shadow carbon price for the national electricity market. This ‘value of emissions reduction’ (VER) sets the value of carbon abatement at $66 per tonne in 2023, rising six-fold to $420 by 2050. Costs will be passed onto consumers through electricity network projects because the regulatory investment framework will now include the interim VER as a benefit in their cost benefit analyses. This change is likely to increase the assessed benefits of projects that claim to reduce emissions, projects which might otherwise have been deemed uneconomic.
This paper estimates that including VER as a class of market benefit could enable the approval of additional projects worth up to $508 billion, should proposals to eliminate all emissions be enacted today. The maximum increase in electricity prices is 15.6 cents per kWh, meaning an $855 increase in electricity bills a year for a typical household. Electricity costs could increase even further if projects are approved in the future, when emissions reductions are more valuable.
As the method for estimating emissions reductions is yet to be finalised, CIS has used assumptions from the Australian Energy Market Operator’s (AEMO) Integrated System Plan (ISP) along with the interim VER to estimate the maximum benefit a project could claim from emissions reduction and the maximum cost that could then be passed onto consumers. This hypothetical project would result in electricity grid and motor vehicle emissions being fully abated.
The paper does not attempt to predict when sufficient projects to achieve full abatement could be found. But because this VER is a mechanism designed to fund hundreds of billions of dollars of costs through consumers’ bills, it is crucial to calculate the upper limit the mechanism could allow if exercised immediately. This is especially important because any delay in implementation further elevates the upper bound of costs that could be passed on to consumers, which we assess as being as high as $1294 per household if implemented in 2040.
Introduction
In a bid to send a clear signal — to market participants, investors and the public — of the government’s commitment to decarbonise Australia’s electricity grid, Energy Ministers have introduced a shadow carbon price into the energy sector. The new carbon pricing in the form of a value of emissions reduction (VER) effectively makes decarbonisation a central factor in the regulatory and investment decision-making processes within the energy market.
Including the VER in the regulatory investment framework will profoundly impact the planning and approval of network infrastructure projects. It alters cost benefit analyses underpinning the Integrated System Plan (ISP) — the blueprint for Australia’s energy transition — and the Regulatory Investment Test (RIT) for network infrastructure projects. Specifically, it will increase the assessed benefits of projects that claim to bring about a reduction in emissions but might otherwise have been deemed uneconomic. As a result, such projects will be eligible for approval and more projects can be approved at greater expense if included in the pursuit of emission reductions and passed onto consumers.
Large network service providers stand to benefit significantly from the change — while consumers and small businesses are likely to face higher electricity bills as they bear the financial burden of these projects through increased payments to these network service providers.
The guidelines for embedding the VER in the cost benefit assessment of network investments are currently being developed, with the regulator expecting to finalise the guidelines by December 2024.[i] In the meantime, the Australian Energy Market Operator (AEMO) retains considerable discretion in deciding on a method for estimating emissions reductions in the Final 2024 ISP, due to be published in June — without any consultation on their incorporation of this shadow carbon price. The result of interim guidance from the Australian Energy Regulator (AER) and the Energy Ministers is that AEMO’s Final 2024 ISP will be used by network companies for their regulatory approval of new investments.[ii] This could lead to the approval of costly projects based on an unconsulted method, resulting in expensive and irreversible decisions that directly impact Australia’s energy landscape and consumers’ electricity bills.
This paper aims to evaluate the maximum potential impact on electricity prices for consumers resulting from the inclusion of emissions reduction benefits in the regulatory investment framework. The goal is to help policymakers in balancing consumer costs with emissions reductions and broader energy policy objectives, including addressing cost of living pressures. If the Energy Ministers did not intend for such significant costs to affect household budgets, they should have either moderated the prescribed carbon pricing or required the finalisation of the method for applying the VER in cost benefit analyses before its use in the Final 2024 ISP or other regulatory processes.
The paper begins by discussing the recent legislative initiative to make emissions reduction a central objective in energy market laws and explains its potential implications for the regulatory planning and assessment of electricity network investments. This is followed by analysis of the maximum cost impact on consumers should projects be approved that promise to eliminate all emissions from the National Electricity Market (NEM) grid and motor vehicles. Following this, a sensitivity analysis is conducted to explore the potential cost ramifications of delaying project approvals until 2030 or 2040 — a crucial consideration given the sixfold increase in the interim VER from now to 2050.
How the emissions reduction objective was introduced
In May 2023, the Ministerial Council on Energy (MCE) — consisting of federal, state and territory Energy Ministers — collectively decided to incorporate carbon emissions reduction into the National Electricity Objective, National Gas Objective and National Energy Retail Objective (referred to as the national energy objectives).[iii] This decision aims to integrate emissions reduction in the national energy laws, enabling Australia’s energy market bodies — the Australian Energy Market Commission (AEMC), the Australian Energy Market Operator (AEMO), and the Australian Energy Regulator (AER) — to explicitly consider emissions reduction in executing their respective powers and functions.
The decision was formalised through the Statutes Amendment (National Energy Laws) (Emissions Reduction Objectives) Act 2023, which took effect on 21 November 2023. Following this, the MCE requested the AEMC to amend the National Energy Rules to reflect this new objective in the network planning and investment framework.[iv] This change means that AER is obliged to consider emissions reduction in its decision-making alongside the other objectives of price, quality, safety, reliability and security of energy supply.[v]
In February 2024, the MCE established an interim methodology to determine the value of emissions reduction.[vi] The AER later issued a draft guidance based on this methodology, setting an interim value of emissions reduction (VER) at $66 per tonne of carbon abated in 2023, rising more than sixfold to $420 per tonne by 2050 (Figure 1), in line with the Net Zero by 2050 target.[vii] The interim VER starts off nearly double in real terms the $23 per tonne carbon price implemented by the Gillard government in 2012, which was subsequently abolished by the Abbott government in 2014.
Under the revised planning and investment framework, electricity network infrastructure projects assessed through the Integrated System Plan (ISP) and the Regulatory Investment Test (RIT) processes must now include the value of greenhouse gas emissions reduction in their economic assessments using the interim VER.[viii] In other words, emissions reductions are now considered an additional class of market benefit in the cost benefit analyses for network investments.
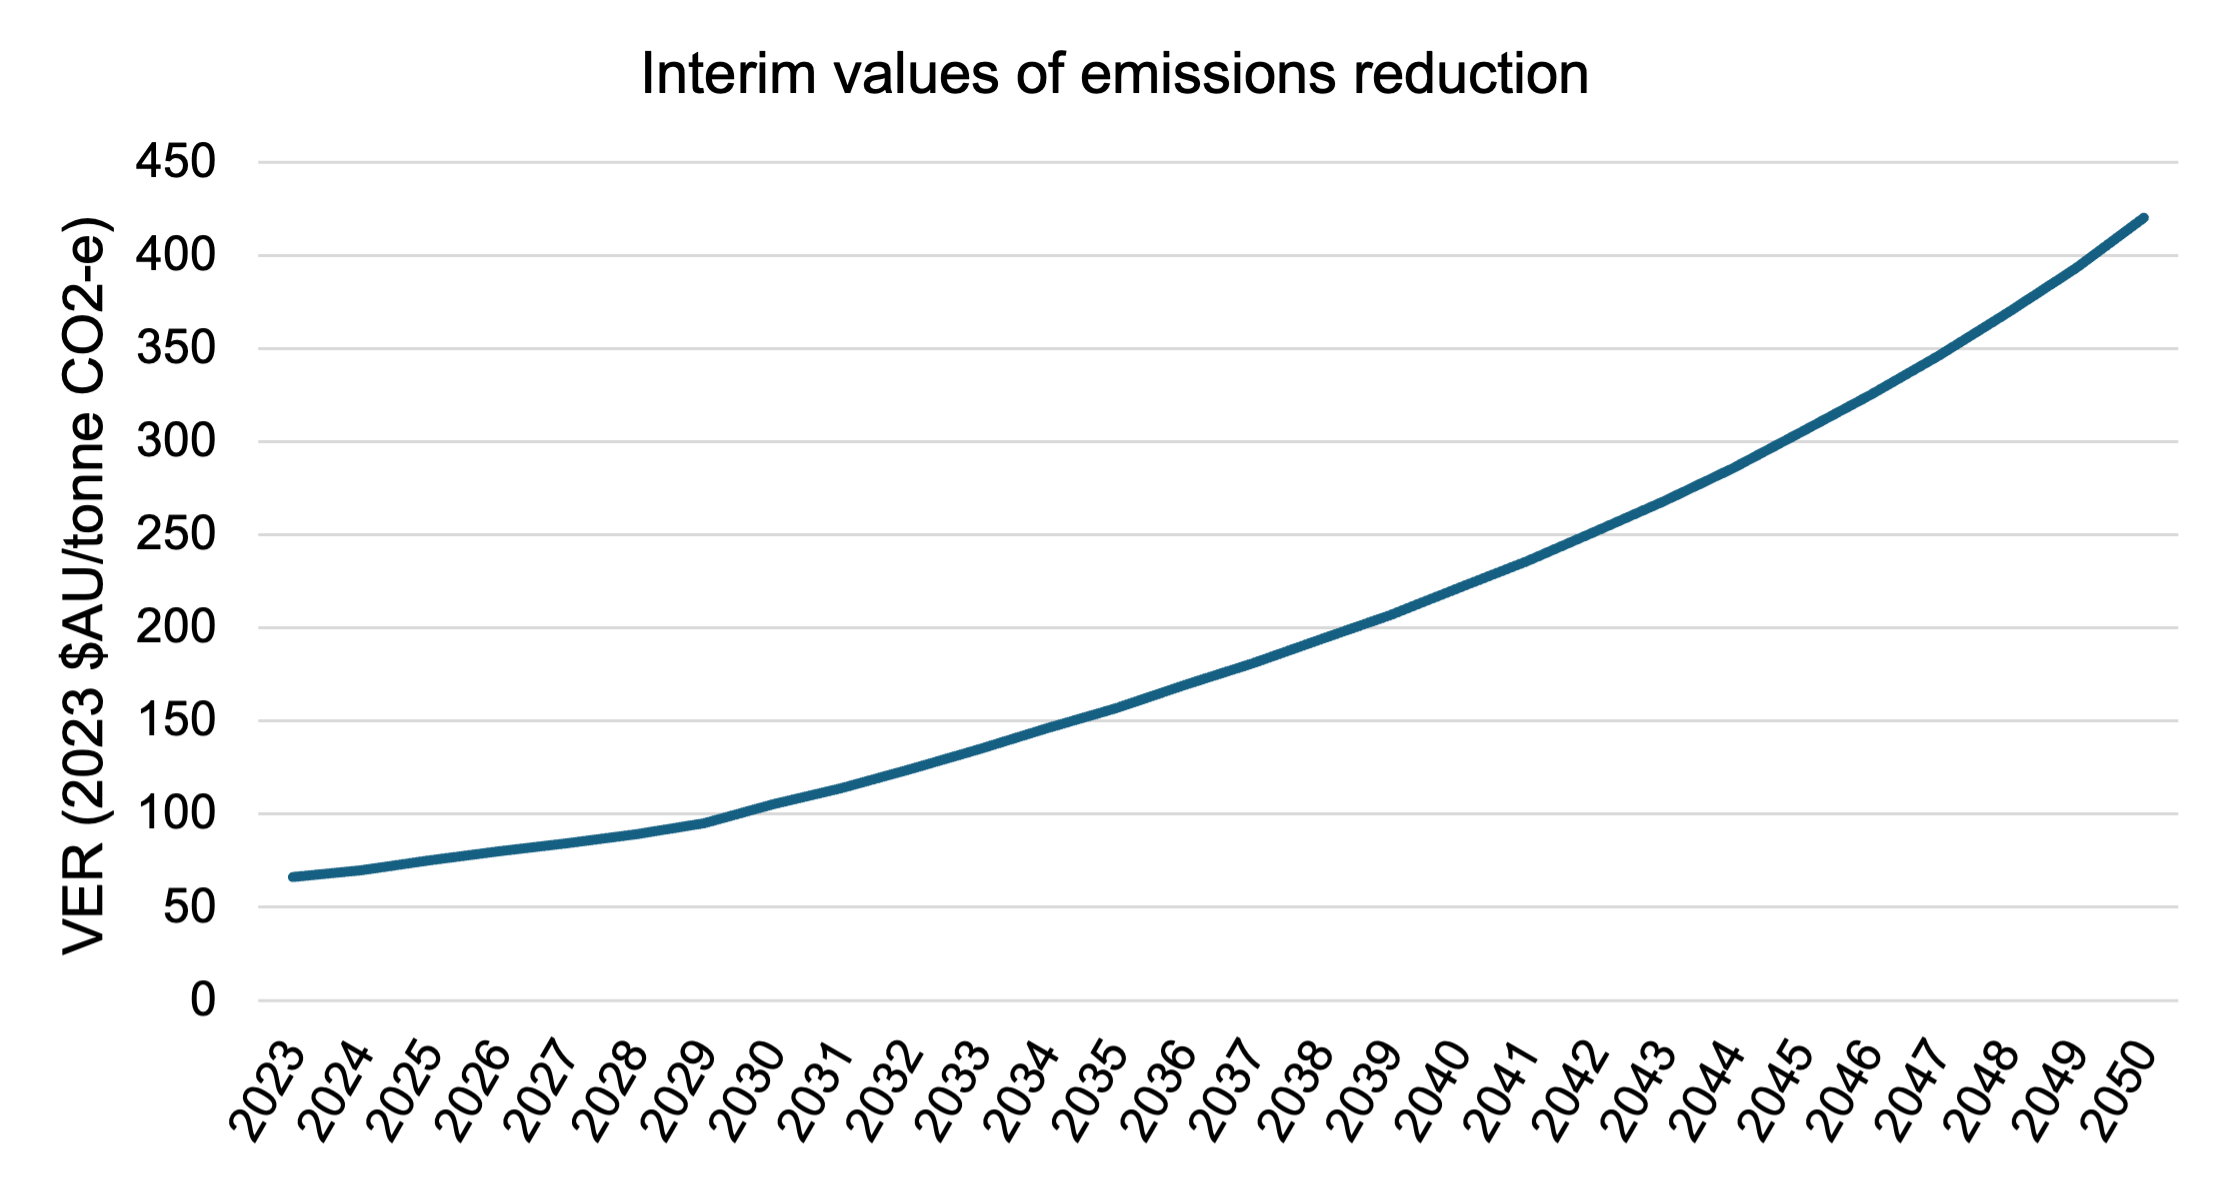
Figure 1. Interim values of emissions reduction (2023-2050, $/tonne CO2-e), as prescribed by MCE methodology.
This change increases the calculated benefits in cost benefit evaluations of major transmission and storage projects, favouring projects that were previously considered uneconomic but claim to reduce emissions.[ix] As a result, more NEM projects may receive approval to earn regulated returns which are delivered mainly through higher electricity prices. Network businesses stand to benefit significantly from these changes, increasing the size of the regulatory asset base (RAB) on which they can get a guaranteed return at the expense of households and businesses.
The AER is reviewing the cost benefit analysis (CBA) and RIT application guidelines to determine how emissions reduction benefits will be accounted for in assessing network investments. However, until these guidelines are finalised, AEMO — the energy planner and market operator — has the discretion to determine the method for estimating emissions reductions and valuing them. Such method will not have undergone any stakeholder consultation and scrutiny but will likely be reflected in the Final 2024 ISP set to be published in June 2024. Moreover, the AER has required that RITs “should be undertaken using a consistent approach to that taken in the ISP”.[x] This means network service providers will also adopt the unconsulted method from the Final 2024 ISP in June 2024 until the CBA and RIT guidelines are finalised by the regulator. This could result in expensive and irreversible decisions in the energy sector which do not align with consumer interests.
Method for estimating the impact of VER
This paper estimates the emissions reduction benefit that network service providers can claim and the resulting implications for electricity consumers. This has been done by imagining a project that immediately abates all NEM and motor vehicle emissions, and which is ‘marginal’, such that costs are equal to the calculated benefits of emissions reduction. This project is considered the ‘investment case’ and is measured against a ‘base case’ established using reasonable assumptions, and such that the project would achieve outcomes specified in the ISP’s Optimal Development Path (ODP). Emissions reductions are the difference between the world in the base case and the world in the investment case.
Emissions sources
This paper has identified two sources of emissions reduction which are both significant and plausibly within the scope of the regulatory amendment: NEM grid emissions and transport emissions. Including NEM grid emissions reflects the clear intent of the VER, which is to permit transmission projects that allow the grid to transition from fossil-fuel generators to renewable energy sources.[xi] Additionally, project proponents may capitalise on the benefits of reducing carbon emissions from transportation, specifically from motor vehicles. Distribution companies could initiate projects promoting mass adoption of battery electric vehicles (BEVs) and plug-in hybrid electric vehicles (PHEVs) among consumers and businesses. The AER has acknowledged this trend, citing increased expenditure to integrate consumer energy resources such as PV, batteries, community batteries and electric vehicles into the network. The AER also “consider that the introduction of a value of emissions reduction would likely have an impact on the business cases that support various consumer energy resource proposals.”[xii] These statements provide ample reason to believe network service providers can propose projects that directly or indirectly lead to reduced emissions from the NEM and motor vehicles.
Calculating the emissions reduction benefit and its effects
This paper estimates the emissions reduction market benefit as the value of the amount of carbon emissions a project abates relative to the base case without the project. This aligns with how other market benefits are evaluated in ISP and RIT processes. Specifically, the emissions reduction benefit is the quantity of emissions reduction in each year multiplied by value of emissions reduction in that year as determined by the AER. The emissions reduction benefit in year t is given by:
The emissions reduction benefits have been valued here according to the interim VER determined by the AER, assuming the VER remains constant beyond 2050, in accordance with the Energy Ministers’ statement.[xiii] The value has been calculated out to 2052 to align with the end of the ISP modelling period and with current Regulatory Investment Tests for Transmission (RIT-Ts).[xiv] The values have been discounted using the same real, pre-tax discount rate of 7% used in the Draft 2024 ISP.[xv] The values are then aggregated and this net present value is added to a project’s total market benefits.
To assess the maximum effect that the inclusion of emissions reduction benefits in the regulatory investment framework could allow, this paper models a hypothetical project designed to eliminate all emissions from the NEM grid and motor vehicles. To isolate the impact of the emissions reduction benefit on electricity prices, the project is modelled ‘at the margin’ such that its costs are equal to only the benefits derived from the abated emissions.
The cost for this hypothetical emissions reduction project is annualised and passed on to electricity consumers, consistent with the standard practice for projects that form part of a network service provider’s regulatory asset base (RAB). This paper annualises the cost by calculating the payment required over the asset-life to repay the principal and pay a regulated return on the maximal investment. This follows standard practice for financing investments added to a network service provider’s RAB.
To gauge the impact on the average household, 5470 kWh is adopted as the typical annual household electricity consumption in this analysis, consistent with average household consumption data in the AER’s latest residential electricity and gas consumption benchmarks report.[xvi]
The assumption is that the project proponent succeeds in delivering the full reduction of carbon emissions they promise without changing costs outside of those assessed for the project. In cases where investments are predicated on assumptions or projections that require co-investments being made by other parties (such as by assuming further uptake of electric vehicles), or more difficult demand profiles being shifted to other generators (such as for remaining thermal generators), the extent of full costs borne by consumers will remain understated by this analysis since these costs and benefits are usually not captured by cost benefit analyses used in justifying regulated investments.
Calculating base case and investment case emissions
The ISP anticipates a scenario where the grid is predominantly powered by renewables and there is widespread adoption of electric vehicles (EVs). Consequently, this analysis compares two counterfactual scenarios: one where this transition — a renewables-dominant grid and mass EV adoption — occurs overnight and another where no action is taken, with the EV market penetration and grid emission intensity remaining constant. In essence, the emissions reduction benefits are quantified as the value of carbon abatement provided by an investment relative to the base case.
Accordingly, the investment case envisions a scenario where a hypothetical project successfully induces mass EV adoption overnight and eliminates grid emissions overnight. The base case reflects a scenario where no such project is implemented, resulting in change to neither grid emissions intensity nor the proportion of EVs in NEM jurisdictions over the modelling horizon.
While a base case could well assume declining emissions intensity or increasing EV penetration over the modelling horizon, such a base case still requires significant additional costs to enable the projected outcomes. For example, the ISP assumes mass adoption of consumer energy resources without incorporating them as system costs.[xvii] Undisclosed state government subsidies to maintain coal plants beyond what might be commercially optimal to ensure system reliability is another example.[xviii]
Furthermore, given that coal capacity closures are unlikely to occur as projected or announced until suitable replacements are secured, it is challenging to justify a base case that assumes sufficient replacements will appear without investments that add to the cost base. In fact, the introduction of the VER into the regulatory framework could provide a mechanism incentivise network service providers to invest in projects enabling the outcomes projected in the ISP. Therefore, exploring and costing the full potential impact of this mechanism is imperative.
Of course, it is not practical or realistic for all projects to be identified, approved and constructed overnight, and this analysis is not intended to imply it will happen. In reality, projects will be proposed and approved more slowly. We discuss the effect of shifting forward the hypothetical ‘overnight’ investment to abate emissions to 2030 or 2040 in a sensitivity analysis that follows our results below.
Results for maximum emissions reductions
Because emissions reduction comprises two components: grid and transport emissions, this paper estimates the effect of each component and then aggregates them to calculate the possible effect on consumers’ electricity bills.
Results for emissions reductions from a renewable grid
To estimate the maximum volume of emissions that can be abated from the grid, this analysis assumes a base case where the generation mix and emissions intensity remain constant out to 2052. Base case demand grows in line with Draft 2024 ISP projections, excluding demand from EVs as discussed in the EV emissions reduction section below. Base case grid emissions are therefore calculated by multiplying the projected annual electricity generation in the NEM by a constant emissions intensity of 489 g/kWh.[xix] As illustrated in Figure 2, base case emissions from electricity generation rise from 104 megatonnes in 2025 to 180 megatonnes in 2052.
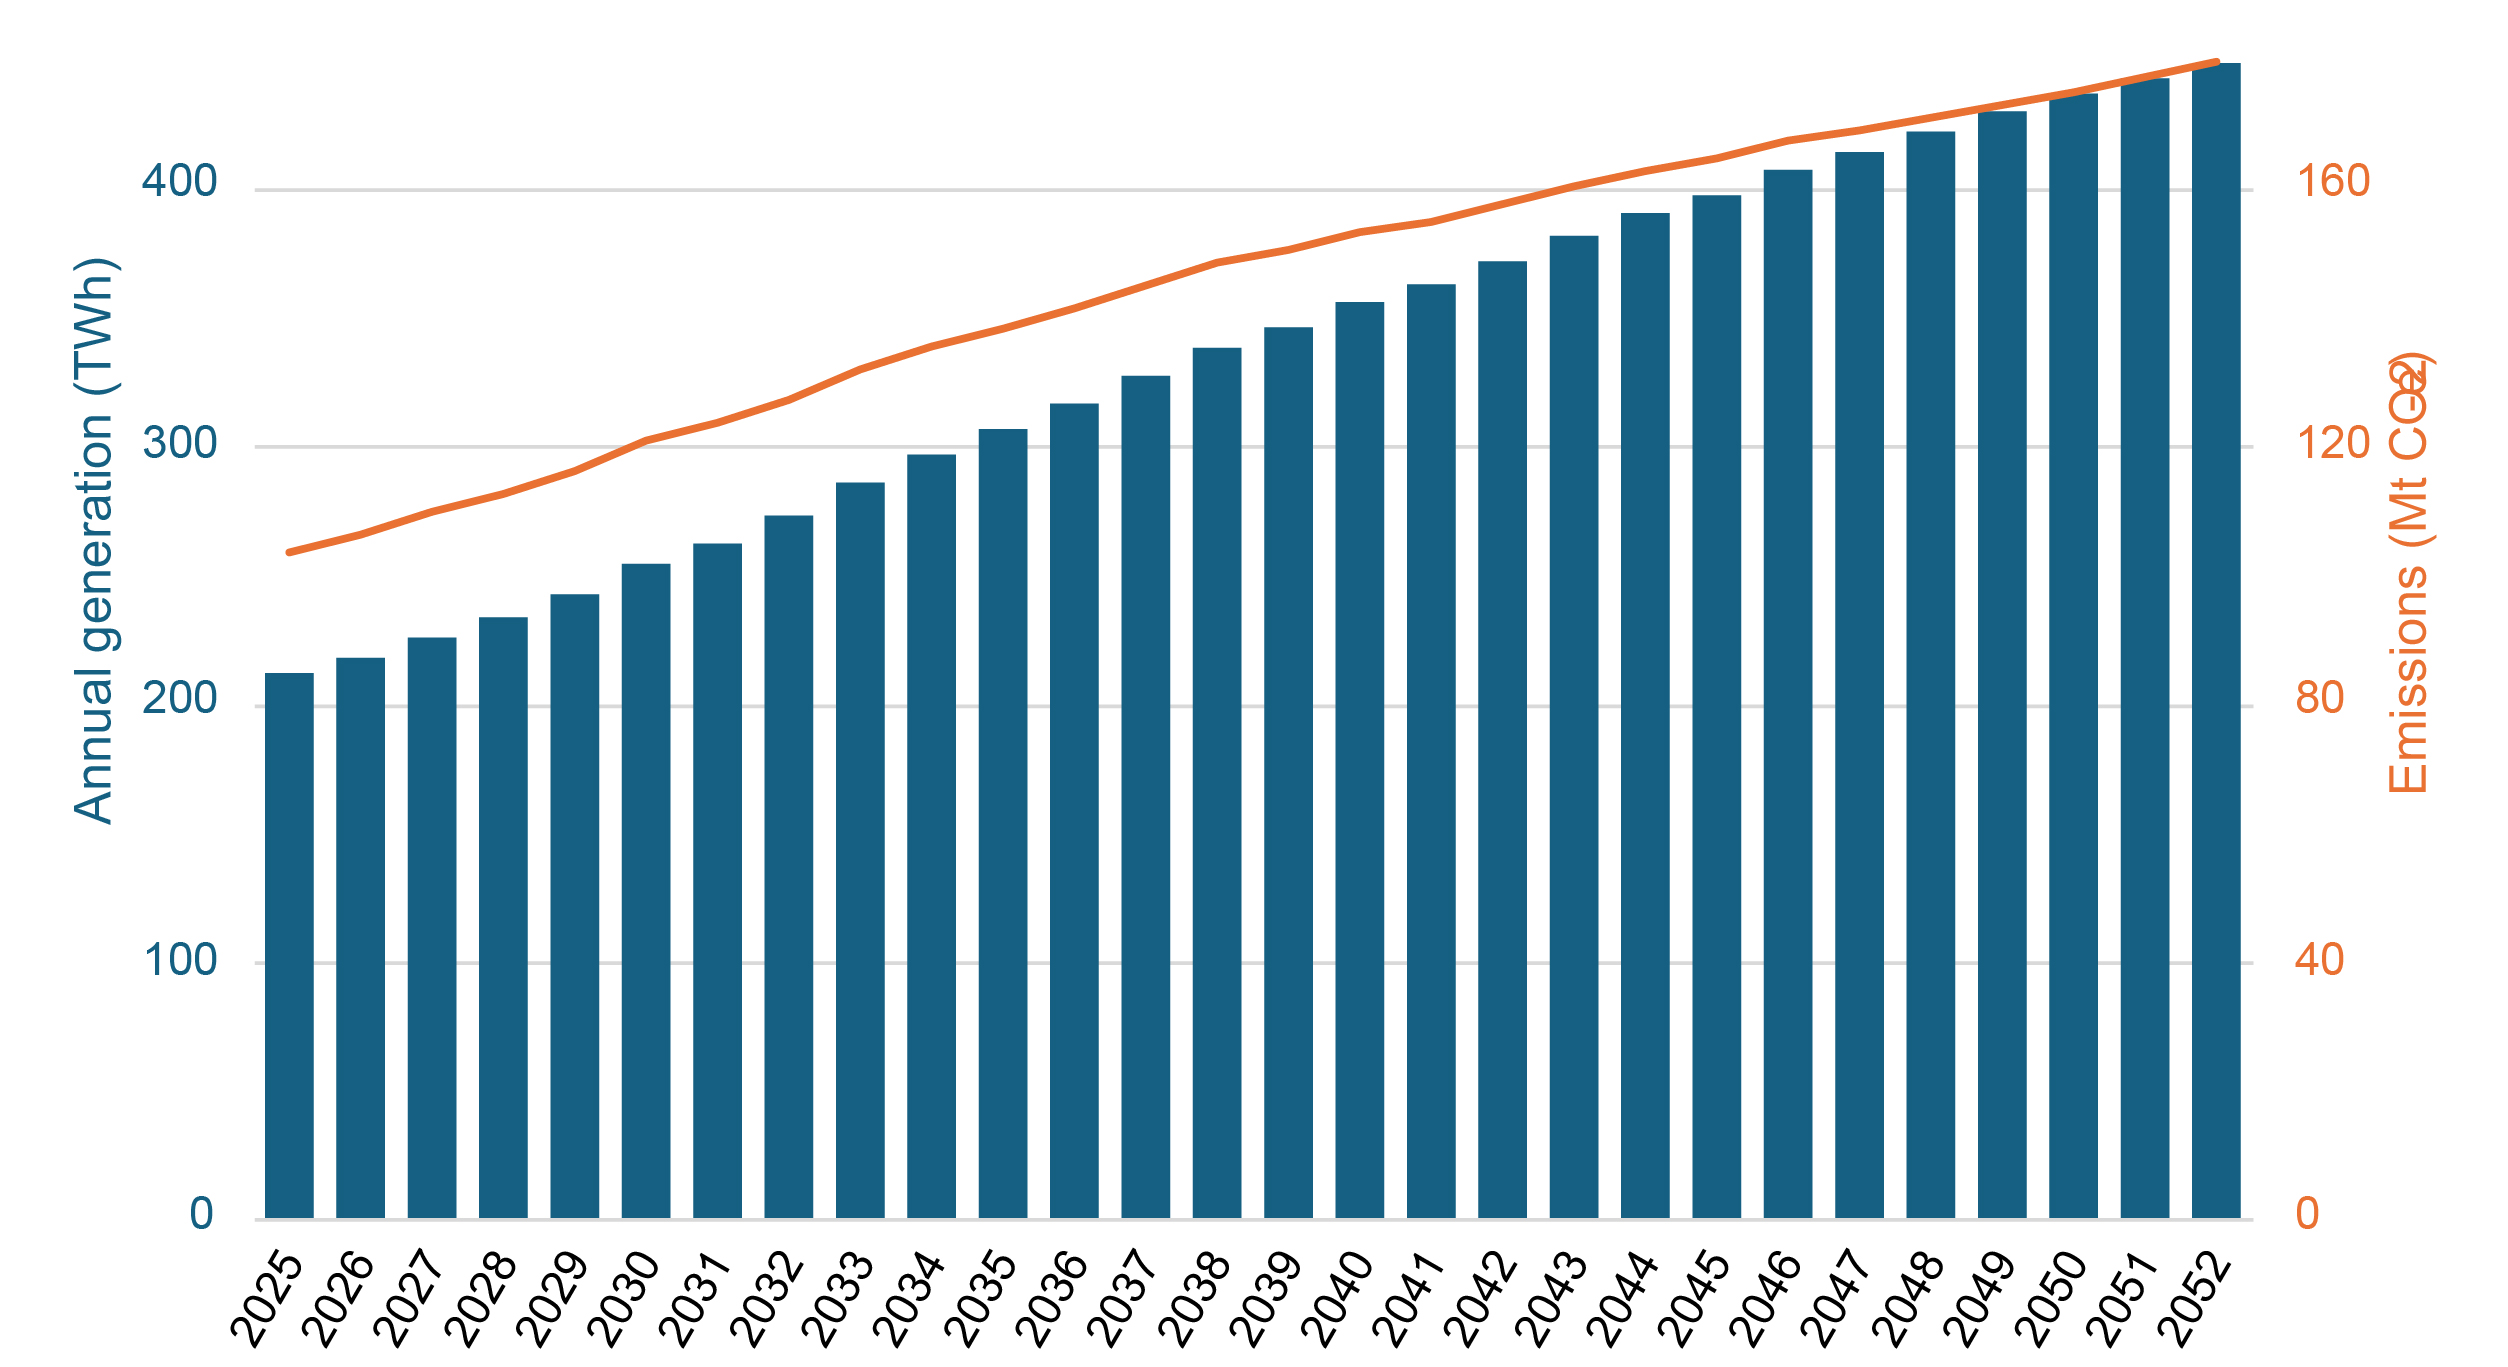
Figure 2. Projected annual electricity generation by the NEM from Draft 2024 ISP, with forecast emissions, assuming a fixed current emissions intensity.
The hypothetical investment enables a complete transition to renewable energy by 2025, thereby eliminating all grid emissions over the ISP’s modelling horizon. This is the area under the emissions line in Figure 2. The paper discusses the implications of additional EV demand on the grid, and how it models the potential for increased emissions, in the section on emissions reductions from EV adoption below.
Results for emissions reductions from EV adoption
To estimate the maximum volume of emissions that can be abated from transport, the analysis assumes a base case where electrification does not occur and an investment case where it occurs immediately.
The base case assumes the proportion of internal combustion engine (ICE) to electric vehicles remains constant and emissions increase in line with population growth. Motor vehicle emissions in this base case are shown in Figure 3 below. The analysis assumes the scope includes only the vehicles in NEM jurisdictions. Vehicle emissions data from the Department of Climate Change, Energy, the Environment and Water (DCCEEW)[xx] and population growth projections from the Australian Government’s Centre for Population are used to forecast the base case motor vehicle emissions.[xxi]
Note that in the base case, electricity demand (and grid emissions) would be lower than projected by the ISP — since motor vehicles are not electrified and do not add additional demand to the grid. Therefore, the analysis assumes demand in the NEM will follow the ISP projections under the ODP (Step Change) excluding the demand that is projected as a result of motor vehicle electrification. This reduces demand in 2052 from 449 TWh to 367 TWh.
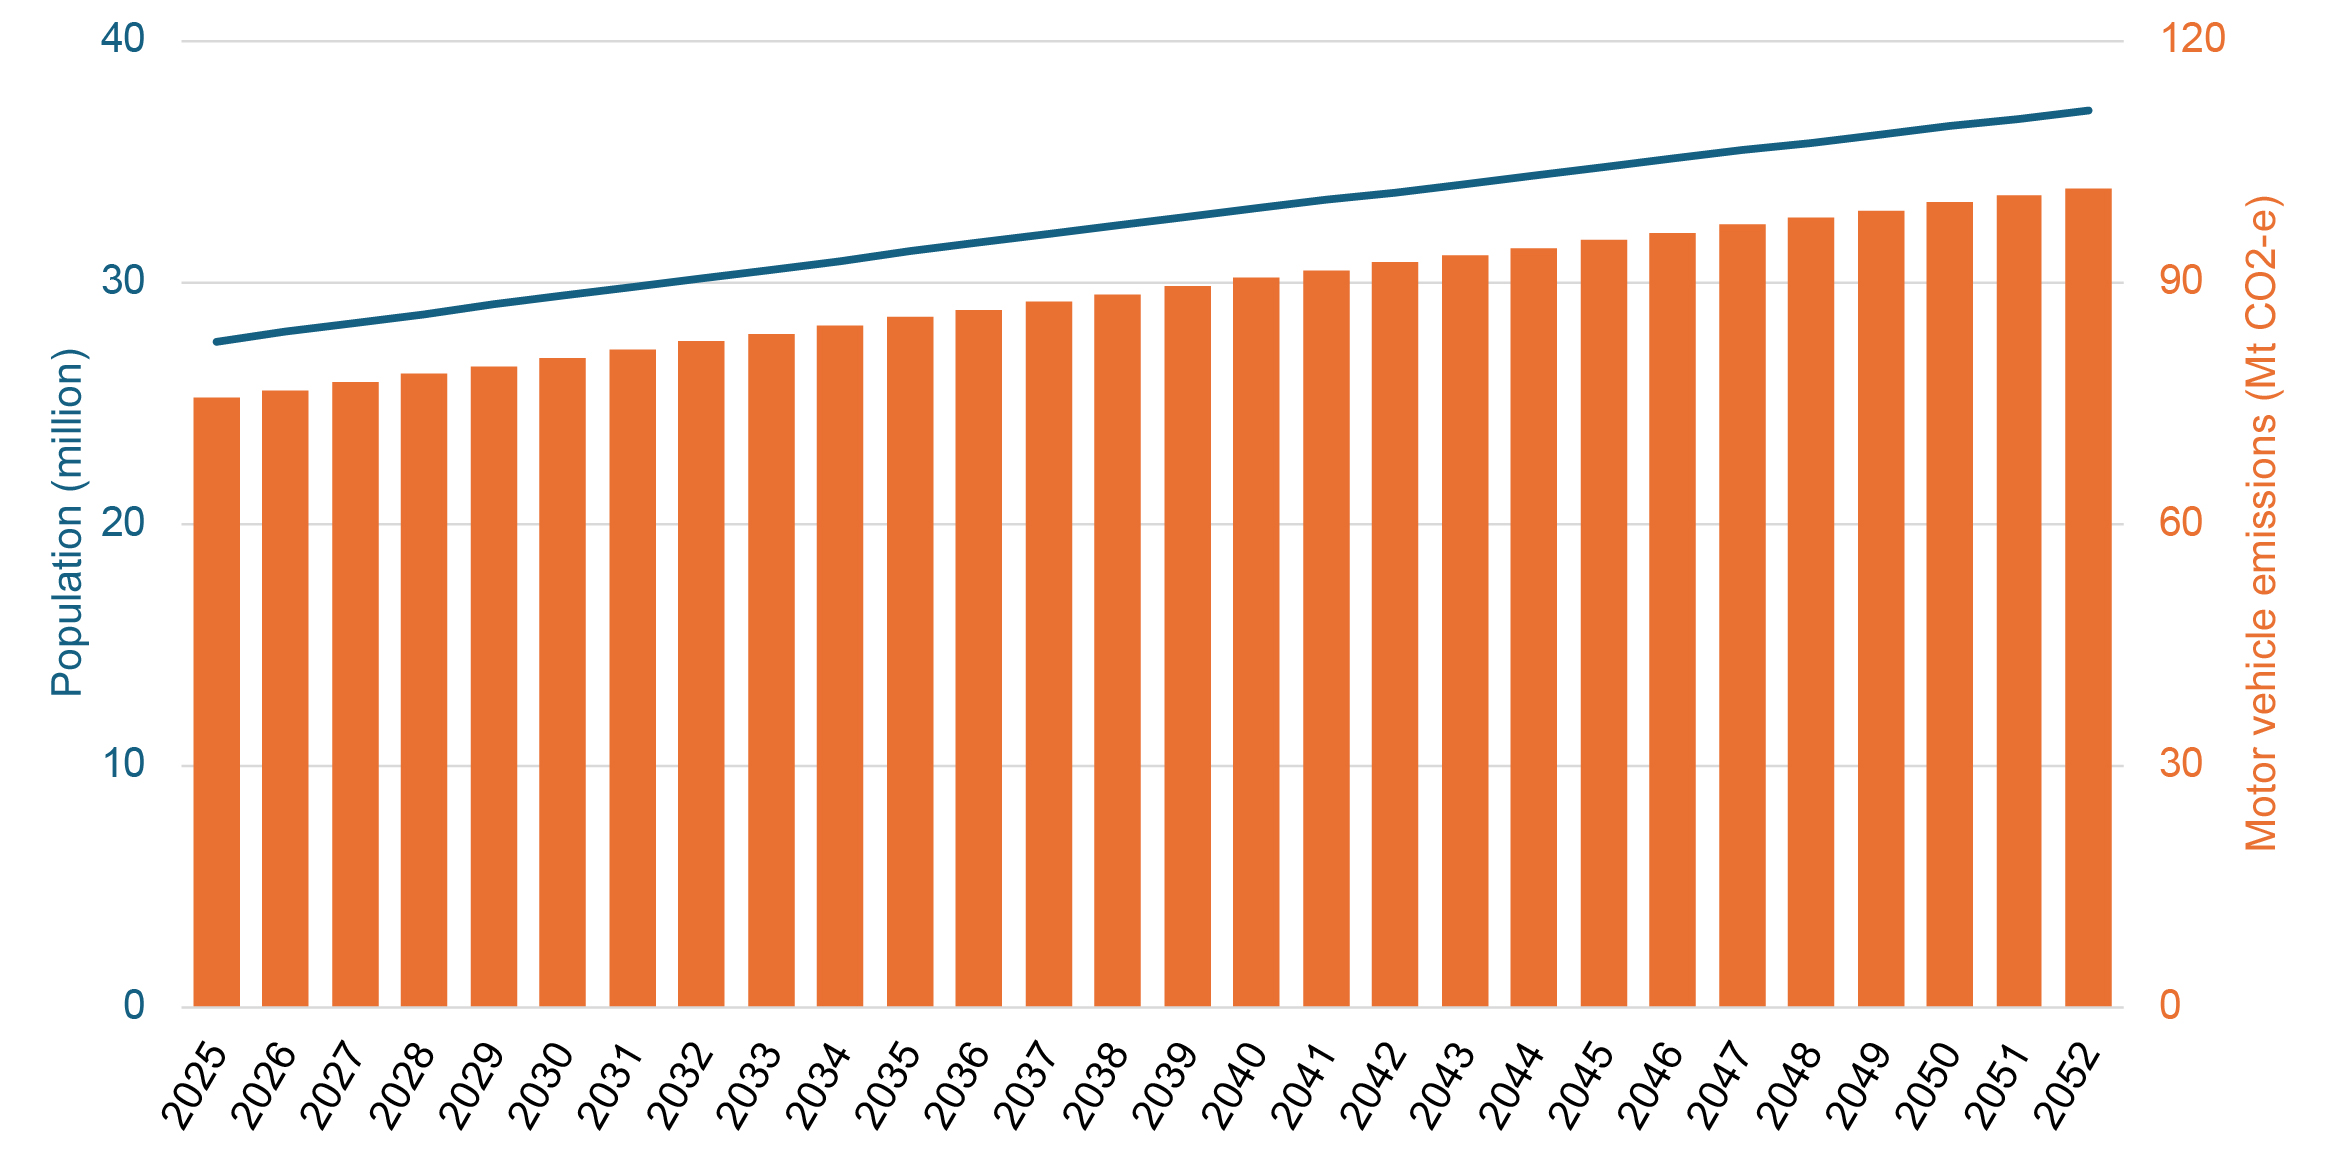
Figure 3. Projected national population and motor vehicle emissions in NEM jurisdictions for the base case scenario.
The investment case assumes immediate electrification of all ICE vehicles in NEM jurisdictions including cars, motorcycles, some trucks and buses. In this scenario, all motor vehicle emissions in the base case would be eliminated. However, complete adoption of EVs overnight would lead to a substantial surge in electricity demand, and in a world without the hypothetical investment case leading to a renewables-dominated grid this would lead to additional emissions. The additional demand is shown in Figure 4 below.
There is potential for the resulting demand on the grid to cause emissions which projects could claim the value from abating. This would likely be justified in order to achieve both complete motor vehicle electrification and a fully renewable grid. However, this would be a form of ‘double counting’. There is reason to believe that regulators may permit this, as they have done previously as shown in our paper, The six fundamental flaws underpinning the energy transition.[xxii] However, it is assumed the regulators will avoid such double counting. Increased demand in the investment case from additional EVs is therefore supplied by zero emissions sources already completely enabled by the system. The total emissions reduction associated with the rapid universal uptake of EVs therefore comprises only the (complete) abatement of ICE motor vehicle emissions. Regulators may also reasonably avoid double counting by some other method such as subtracting the expected grid emissions from the abated ICE emissions.
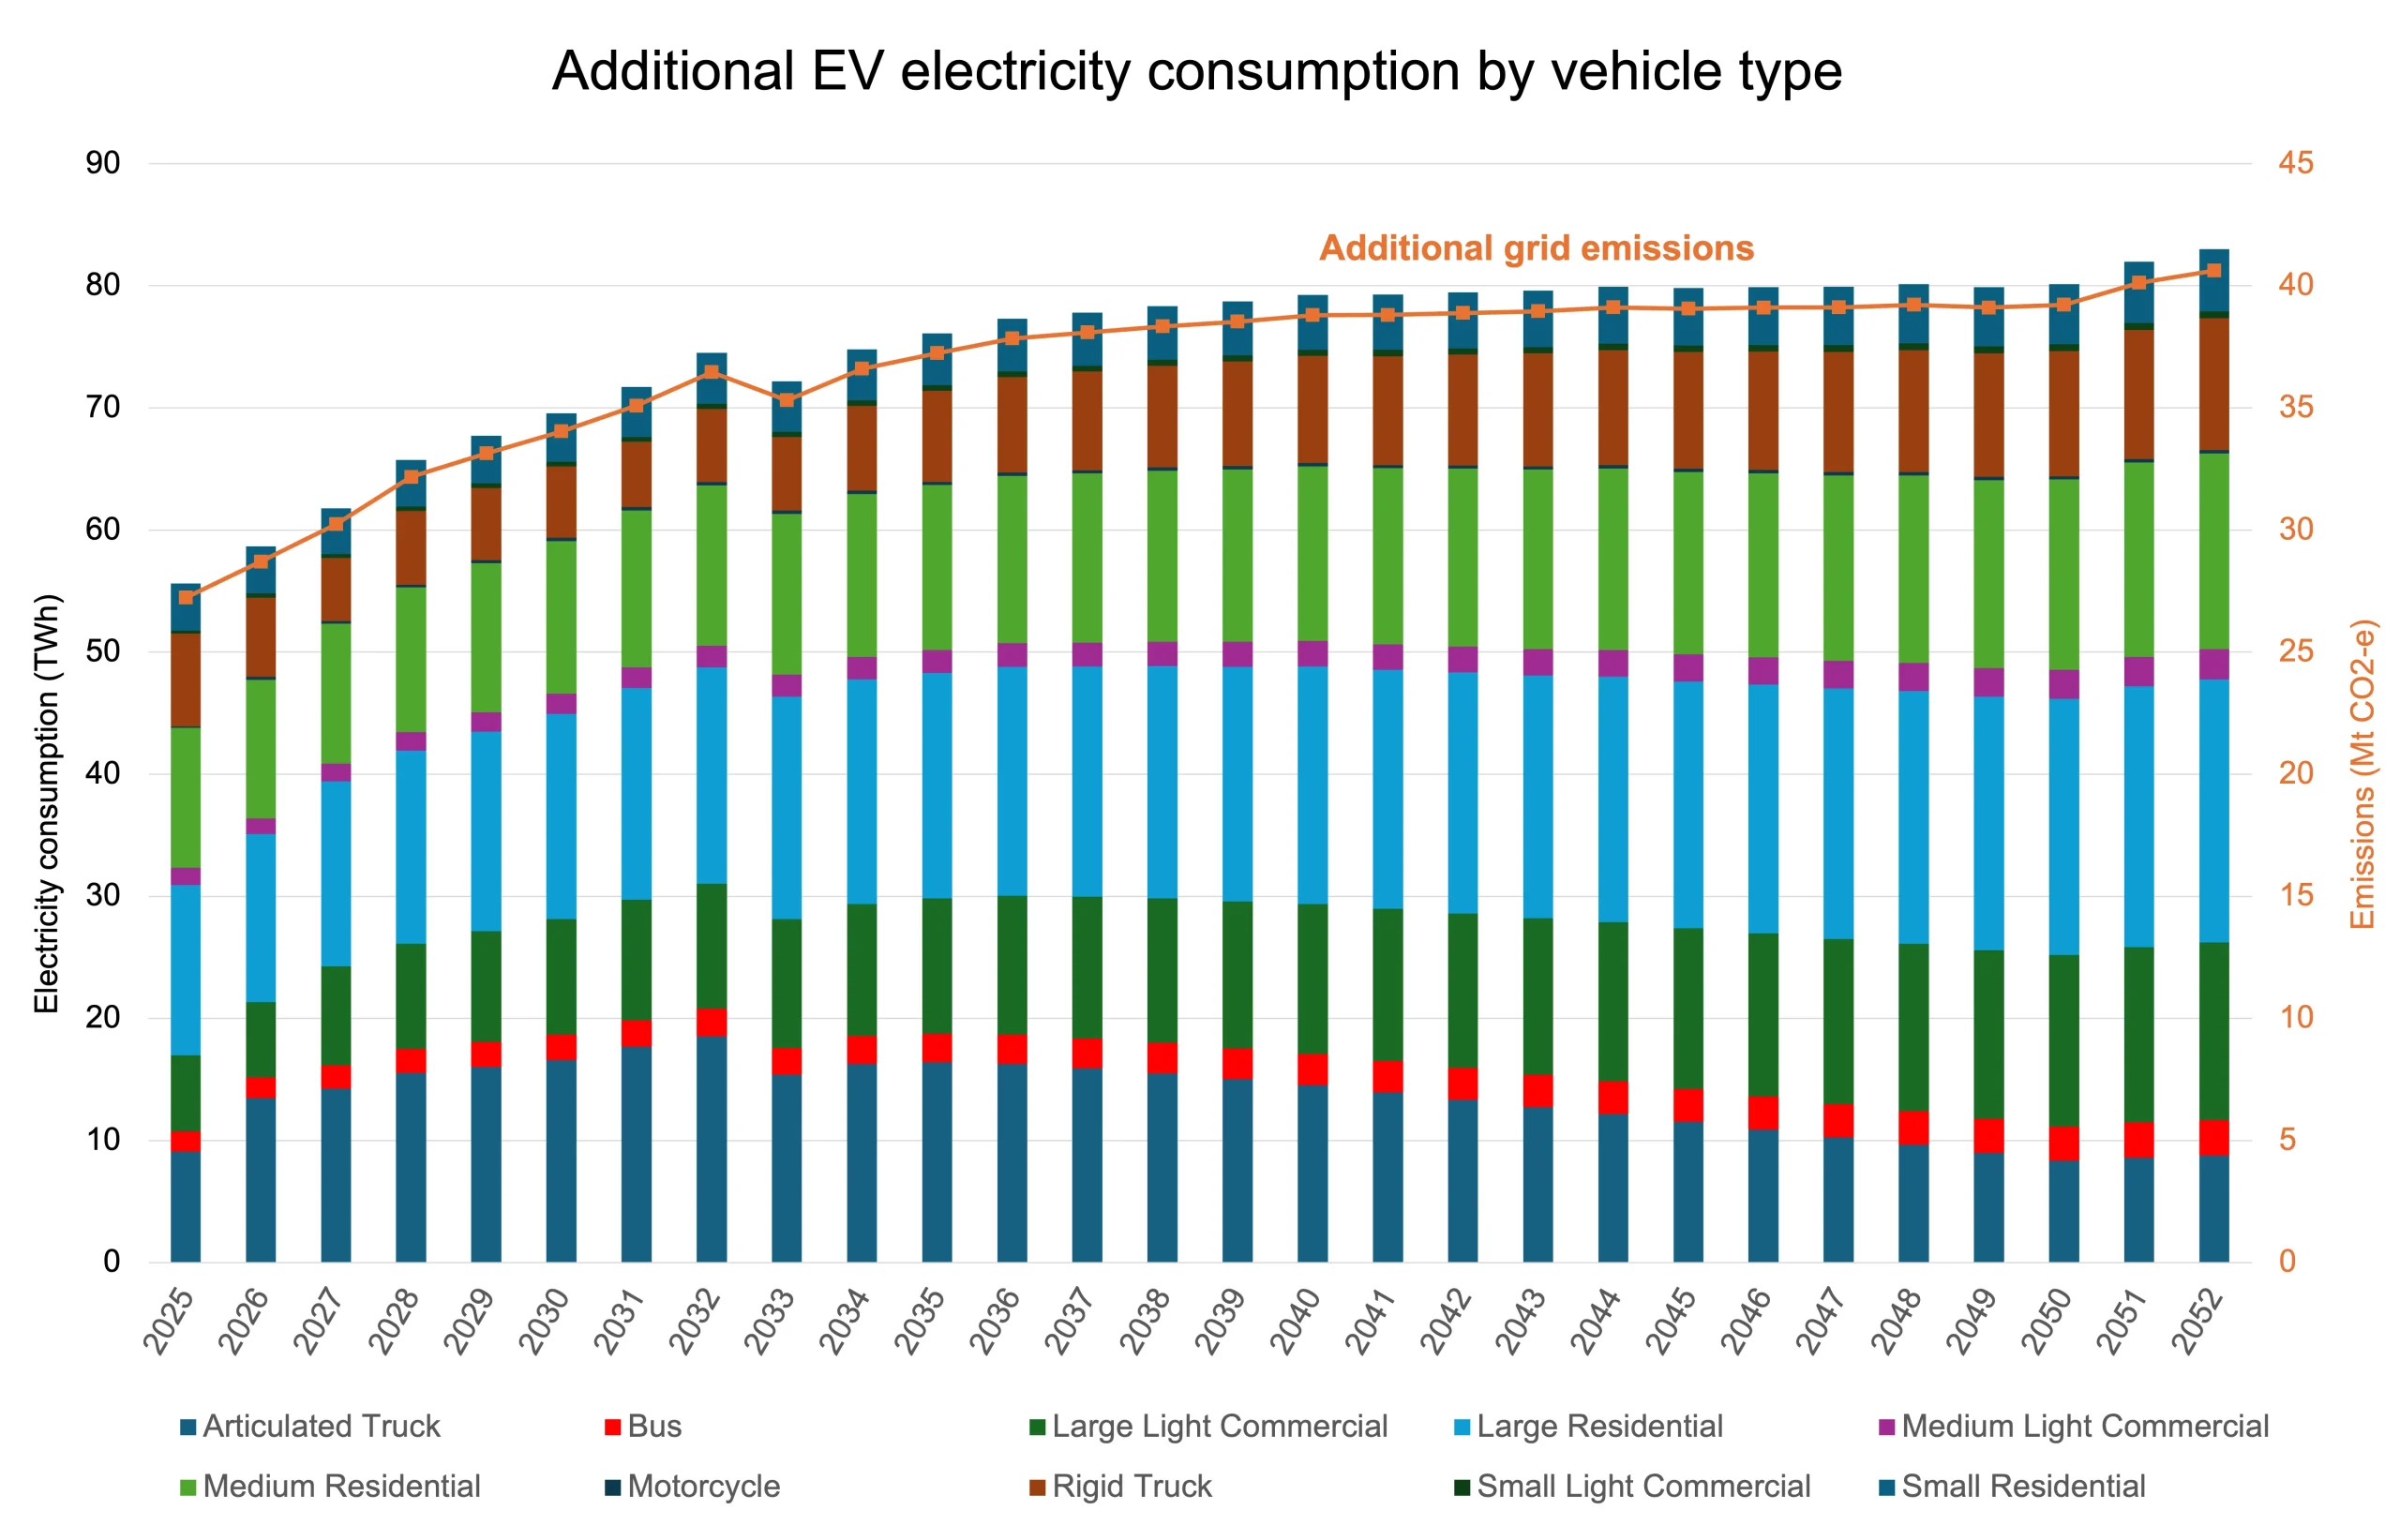
Figure 4. Projected additional electricity consumption and grid emissions from the electrification of all motor vehicles by 2025.
The maximum emissions reduction claimed through immediate widespread EV adoption increases from 76 megatonnes in 2025 to 102 megatonnes in 2052.
Results for the maximum impact on electricity bills
Impact on consumer power costs
In total, the benefits from abating all grid and motor vehicle emissions by 2025 are estimated to have a present value of $507.6 billion. This represents the maximum total emissions reduction benefits that network service providers are eligible to claim for their projects. The annualised cost of this would be $42 billion per year. Grid abatement represents $315.4 billion of this amount and motor vehicle emissions another $192.2 billion in present value. Annualised costs are $26 billion and $16 billion, respectively.
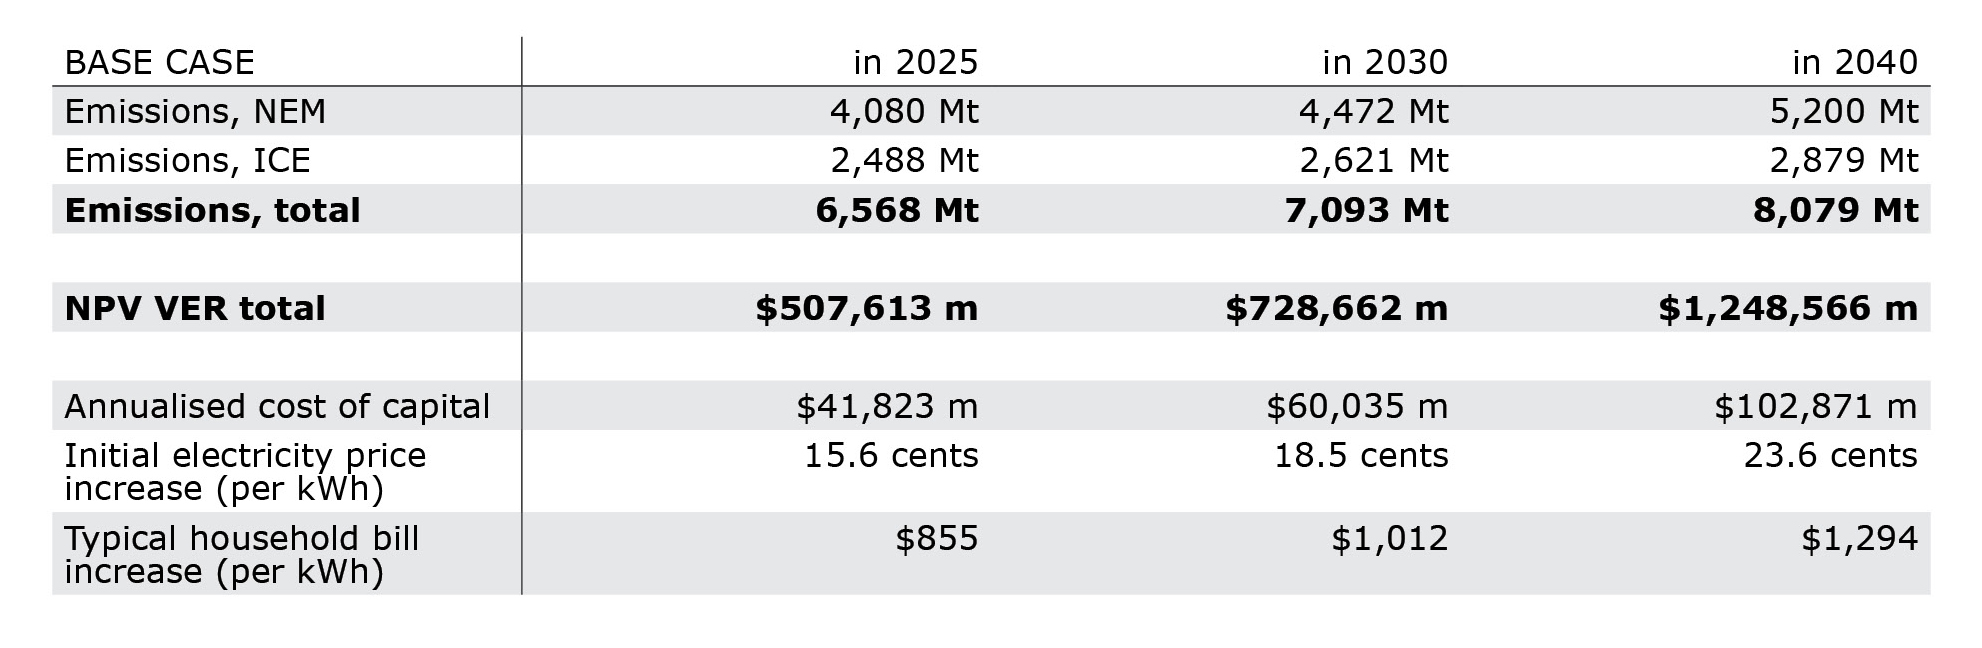
Table 1. Results and calculation inputs for 2025 and future years. Values are in 2023 $A unless otherwise stated.
By dividing the annualised cost by the total electricity generated by the NEM each year, it is estimated that the price of electricity could initially rise by as much as 15.6 cents per KWh before declining slightly as shown in the ‘2025’ series in Figure 5 below.
For a typical household consuming 5,470 kWh of electricity per year, a 15.6 c/kWh increase would result in an $855 increase to their annual bills.
This represents the maximum impact of incorporating the recent shadow carbon price into investment evaluations, in the hypothetical scenario that sufficient projects fully abate all the electricity and transport emissions to zero can be immediately identified, approved and completed. This demonstrates a significant potential increase in electricity costs for consumers at the outset which would gradually decline as total electricity production and consumption increases and dilutes the relative impact on bills.
A sensitivity analysis for approving projects later
The analysis so far focusses on a hypothetical project which is approved and delivered immediately. However, in reality the benefits of emissions reduction are likely to accrue to a number of projects over a period of time. These estimates indicate the costs for consumers could escalate even further as the VER increases rapidly. A hypothetical project completed in 2030 with no prior emissions reductions could see up to $729 billion in emissions reduction benefits, escalating to $1,249 billion by 2040.
The financial impact on electricity prices could be considerable — if all reductions are delivered in 2030, there is calculated a potential increase of 18.5 cents per kWh, amounting to an annual increase of approximately $1,012 in a typical household electricity bill. If all reductions are delivered in 2040, there is a potential increase of 23.6 cents per kWh, corresponding to an annual increase of approximately $1,294 in a typical household electricity bill. Each of these electricity price increases are shown below in Figure 5.
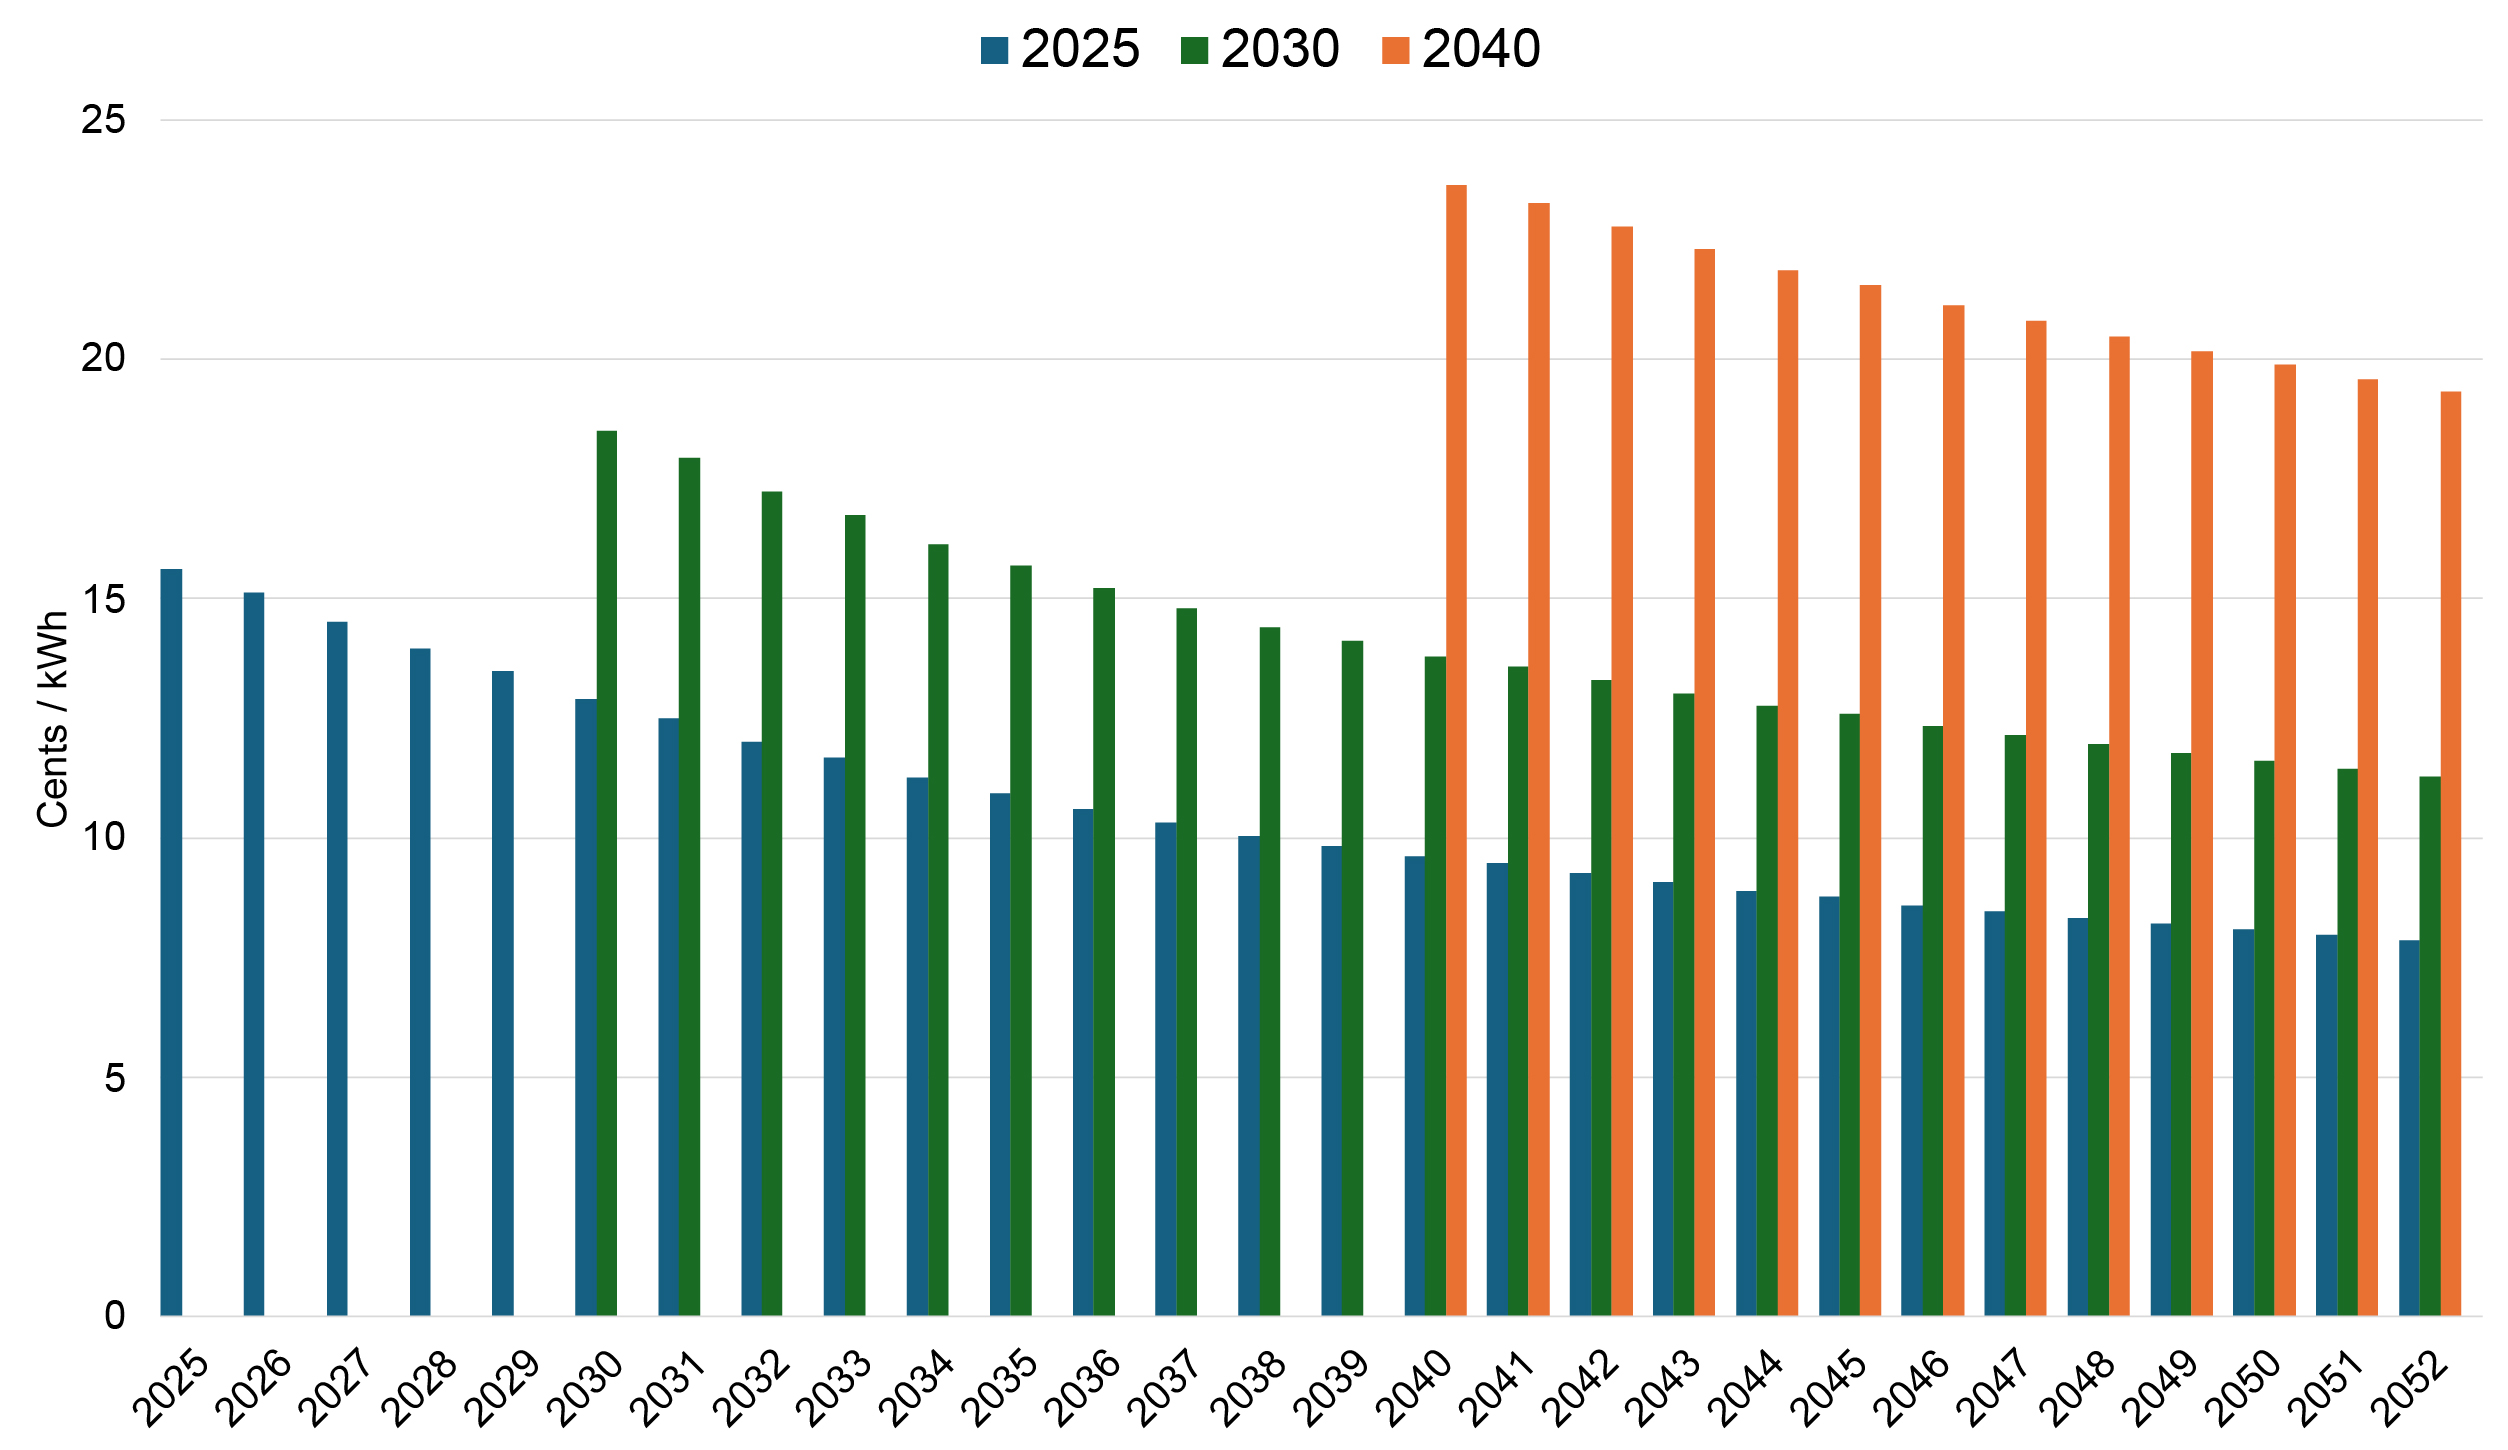
Figure 5. Maximum annual additional electricity cost (c/kWh) due to including emissions reduction benefits for projects built in 2025, 2030 and 2040, abating all electricity generation and motor vehicle emissions in NEM jurisdictions.
Conclusion
This analysis examined the potential impact of the introduction of a shadow carbon price through the interim VER on the cost of electricity for Australian consumers. The regulatory changes, aimed at integrating emissions reduction into the economic evaluations of electricity network investments, effectively license the approval of more infrastructure projects, driving up household electricity bills.
Substantial financial impacts are projected from these regulatory changes, with the potential approval of up to $508 billion worth of infrastructure projects in present value that under previous guidelines might not have been considered economically viable. The addition of more and larger projects to network service providers’ regulatory asset bases could increase electricity prices by up to 15.6 cents per kWh, or around $855 for a typical household electricity bill. Costs could be even higher in the future as the value of emissions reduction increases.
These cost increases are significant, and would have a material impact on household budgets at a time when many households are facing cost-of-living pressure. Government ministers have chosen to advance this shadow carbon price by inserting it into the heart of a complex regulatory process, effectively avoiding parliamentary scrutiny of the prices set. Network providers can use these values immediately for proposing projects, and which for some months yet can be applied using methods determined by AEMO without stakeholder consultation. The significance of the potential impacts on household bills should encourage a clear explanation of how this regulatory instrument was devised and how it is intended to be used in pursuit of reduced carbon emissions.
[i] AER, 2024. “Review of the cost benefit analysis guidelines and RIT application guidelines.” p 1. https://www.aer.gov.au/industry/registers/resources/reviews/2024-review-cost-benefit-analysis-and-regulatory-investment-test-guidelines.
[ii] AER, 2024. “Valuing emissions reduction AER draft guidance.” p 6.
[iii] DCCEEW, 2023. “Incorporating an emissions reduction objective into the national energy objectives.” https://www.energy.gov.au/energy-and-climate-change-ministerial-council/working-groups/energy-governance-working-group/incorporating-emissions-reduction-objective-national-energy-objectives.
[iv] AEMC, 2024. “Harmonising the national energy rules with the updated national energy objectives (electricity).” https://www.aemc.gov.au/rule-changes/harmonising-national-energy-rules-updated-national-energy-objectives-electricity.
[v] AER, 2023. “AER guidance on amended National Energy Objectives.” p 6. https://www.aer.gov.au/industry/registers/resources/guidelines/guidance-amended-national-energy-objectives
[vi] AEMC, 2024. “MCE statement about the interim value of greenhouse gas emissions reduction.” https://www.aemc.gov.au/sites/default/files/2024‑04/MCE%20statement%20on%20interim%20VER.pdf
[vii] AER, 2024. “Valuing emissions reduction AER draft guidance.” p 4.
[viii] Ibid.
[ix] AER, 2023. “AER guidance on amended National Energy Objectives: Guidance Note.” p 9. https://www.aer.gov.au/industry/registers/resources/guidelines/guidance-amended-national-energy-objectives.
[x] AER, 2024. “Valuing emissions reduction AER draft guidance.” p 6.
[xi] AER, 2024. “Valuing emissions reduction AER draft guidance.” pp 10-11.
[xii] AER, 2023. “AER guidance on amended National Energy Objectives: Guidance Note.” p 9.
[xiii] AEMC, 2024. “MCE statement about the interim value of greenhouse gas emissions reduction.”
[xiv] AEMO, 2023. “Draft 2024 Integrated System Plan Appendix 6: Cost Benefit Analysis”. p 14. https://aemo.com.au/-/media/files/stakeholder_consultation/consultations/nem-consultations/2023/draft-2024-isp-consultation/appendices/a6-cost-benefit-analysis.pdf.
[xv] AEMO, 2023. “Draft 2024 ISP Consultation”. We estimate the emissions reduction benefits of projects over a 28-year modelling period, for instance from 2024-25 to 2051-52.
[xvi] AER, 2020. “Electricity and gas consumption benchmarks for residential customers 2020”. https://www.aer.gov.au/industry/registers/resources/guidelines/electricity-and-gas-consumption-benchmarks-residential-customers-2020.
[xvii] For an extensive discussion of the ISP’s exclusion of residential generation and storage costs from their modelling of the total system cost of Australia’s energy transition, among several other critical shortcomings, see Morrison et al, 2024. “The six fundamental flaws underpinning the energy transition”. Centre for Independent Studies. https://www.cis.org.au/publication/the-six-fundamental-flaws-underpinning-the-energy-transition.
[xviii] Peter Hannam, 2024. “NSW to announce life extension of Eraring, Australia’s largest coal-fired power station”. The Guardian. Accessed on 7 May 2024. https://www.theguardian.com/australia-news/2024/apr/30/eraring-coal-fired-power-station-nsw-life-extension
[xix] AEMO, 2023. “Draft 2024 ISP Consultation”. https://aemo.com.au/consultations/current-and-closed-consultations/draft-2024-isp-consultation. The electricity generation forecast is based on the Optimal Development Path (ODP) in the ISP’s Step Change scenario. The 489 g/kWh emissions intensity is calculated by dividing the projected grid emissions by the electricity generation in 2024-25. Note that the Draft 2024 ISP modelling horizon covers an outlook period until 2051-52, although outcomes until 2049-50 only are presented in the ISP report and appendices. Furthermore, to assess emissions reduction benefits for projects delivered in 2030 and 2040, we applied the annual growth rate of electricity consumption in 2052 (1.42%) to years beyond 2052.
[xx] DCCEEW, 2023. “Australia’s emissions projections 2023: Chart data”. https://www.dcceew.gov.au/climate-change/publications/australias-emissions-projections-2023.
[xxi] Centre for Population Projections, 2023. “Population Statement 2023, national projections, 2022-23 to 2033-34”. https://population.gov.au/data-and-forecasts/projections; Centre for Population Projections, 2023. “2023 Intergenerational Report: population projections, Australia, 2022-23 to 2062-63”. https://population.gov.au/data-and-forecasts/projections.
[xxii] Morrison et al, 2024. “The six fundamental flaws underpinning the energy transition”. Centre for Independent Studies. https://www.cis.org.au/publication/the-six-fundamental-flaws-underpinning-the-energy-transition
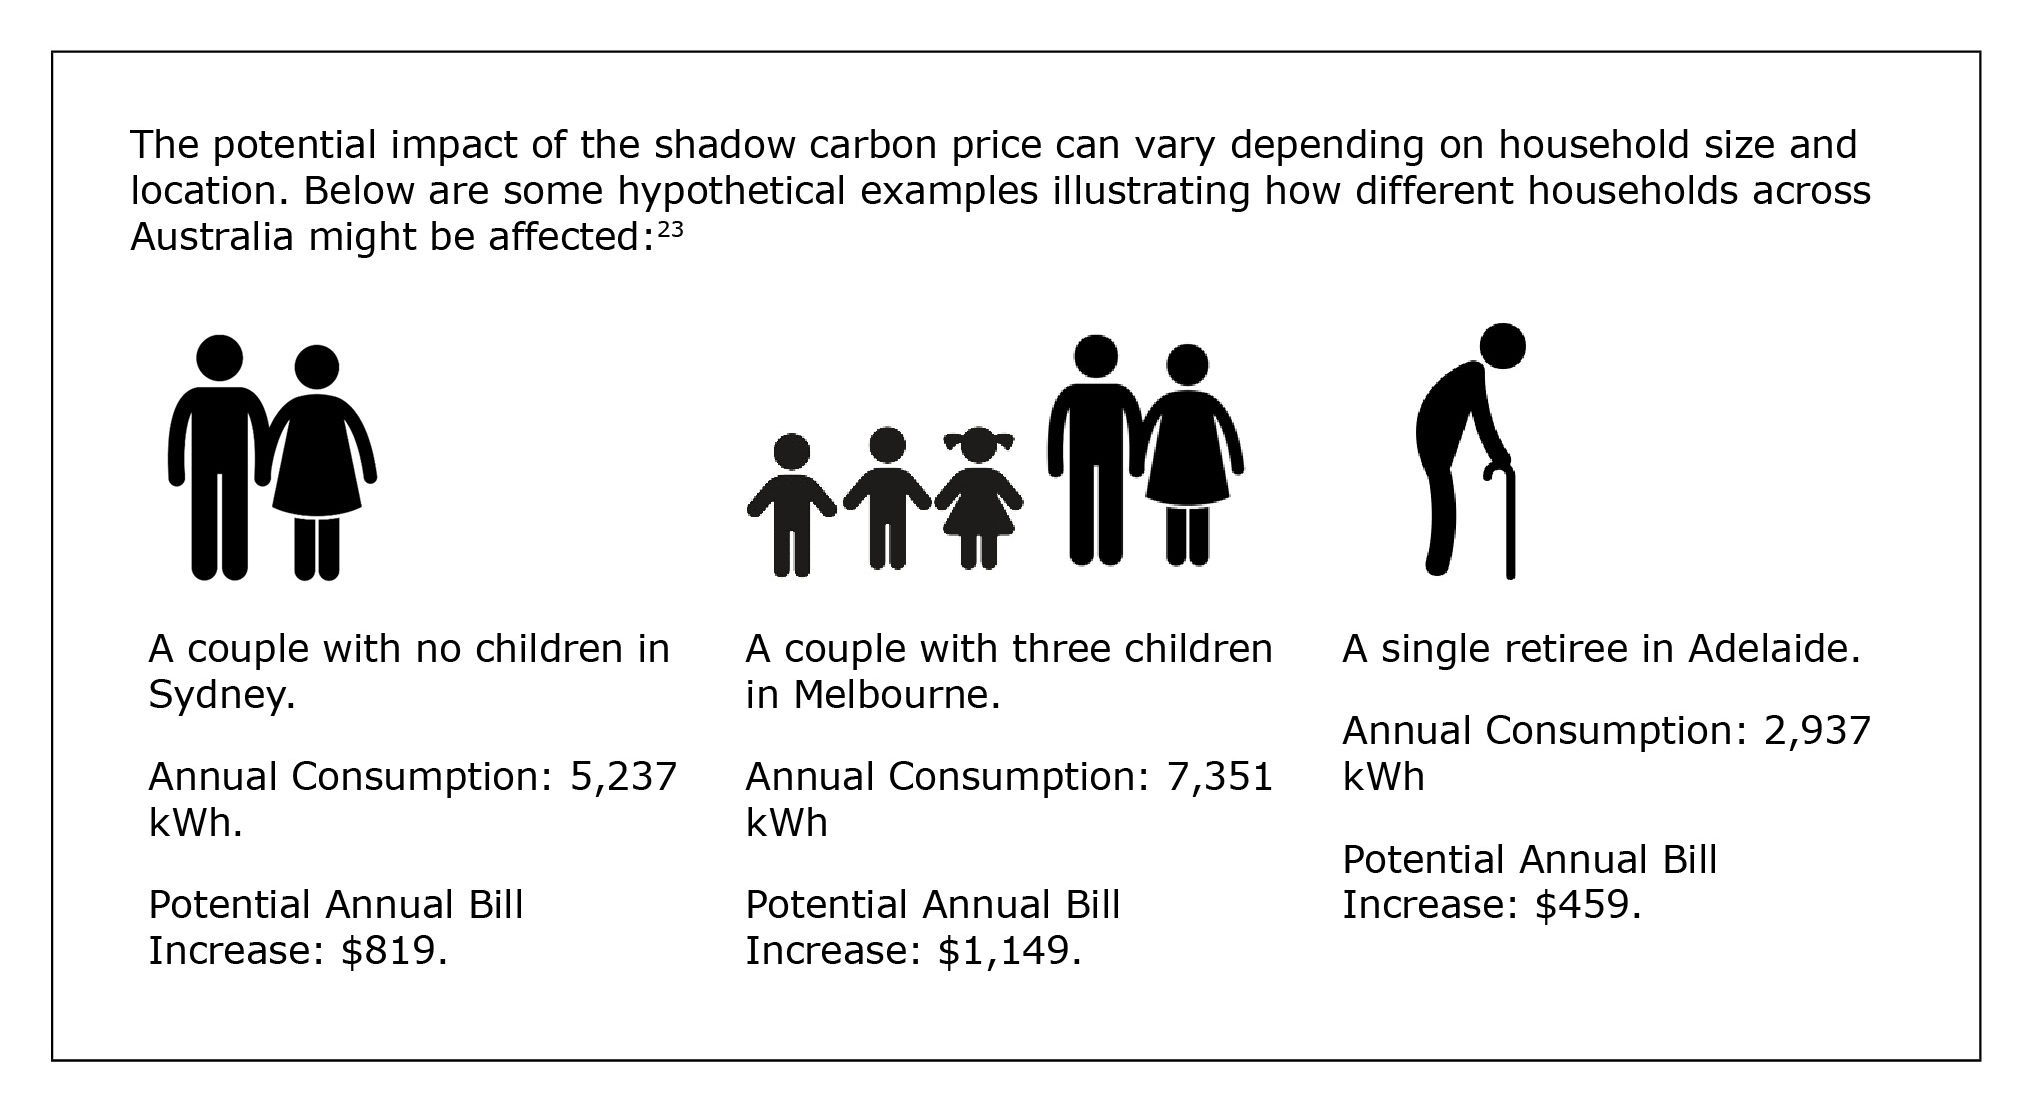
[xxiii] These hypothetical examples are based on AER’s latest residential electricity and gas consumption benchmarks report. See AER, 2020. “Electricity and gas consumption benchmarks for residential customers 2020”.


Australia is a country rightly proud of its heritage. We preserve convict sites, historic homesteads...