
Contents
4.1 Introducing the local demand saturation model 13
4.2 Establishing the ski-jump cost curve. 14
4.3 Upper-bound is 60%: The sum of capacity factors. 17
4.4 Lower bound is 30%: The average of capacity factors. 18
4.5 Exploring credible correlation: 40%.. 19
4.6 Exploring profile imbalance: 32%.. 20
4.7 Real-world grid constraints end the honeymoon earlier. 21
5.1 The rising costs of wasting and moving energy through space and time. 22
5.1.1 Curtailment: Rooftop solar challenges. 22
5.1.2 Moving through time: Batteries. 24
5.1.3 Moving through space: Rising transmission costs. 25
5.2 Additional challenges with scaling up renewables. 28
5.2.1 Diminishing returns for wind sites. 28
5.2.2 Delayed coal retirements. 29
5.2.3 Increasing grid stability costs. 30
5.3 Investors respond to honeymoon ending. 31
5.3.1 Falling capture prices for wind and solar projects. 31
5.3.2 Declining renewables investment in Australia. 33
5.4 Government efforts to prolong the honeymoon. 36
5.4.1 Capacity Investment Scheme expansion in size and scope. 36
5.4.2 Off-budget spending on clean energy public investment vehicles. 37
1. Executive Summary
The belief that Australia can decarbonise its economy by relying on the wind and the sun rests on a misplaced conviction about what the renewables rollout will entail. The idea that our previous accomplishments should encourage further persistence depends on the presupposition that the transition to renewables benefits from gathering momentum. Advocates point to the increase in wind and solar from 1.5% of our electricity share in 2010 to around 33% today as a success, and evidence that the buildout can be further accelerated to achieve nearly twice this rollout in one-third the time, to meet targets set for 2030.
This assumption is flawed. The intrinsic nature of uncontrollable, weather-dependent energy introduces faster growth in costs at higher penetrations, which mean the rollout gets harder as it proceeds, rather than easier. What we have experienced thus far is the renewable energy ‘honeymoon’ period, during which things were unnaturally simple. The true nature of the longer journey is one of formidable challenges, which we are only beginning to encounter.
This paper explores the nature of these challenges in three different ways.
It first examines the international evidence of the relationship between electricity prices and weather-dependent generation. An undeniable trend has emerged. No country has reached wind and solar penetration levels above 90%, and those that come closest have some of the highest electricity costs in the world. Very few countries have exceeded around 40%, and those that do end up with elevated electricity prices. This challenges the idea that renewable energy integration is only a ‘last mile’ problem, i.e. that storage and firming challenges only become more difficult at penetrations above 90%.
Second, it undertakes a first-principles exploration of what drives higher integration costs for uncontrollable wind and solar electricity generation, which is gathered from the places and times in the environment where it appears in accordance with the weather and the earth’s orbit and rotation. Clear-cut mathematical boundaries can be established around when additional costs must be incurred, as determined by the local demand saturation point. At this point, an increasing share of new uncontrollable generation must be either wasted or moved through time or space to continue displacing thermal, controllable generation. In an idealised model, Australian wind and solar generation must reach this point between 30% and 60%, but many real-world constraints make earlier onset inevitable.
Finally, it outlines the evidence in Australia that these additional costs are already being encountered, at renewable energy penetration levels at or below 30%. The demand for massively expanded transmission networks, battery storage, and high levels of constrained generation demonstrate clearly that increasingly more energy must be either moved or wasted, and the costs associated with these additional systems to move energy will only continue to mount. Other factors, such as the exhaustion of ideal wind and solar sites, and the growing backlash from regional communities, will cause other costs to increase as well. As falling capture prices lead to declining private investment in renewables, governments are now attempting to prolong the honeymoon period through subsidies and taxpayer underwriting, which will greatly increase the tax burden on Australians and do nothing to lower electricity prices in the long term.
Rather than continuing to insist that renewable energy is about to cross some threshold where things become magically easier, and costs reduce, Australian politicians and renewables advocates must confront the inevitable. The honeymoon is over and, from here on, things will only get harder. A serious rethink of our commitment to pursue current policy at any cost is urgently required.
2. Introduction
Much of Australia’s energy debate is explicitly or implicitly reliant on the idea that the rollout of renewable energy is gaining momentum. In September 2024, Climate Change Authority Chair Matt Kean referred to the doubling of renewable energy between 2015 and 2022, saying this should “give us confidence in the path we have chosen”.[1]
A range of different authorities and advocacy groups frequently refer to previous progress as an argument for continuing in the same direction. In a November 2024 speech spruiking renewables, Energy Minister Chris Bowen said, “We’ve built a lot of momentum. But the job is far from done. The key is to build on this momentum, and build more.”[2] Similarly, the pro-renewables Australian Conservation Foundation has stated, “The momentum is with us. Australia is already on track for renewables to provide most of our energy this decade. We must keep going”.[3] Likewise, a recent Climate Council report states, “Progress on building clean energy has been so rapid in recent years that it can be hard to keep up, but it’s all around us here and now… All our biggest states — NSW, Victoria and Queensland — are building on this momentum by strengthening their renewable energy targets”.[4]
The concept of building momentum has also been key to Australia’s earlier public policy decisions which have driven the uptake that we have seen to date. Kevin Rudd justified the expansion of the Renewable Energy Target to 20% by 2020, saying “an interim renewable energy target will accelerate their use, driving cost reductions by encouraging economies of scale.”[5] Supported by such generous government subsidies, variable renewable energy’s share of electricity generation in Australia climbed dramatically, from 1.5% at the start of 2010 to around one third by 2024.[6]
If there wasn’t an expectation that at some future point adopting renewable energy would become easier, the expenditure of public funds, or imposition of mandates adding to consumer costs, would be far harder to justify.
However, a number of emerging facts sit at odds with the idea of gathering momentum behind the proposed transition. In 2025, the federal government failed to deliver the promised $275 bill reductions.[7] Countries around the world with high levels of wind and solar experience higher bills. And our own rollout has slowed, with new subsidy schemes being required to replace older ones, rather than costs falling and market confidence building and subsidies being phased out.
Australian Energy Regulator (AER) Chair Clare Savage has warned of a “wall of capex” coming at consumers from distribution network augmentations, which “will be baked in not just for today but for many years to come” and “could more than offset the lower costs of wholesale energy as we make the switch to renewables unless we find ways to be more efficient”.[8]
The truth is that, as the proportion of weather-dependent energy in the grid grows, the costs and difficulties of integrating this energy also grow at an increasing rate due to its intrinsic nature, which this paper seeks to explore.
The idea that there is a certain level of wind and solar penetration that is uneconomical is not controversial. Even CSIRO’s GenCost, which lauds renewables as having the lowest cost range of any new electricity generation, acknowledges that the last few percent of production is most economically delivered by open-cycle gas turbines.[9]
However, many energy authorities and renewables advocates argue that well above 95% of energy can be met by weather-dependent sources before the challenges of integrating them to meet demand become acute. The Institute for Energy Economics and Financial Analysis (IEEFA) has cited GenCost in its claim that “it has already been established that renewables are the cheapest form of new power, so the cost to consumers in the long run should be minimised under scenarios that work towards 100% renewable energy supply”.[10] This represents a false equivalence, as IEEFA equates wind and solar generation being cheap with system costs under a wind-and-solar-dominated grid also remaining cheap.
Similarly, renewable energy engineer David Osmond has claimed his simulation shows “very close to 100% renewable electricity is feasible for Australia’s NEM at reasonable cost using just several hours of battery storage”.[11] Despite his modelling ignoring key constraints such as transmission capacity and losses, it has been cited by Climate 200 Convenor Simon Holmes à Court[12] and Renew Economy editor-in-chief Giles Parkinson in support of a renewables-dominated grid.[13] AEMO’s Integrated System Plan is also used as evidence by renewables advocates that a grid relying on more than 95% renewables is the cheapest option[14] despite the fact that the ISP exclusively models government targets and contains several major flaws (e.g., not including all system costs, such as consumer energy resources and distribution network upgrades).[15]
This idea that wind and solar energy integration is relatively straight forward up until the final few percent of the grid sits at odds with the challenges Australia and many other countries are facing, with costs rising rapidly at much lower penetration levels.
This paper attempts to address this question directly: At what point does the further integration of renewable energy become much more difficult? Is it a ‘last mile’ challenge, where only the last few percent is a significant problem? Or is it something closer to a ‘honeymoon’ period, where just a limited stretch at the beginning is very easy, and it’s only uphill from there? The paper seeks to investigate this question in three different ways.
First, it explores the international experience of renewable energy rollouts, to substantiate the claim that electricity prices tend to increase with more wind and solar.
Second, it provides a first-principles analysis of what drives the inescapable costs required to integrate high levels of weather-dependent energy. At some point, more systems (e.g., batteries, gas peakers, transmission) must be added to the grid to move solar and wind energy around the country, clock, or calendar, or this excess energy must be wasted. This places clear bounds on the threshold under which some costs must kick in.
Finally, it looks at the evidence emerging in Australia, which confirms that some of these costs are already being encountered and are set to ramp up quickly from here.
We conclude that wind and solar rollouts benefit from a honeymoon period, rather than a gathering of momentum. The honeymoon ends somewhere between 20% and 30%. Increasing wind and solar penetration is easy at the start, and inevitably gets much harder the higher you go.
This contradicts the popular narrative about growing momentum. Renewables advocates maintain that the current economic and engineering hurdles are temporary and surmountable.[16] Policies viewed as distracting or delaying from this perceived inevitability are often dismissed as misguided.[17] This mindset depends on the conviction that the trajectory ahead is continuing on a smooth, downhill glide path.
But this understanding of electricity systems is deeply mistaken. The path ahead climbs uphill, ever more steeply. What we have previously experienced was easy in comparison to what we will experience if we charge ahead, and should give us reason to reconsider the current renewables-dominated plan.
Australia stands at a critical inflection point. The easy, low-hanging fruit has already been harvested. Achieving higher levels of renewable penetration will only become more and more costly and complex. The renewables honeymoon is over and the presumption that higher penetrations of renewables will deliver lower prices must be abandoned. An urgent re-think of current energy policy is vital.
3. International Experience: The honeymoon ends at 20%
Countries around the world that have proactively pursued a wind and solar generation rollout share a similar trajectory. International data reveals a strong correlation between higher shares of wind and solar generation and rising electricity prices. Across the entire sample of countries for which electricity price and energy data are available, average household electricity prices climb significantly as the combined share of wind and solar generation increases (Figure 1).
Countries with less than 21% wind and solar generation have moderate electricity prices — around US $0.15/kWh on average. However, at intermediate levels of between 21% and 33% wind and solar share, average prices rise to approximately US $0.24/kWh. Among the small group of countries that exceed 33% wind and solar generation, household electricity prices escalate, averaging US $0.37/kWh. In 2024, Australia hit a wind and solar penetration of 32.4%, so 2025 is likely to see Australia exceed 33% wind and solar.[18]
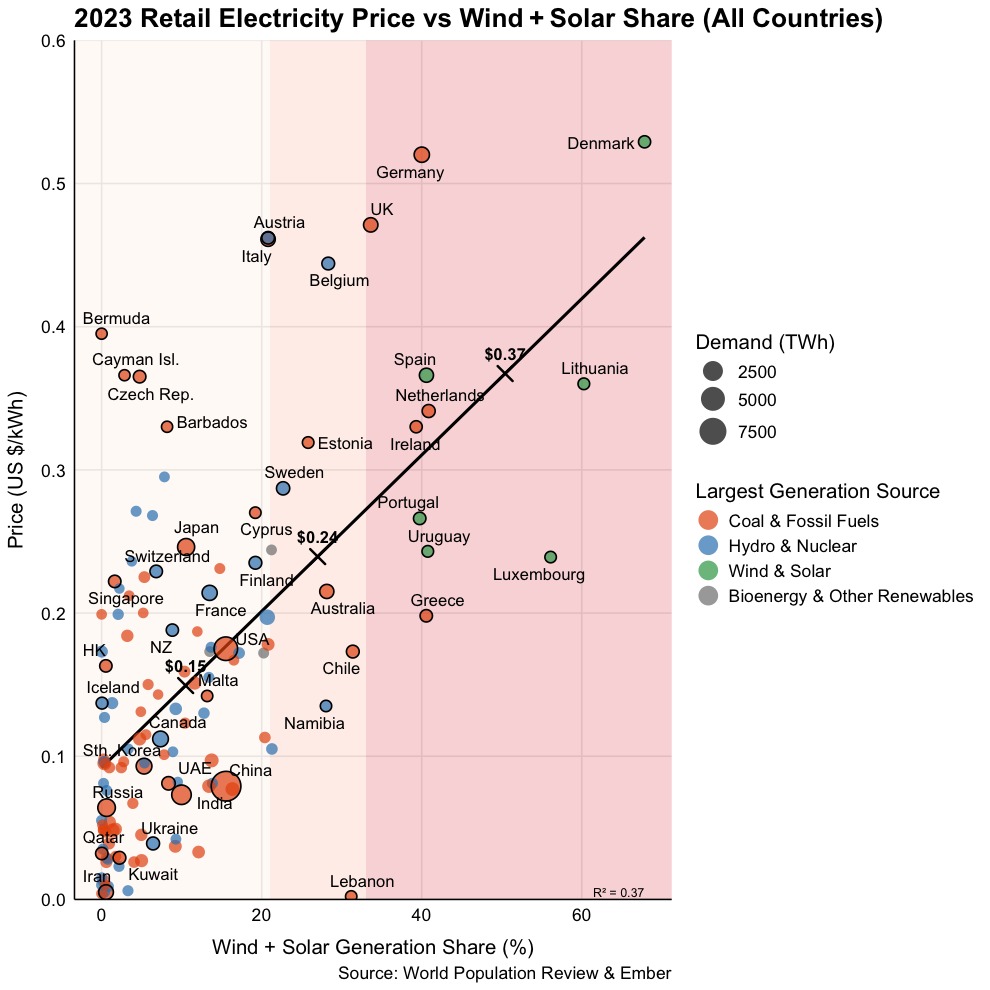
Figure 1. 2023 retail electricity price versus wind and solar generation share (all sample countries).
The above trend becomes even more pronounced when focusing specifically on wealthier nations with substantial domestic electricity production (Figure 2). In these countries, average electricity prices increase from around US $0.19/kWh at wind and solar penetration below 10% to approximately US $0.25/kWh when penetration reaches between 10% and 20%. Beyond this point, as renewable penetration increases further, average household electricity prices climb dramatically, reaching an average of US $0.42/kWh.
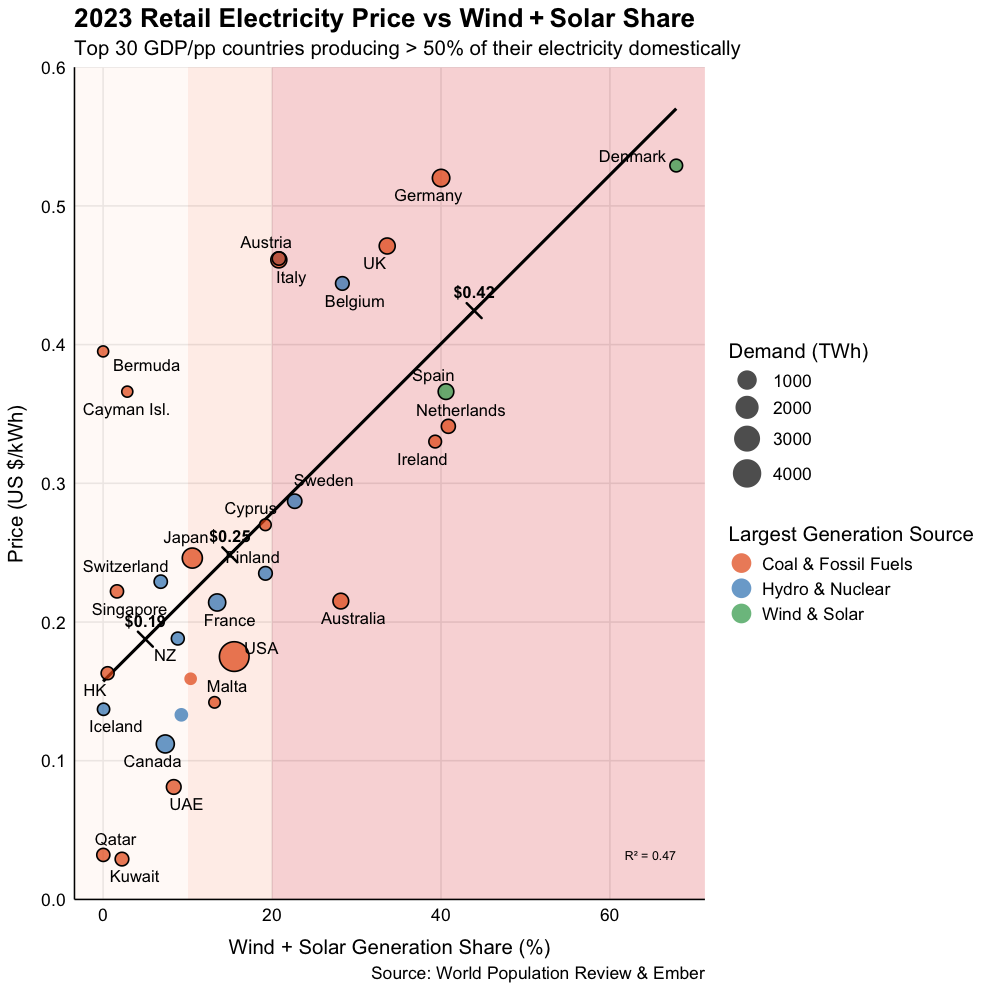
Figure 2. 2023 retail electricity price versus wind and solar generation share for top 30 GDP per capita countries producing more than half their electricity domestically.
At the very least, international experience doesn’t seem to support the idea that renewable energy integration is a ‘last mile’ problem, and that we can easily reach 90% wind and solar with moderate integration costs. This has never been done anywhere in the world. All of the international examples of very high levels of ‘renewable’ energy cited by renewables advocates — such as Iceland, Norway, Paraguay and Brazil — have very large components of hydro or geothermal power.[19] These types of generation are controllable in a way that wind and solar power are not.
The other clear conclusion from these data is that no country has been able to achieve both very low electricity prices and large shares of wind and solar generation. Apparent exceptions, such as Lebanon, represent failed states unable to provide citizens with electricity for more than one or two hours a day.[20]
Several international examples help to illustrate how cost and reliability challenges have escalated as countries have attempted to reach higher levels of wind and solar.
3.1 Spain
With solar and wind accounting for 40% of Spain’s annual generation, the recent nationwide blackout serves as a dramatic example of the risks accompanying high renewables penetration.[21] Spain and Portugal experienced unprecedented nation-wide blackouts on 28th April 2025, with trains being stranded in tunnels, flights delayed and mobile phone services cut.[22] The blackout came only 12 days after Spain hit a milestone of 100% renewables for the first time, between 10am and 7pm on 16th April.[23] Its initial cause was a malfunctioning solar inverter which triggered a voltage oscillation, leading to inappropriate disconnections of wind and solar generation and widespread failure of reactive power support.[24] This led to a series of cascading failures, ending in a blackout across the entire Iberian Peninsula.[25]
Just prior to the collapse, wind and solar accounted for 70% of Spain’s 32 GW total generation capacity.[26] This made the grid vulnerable to sudden frequency changes, as solar panels cannot provide the necessary grid inertia that is naturally provided by synchronous generators with large, spinning turbines, such as nuclear, coal, gas and hydro.[27] As summarised by energy consultant Kathryn Porter, based on Spanish grid operator Red Eléctrica de España’s (REE) report:
The Iberian grid was already in a weakened state, owing to insufficient synchronous generation and excessive reliance on inverter-based renewables. The system failed to withstand a fault that originated with a single solar inverter. This was not an unavoidable technical event — it was the result of systemic underestimation of voltage control risks, poor compliance enforcement, and REE’s failure to schedule or deploy sufficient dynamic voltage support. This blackout would not have occurred in a conventional, high-synchronous grid. The rush to decarbonise the power system without adequate attention to resilience and enforcement has created an atmosphere of complacency. That complacency – shared by policymakers, regulators, and parts of the renewables industry – led directly to a system-wide collapse that cost eleven lives.[28]
Neighbouring France, which still relies mostly on nuclear for its electricity, experienced a similar frequency change as Spain but was able to absorb the disturbance using the inertia of its nuclear plants, preventing a Europe-wide blackout.[29] The catastrophic power outage has prompted criticism from Spanish opposition parties and the media, blaming the government’s renewables push and dismissal of nuclear as the root cause of Spain’s unstable electricity grid.[30]
3.2 Germany
Germany offers a similarly instructive lesson. Its pioneering Energiewende (energy turnaround) policy — phasing out fossil fuels and nuclear in favour of wind and solar — achieving the initial renewable uptake with relative ease. In the early 2000s, generous subsidies and a grid still dominated by dispatchable coal and nuclear allowed wind and solar capacity to expand without significant operational disruptions.[31] By the mid-2010s, with wind and solar nearing 35% of generation, midday solar peaks and wind surges frequently outstripped demand, causing wholesale prices during times of peak renewables generation to plunge into negative territory.[32] Wind and solar output had to be curtailed to avoid oversaturating the grid.[33]
Germany is now attempting to expand its electricity grid, including interconnectors with other countries, to address these problems and meet its decarbonisation goals, but the buildout of transmission and distribution lines necessary to support the Energiewende is estimated to add $1.1 trillion to grid costs over the next 20 years.[34] A belated push for storage will also add further to ballooning system costs,[35] which have already caused electricity prices to rise higher than almost any other country in the world (Figure 1). The end of the renewables honeymoon is now deindustrialising Germany, with data from the German Chamber of Industry and Commerce indicating 40% of industrial companies are considering partly or fully relocating operations abroad due to a lack of affordable and reliable energy.[36] Major German industrial and union players have responded by calling the government’s energy policy “one of the most dangerous risks for our economy and competitiveness”, stating that Germany is now in the “worst economic crisis since World War II” and is “paying the price with the highest electricity costs in Europe”.[37]
3.3 Denmark
Denmark is often hailed as a renewables success story, yet the headwinds it currently faces point to the end of the honeymoon period. With wind accounting for over 50% of its energy mix,[38] the country leans heavily on interconnections with Norway and Sweden to offload surplus power and import hydropower when winds falter.[39] This spatial shifting of energy masks the underlying challenge: without neighbours to absorb excess or fill gaps, Denmark’s system costs would climb steeply. Following a recent spike in hydro-abundant Norway’s electricity prices, for which interconnectors with Denmark, the UK and Germany have taken the blame, the Norwegian government is proposing to scrap the interconnector with Denmark in 2026.[40] If this occurs, and Denmark can no longer rely on neighbours to balance supply and demand in its wind-dominated grid, prices are likely to rise dramatically, exposing the fact that the Danish honeymoon is over.
It is therefore unsurprising that Denmark’s renewables rollout has slowed considerably in the last year. The Danish government recently cancelled its 3 GW offshore wind auction,[41] while Danish energy firm Orsted has backed out of multiple green hydrogen projects reliant on offshore wind.[42] The government is beginning to shift its focus back to baseload power, with Denmark’s 40-year ban on nuclear power currently being reconsidered.[43]
3.4 California
California offers a parallel tale from across the Atlantic. The state’s aggressive renewables rollout has seen wind and solar penetration soar past 30% by the late 2010s.[44] As a result, Californian electricity prices have risen from around 10% higher than the US average in the late 1980s to over 80% higher than average in 2024.[45]
California’s rooftop solar incentive program, Net Energy Metering, provided full or near-retail rates for rooftop solar exports up until April 2023, when these credits were decreased in line with the utility’s avoided cost — though existing systems will continue to receive the historical premium rates.[46] This decrease is unsurprising, given growing opposition to the scheme as customers without rooftop solar are forced to pay ever-increasing cross-subsidies to those with rooftop solar.[47]
In recent years, the dramatic rise in electricity prices has boosted the economic case for grid defection — at least, for those wealthy enough to afford tens of thousands of dollars in up-front capital costs for a solar system, battery and diesel generator.[48] There is now a serious risk that broadscale grid defection will precipitate a utility death spiral, with fewer and fewer customers having to cover growing system costs, worsening energy affordability.[49] If there ever was a honeymoon in California, it is now over.
3.5 China
Even China, the supposed global leader in renewable uptake, is experiencing signs of stress at relatively low levels of renewables penetration. Despite hosting nearly half of the world’s total operating wind and solar capacity,[50] recent changes to electricity pricing suggest that the honeymoon may already be over as China has reached around 20% wind and solar.[51] The government recently announced a move to more market-based pricing mechanisms, which would replace the existing fixed rates for solar and wind power with two-way contracts for difference.[52] New solar and wind projects will have strike prices determined through competitive auctions, with generators being paid the difference if prices fall and paying back the difference if prices rise. These changes come as solar and wind curtailment has been on the rise, presumably due to operators of new coal plants having internal production targets and PPAs which make them unwilling to reduce output, even when the grid is congested.[53] One energy expert has warned that if the government “gets the numbers just a little bit wrong” on the market-based mechanism, new wind and solar capacity “will drop off a cliff”.[54] The alternative is ensuring new capacity continues to increase by giving even greater subsidies through high contracted strike prices. As yet, it is unclear whether China will be willing to suffer the same economic pain experienced by countries that have forged beyond 20%. Either way, the renewables honeymoon in China is clearly drawing to a close.
4. First Principles: The honeymoon can’t extend far beyond 30%
Understanding why these escalating costs and challenges emerge requires examining the physical and engineering realities of integrating large shares of wind and solar into electricity systems.
4.1 Introducing the local demand saturation model
There are many intricate complexities in an electricity system, which tend to further accelerate the onset of costs and risks of integrating wind and solar. To provide reliable bounds to the end of the honeymoon, we will initially focus on an ultra-simple model of the electricity system, which assumes constant demand, and has meeting this demand as its only objective. By doing this, we will ignore the challenges of maintaining grid stability, and focus solely on supplying the required volume of electricity.
This simplified approach seeks to establish the bounds for wind and solar penetration at which system costs must expand beyond generator costs. The model does this by establishing at which point instantaneous saturation of local demand will occur. Any further increase in output of the same generation profile (i.e. more of the same wind and solar output) in the same part of the grid will necessarily result in at least one of three things occurring, each of which increase system costs:
- Energy is wasted. This is often called curtailment, or spillage, where the energy that is surplus to demand is simply wasted.
- Energy is moved through time. This occurs through the addition of storage to the system, which captures the surplus, and shifts it in time to be consumed when generation is lower than demand.
- Energy is moved through space. This occurs through the addition of transmission to the system, which can transport the energy to a different place, where demand is not satisfied by the local generation.
It is important to note that all three of these necessarily lead to increased system costs, including energy curtailment. If energy is curtailed, the average output per each installed unit of power generation declines, resulting in greater generator capital requirement per unit of energy delivered. This does not necessarily mean curtailment is always the worst outcome for the grid and must be avoided. It simply means curtailment arising from local saturation will always increase costs compared to a system without local saturation. Similarly, the amount of storage or transmission capital per unit of energy delivered must increase once local saturation is reached. Increasing these additional capital costs can only increase the overall cost of delivering energy. Consequently, establishing the point at which local saturation is reached is a reliable indication of the onset of new costs, or the end of the honeymoon.
4.2 Establishing the ski-jump cost curve
To understand when saturation is reached, we first need to consider the typical output profiles of generators. A generator’s capacity factor is the fraction of its maximum output it delivers on average; if output is plotted between 0% and 100%, the capacity factor corresponds to the average height of that curve over time.
Dispatchable generators usually ramp quickly to full output and remain there until they ramp down, producing a square or block-like profile. By contrast, weather-dependent sources follow more variable shapes. Solar ramps up in the morning, sustains high output around midday, and then ramps down in the evening, while axis-tracking can extend the plateau near peak. Wind output is more irregular and auto-correlated, with many hours at low or intermediate levels, fewer at zero, and occasional bursts toward maximum output.
To capture these patterns in a way that is tractable for analysis, we first need a tractable representation of the typical output profiles of solar and wind. For this purpose, we draw on 13 years of half-hourly solar and wind generation traces across the National Electricity Market (NEM) published by AEMO, which are the standard inputs to its long term system planning.[55] Before curtailment, these traces imply average capacity factors of approximately 23.4% for large-scale solar and 34.9% for wind in the NEM.
Figure 3 shows density plots of capacity factors from these AEMO traces. For solar, the distribution has two clear concentrations: a very large one at 0% (night time) and another peak near 100% (midday). Between these extremes, values are less frequent, corresponding to the ramp-up in the morning and ramp-down in the evening. Put together, these features are well represented by a trapezoid-shaped profile: no output when the sun is down, steep shoulders on either side, and a pronounced peak in the middle of the day.
Wind looks different. Its distribution also has a strong concentration near 0%, showing that turbines often generate little or nothing. But unlike solar, wind output is spread broadly across the intermediate range: many hours fall between 10% and 60%, and a smaller share reach near full output. This broad distribution suggests a triangular profile: the base reflects that low output is common, the peak captures occasional near-maximum output, and the gentler slopes in between indicate that wind spends much of its time at intermediate levels.
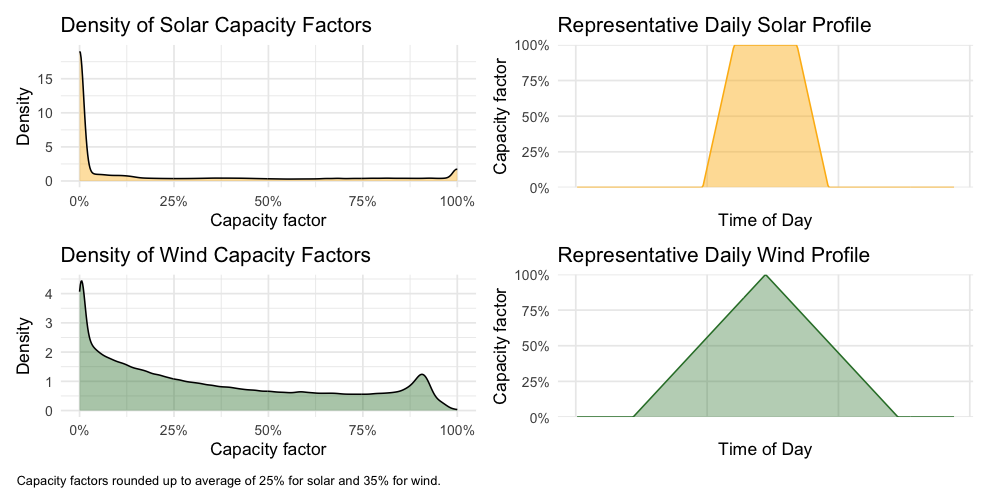
Figure 3. Density plot of capacity factors and representative profiles for solar and wind.
These representative profiles are not intended to reproduce the fine detail or sequencing of half-hourly generation. Instead, they capture the broad patterns of solar and wind output in a form that is analytically tractable. They retain the observed average capacity factors, the prevalence of zero and near-maximum output, and the overall range of variation, while abstracting away day-to-day fluctuations.
We regard these representative profiles as a fair illustration. They are anchored in the observed distributions of solar and wind capacity factors, and we have deliberately erred on the generous side by rounding the empirical averages up to 25% for solar and 35% for wind. The representative shapes also strip away the volatility and uncertainty that characterise real weather. They introduce a daily cycle in wind, which is not nearly as present in reality as in this model.
By abstracting to predictable trapezoid and triangle profiles, which oscillate on a strictly daily cycle, our calculation provides a concrete method for establishing the outer bounds for onset of local saturation, by initially testing the maximally offset occurrence of these two energy profiles. In reality, the presence of real-world variation to these representative profiles will bring forward the initial onset of local saturation to be even earlier in terms of overall combined penetration, though less frequent and increasing more slowly. Creating a hypothetical where there is strictly no local saturation until the point when it occurs every day consequently shifts the initial onset of local saturation further out, favouring the prospect of increased renewable penetration before encountering significant integration costs.
Scaling up these representative profiles makes clear why saturation is inevitable. When the combined solar and wind output is raised to the point where it exceeds local demand, the surplus energy above that level cannot be absorbed without curtailment, storage, or transmission. Crucially, the geometry of the profiles means that as the peak of renewable generation rises, the surplus area also expands, and the rate at which this surplus must be shifted or spilled increases at least as quickly as the total surplus volume. A generation profile can be square blocks, or bottom-heavy trapezoids or triangles. It cannot be inverted triangles or top-heavy trapezoids.
The consequence of this is that things don’t ever get any easier. Moving more energy through space or time also requires moving energy at higher transfer rates, or wasting more. This means that transfer capacities — which translate to power charge and discharge rates for battery inverters and rectifiers, turbine and pump sizes in pumped hydro, and thermal limits on transmission lines — all must increase in order to time- or space-shift an increasing share of electricity. There may be some optimal balance between time and space energy movements, as well as curtailment. But the system for energy movement or wastage must increase monotonically as the proportion of energy above local saturation increases.
The inevitability of things always getting harder after the honeymoon is further reinforced by considering the distance through space and time that energy must move, which is separate to the previously mentioned rates of energy transfer. Presuming that an optimal development path is taken — i.e., all the lowest-hanging fruit is taken first — increasing the share of energy stored will also increase the average length of time over which it is stored.
While our model illustrates a simple daily cycle, the heterogeneity of real weather means that multi-day or seasonal storage is eventually required, which reduces the frequency of storage cycles, and hence utilisation of capital. This inevitably increases system costs per unit of delivered energy. Similarly with transmission: once sufficient electricity is transmitted to satisfy the closest load’s demand in the network, the next closest load that must be satisfied will by definition be further away. Increasing the average distance that electricity moves can only increase the overall requirement for transmission infrastructure.
The inevitable result is that the minimum capital cost for supporting renewables increases at an accelerating rate with higher penetration. This gives rise to a ski-jump shape of minimum costs as a function of penetration, which is readily observed in other analyses.[56] Above the point of local saturation, adding more of the same profile means moving more energy faster and further.
This has important consequences for understanding the nature of the threshold that is crossed at the level of local saturation. It may be that initial costs — often embodied in curtailment — only rise relatively slowly and, at first, can be ignored.
However, since these costs grow at an increasing rate, at some point they can no longer be ignored, and additional investments to move energy through space and time are required. The lumpy nature of infrastructure construction generally demands that investments are made for a higher target level of renewable penetration than is immediately achievable. This may allow further renewable generation to be added without additional investments being needed in the short term. However, the idealised minimum level for any given targeted penetration will increase relatively smoothly, even if a practical build-out to specific targeted levels proceeds with lumpy increments of cost changes in the system.
4.3 Upper-bound is 60%: The sum of capacity factors
Consider an idealised scenario in which wind and solar outputs do not overlap at all: wind generates exclusively when there is no solar output, i.e. outside of daylight hours. A strongly anti-correlated profile with equal capacity shares would theoretically support up to 60% renewable penetration before saturation occurs (i.e. the sum of wind and solar capacity factors). Each of the two profiles can reach their peak output independently, without spilling any of the other. Figure 4 illustrates this idealised scenario, where the total area under the demand curve represents the combined capacity factor, or the maximum achievable renewables share of total energy without exceeding system demand.
This illustration makes several generous simplifications that favour higher renewable generation, such as assuming perfectly flat demand, zero transmission losses, unlimited transmission capacity, and instantaneous flexibility and perfect foresight from dispatchable generation.
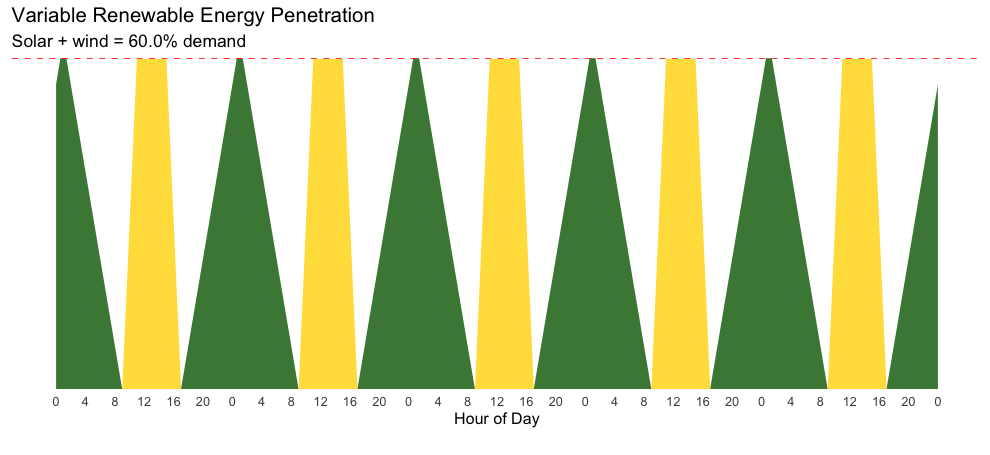
Figure 4. Theoretical maximum variable renewable penetration under non-coincidence of wind and solar.
4.4 Lower bound is 30%: The average of capacity factors
Conversely, the worst-case scenario arises when wind and solar generation are strongly correlated such that they peak simultaneously. In this scenario, the renewable penetration that can be achieved before grid saturation falls significantly, to 30% (Figure 5), since the combined shape of the stacked profiles represents the average area coverage of the two.
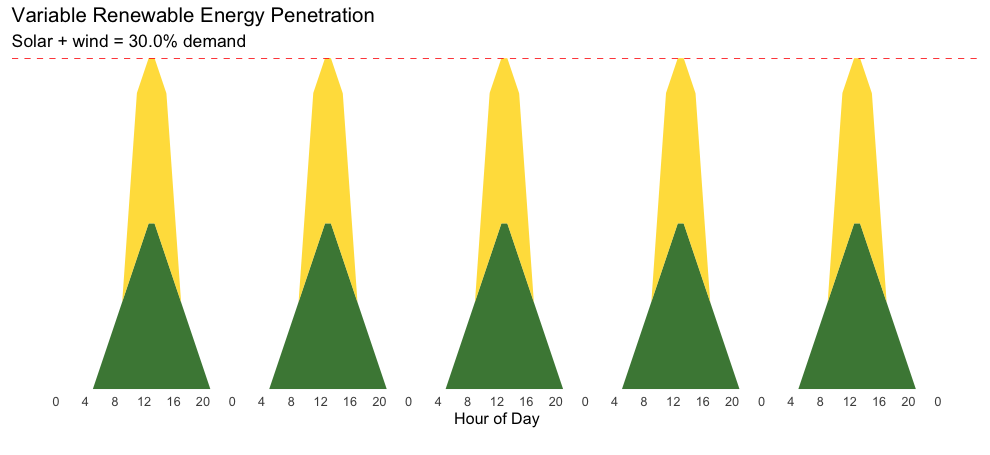
Figure 5. Coincident wind and solar peaks halve the pre-saturation variable renewables ceiling.
4.5 Exploring credible correlation: 40%
Realistically, the practical saturation point lies between these two extremes, determined by actual weather correlations and the mix between solar and wind generation in the system.
Historical analysis of 13 years of half-hourly solar and wind generation traces indicates that solar and wind generation profiles are weakly anti-correlated, with an average correlation coefficient of approximately -0.20 across the NEM (Figure 6).[57] A state-level comparison shows similarly weak negative correlations between solar and wind generation, with the strongest anti-correlation observed within Queensland (-0.27). The consistently weak negative correlations imply periods of high wind generation are only modestly associated with lower solar generation, and vice versa, suggesting limited complementarity between these two renewable energy sources across the NEM. Consequently, diversifying wind and solar offers limited improvement in mitigating the inherent intermittency of renewable generation.[58] Recent analysis from Transgrid’s transmission planning corroborates these findings, noting only modest or negligible anti-correlation in major renewable energy zones such as Central-West Orana and New England.[59]
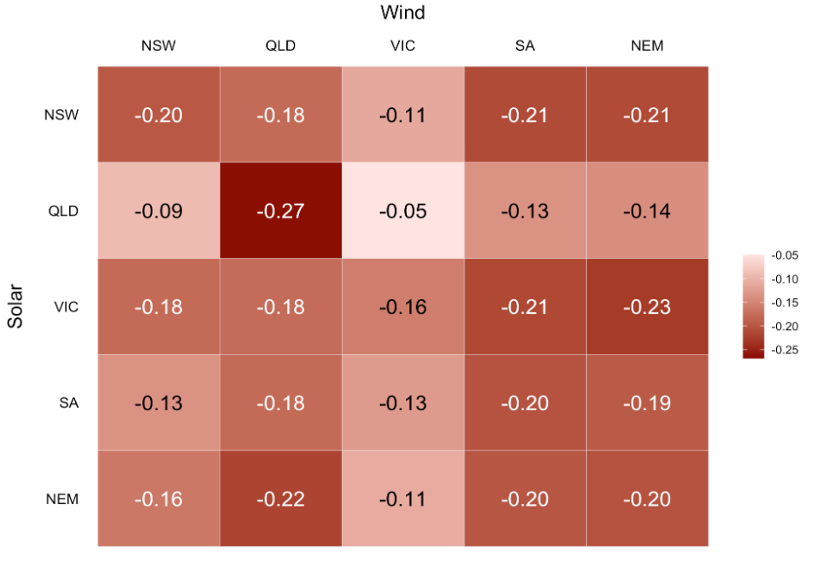
Figure 6. State-by-state solar versus wind correlation coefficient, excluding Tasmania. Half hourly traces from FY2011-12 to 2023-24.
Applying a correlation coefficient of -0.2 between wind and solar generation, the maximum renewable penetration before routine saturation is then closer to 40% (Figure 7). In practice, given real-world variability and unpredictability, less frequent instances of saturation will necessarily occur at lower penetration levels. But at something like this level, equally weighted wind and solar of weak anti-correlation will reach local saturation routinely.
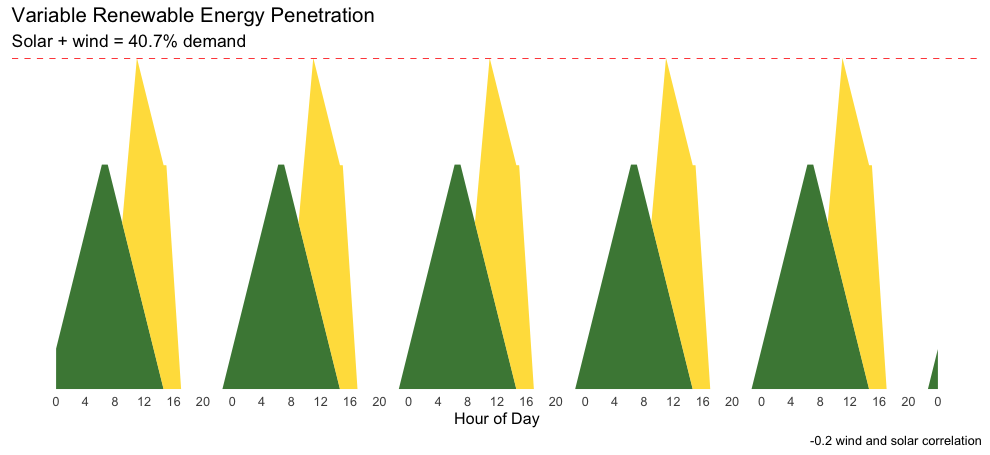
Figure 7. Variable renewable penetration threshold under observed weak wind-solar anti-correlation.
4.6 Exploring profile imbalance: 32%
The calculation so far assumes an even balance of large-scale solar and wind. However, Australia’s actual renewable energy mix is heavily skewed toward solar; particularly rooftop solar, which has significantly lower capacity factors of around 15%. AEMO’s recent fact sheet indicates that rooftop solar capacity has reached approximately 22,500 MW, more than the combined capacity of grid-scale solar (10,025 MW) and wind (11,691 MW).[60] Even in an optimistic scenario — assuming all solar capacity operates at higher, grid-scale solar capacity factors — the current solar-to-wind ratio is around 2.8 MW of solar for every MW of wind. This solar-heavy generation mix produces a peakier renewable output profile, further reducing the theoretical maximum renewable penetration before grid saturation to 32% (Figure 8).
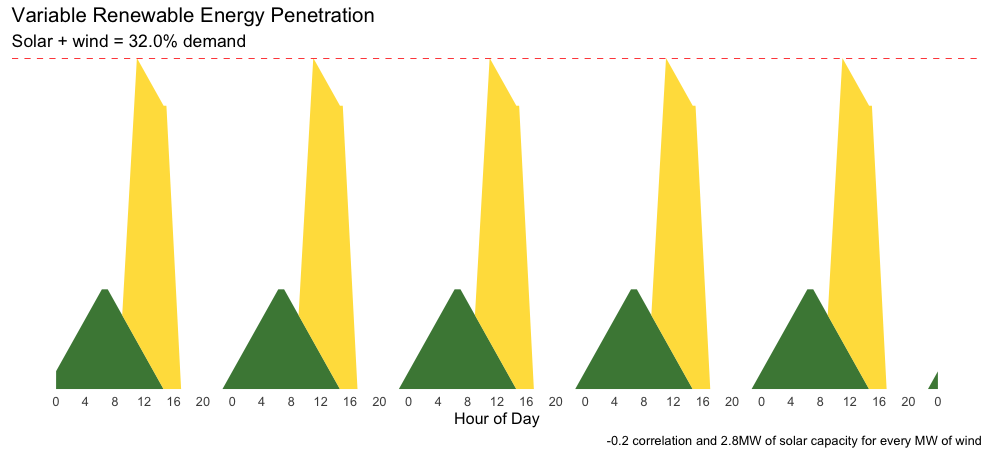
Figure 8. Variable renewable penetration threshold with current solar-heavy mix and weak anti-correlation.
Over the past 12 months, solar and wind generation in the NEM has reached approximately 34% of total generation, which means Australia has surpassed this saturation threshold identified already.[61] In the following section, we will explore the evidence in Australia’s energy system that is consistent with this threshold having already been breached.
4.7 Real-world grid constraints end the honeymoon earlier
Moreover, Australia may already be significantly deeper into the post-honeymoon phase than our analysis so far suggests due to the issue of grid stability. The current electricity system still relies heavily on coal-fired baseload generation not only to fill gaps in renewable generation, but also to provide essential grid stability. The simplifying assumption made thus far — of perfect flexibility, as though generators could be switched on and off like a light — is entirely unrealistic. In practice, coal-fired generators have minimum stable operating levels below which they cannot safely run, as well as constrained ramping capacity; coal plants in the NEM typically ramp up or down at a maximum rate of about 5 MW per minute. Frequent and rapid adjustments beyond these limits risk equipment degradation and operational damage. According to AEMO’s projections, the minimum continuous operating level required for coal plants in the NEM totals approximately 6,956 MW.[62] This baseline operation represents around 28% of total annual generation,[63] effectively creating a firm ‘floor’ of baseload generation that further constrains pre-saturation wind and solar penetration.
5. Australia’s Post-Honeymoon Challenges
The evidence that Australia has reached the end of the renewables honeymoon is clear. Our electricity dashboard is flashing red warnings, consistent with the theoretical challenges outlined in Section 4. The risk of having energy wasted has stalled new private investment, and the costs of new capital required to move more energy further and faster through space and time are now upon us.
5.1 The rising costs of wasting and moving energy through space and time
5.1.1 Curtailment: Rooftop solar challenges
Wind and solar have reached saturation in the NEM, evidenced by the degree to which their output is curtailed, or wasted, on a regular basis. The clearest example of this is rooftop solar, though large-scale solar and wind also show evidence of curtailment.
Rooftop solar has flooded the Australian grid as a result of direct government subsidies and indirect cross-subsidies from other consumers. Without curtailment, network costs would greatly increase, as rooftop solar output causes grid stress during minimum demand periods. Network companies, regulators and market operators have needed to intervene with financial incentives or brute force to prevent the grid being overloaded during peak solar periods. AEMO issued 1,800 manual directions to generators in 2024, up from six in 2016, mostly to gas, hydro and coal to synchronise to the grid at their minimum level of output because it was the only way to ensure the grid remained stable during periods of high rooftop solar output.[64]
The stress uncurtailed rooftop solar places on the grid during minimum demand periods tends to cause operational issues which shorten equipment life, such as an increase in power loss from distribution networks, voltage fluctuations and frequent operation of circuit breakers and fuses.[65] At the same time, rooftop solar does not provide material reductions in critical peak demand in a reliable enough way to reduce the need for network augmentations, which means the net effect of additional rooftop solar is an increase network costs.[66]
AEMO has responded to the grid stress caused by too much rooftop solar by requesting emergency powers to curtail its output when there is too much generation:
Now that rooftop PV is supplying more than half the grid at times, this requires introduction of a new “emergency backstop” mechanism, to allow rooftop PV systems to be curtailed or turned off briefly if necessary in rare emergency conditions, similar to the capabilities normally required of any large scale generator.[67]
These powers already exist in South Australia, Western Australia, Victoria and parts of Queensland. However, AEMO has stressed that the emergency backstop must be extended to all mainland NEM regions, warning that ever-growing solar output was posing an increasing threat to the safety and security of the grid by displacing other forms of generation needed to maintain system stability.[68] AEMO has warned that unless it has the power to curtail the amount of rooftop solar flooding into the grid, more drastic and damaging measures would need to be taken. These include increasing voltage levels in parts of the network to deliberately trip rooftop solar inverters, or shedding parts of the network with too much rooftop solar output.[69] The brute force curtailment method of raising the voltage to trip inverters has been likened to “having to stop a car by driving into a tree because you’ve not maintained the brakes”.[70]
In an attempt to prevent a repeat of the 2016 state-wide blackout, South Australia’s backstop mechanism was used to remotely curtail rooftop solar systems almost daily for a week in November 2022 when severe weather and downed transmission lines islanded the state’s grid.[71] However, AEMO has warned that the current backstop capability available may no longer be adequate in South Australia, Victoria and Queensland from 2025 onwards.[72]
AEMO has flagged an elevated risk of system collapse if a more appropriate mechanism for curtailing rooftop solar is not put in place:
If sufficient backstop capability is not available, and the above mechanisms are also exhausted, the NEM may be operating insecure for extended periods, and therefore be operating outside of the risk tolerances specified in the National Electricity Rules (NER), where the loss of a single transmission or generation element may lead to reliance on emergency control schemes to prevent system collapse. This places customers at elevated risk of system collapse. The ability to restore the system following a black system event may also be compromised at times of very high distributed PV generation.[73]
Curtailment of large-scale solar and wind farms does not face the same political backlash as curtailment of customers’ rooftop solar, but it provides further confirmation of the rising costs of ‘wasting’ energy. Rystad Energy has revealed that 4.5 TWh of large-scale solar and wind generation was curtailed in 2024, equivalent to the annual output of the original Snowy Hydro scheme.[74] As more solar and wind farms are built with highly correlated output, curtailment will only increase, with greater capital costs needing to be recovered from a smaller amount of generation, increasing price per kWh.
Curtailment of renewables is another sign the honeymoon has ended in Australia, and rising curtailment provides a signal to renewables investors that the value of their investments will decline as more wind and solar farms are built, discouraging further investment. Curtailment of rooftop solar will also reduce the incentives to install larger solar systems and will likely continue to cause consumer backlash for those who invested in large systems and were promised the honeymoon would continue forever.
5.1.2 Moving through time: Batteries
As wind and solar penetrations in Australian grids have increased, the need for growing amounts of storage to move renewable energy through time has arisen. Governments are becoming cognisant of this need, while investors wanting to capitalise on electricity market volatility are increasingly turning their sights to storage projects — particularly large-scale batteries.
Over the past five years, private and public investment in battery storage projects has steadily grown (Figure 9),[75] with new financial commitments to large-scale storage in 2023 totalling $4.9 billion, a 158% increase from $1.9 billion in 2022.[76] Spot market volatility and high electricity prices have helped boost the business case for batteries, as they can charge when prices are low or negative as solar floods the system and discharge when prices spike as low levels of wind and solar output coincides with peak demand. Increasing battery investment coinciding with declining investment in grid-scale renewable generation suggests Australia has reached the saturation point of wind and solar energy. The mismatch between when weather-dependent energy is produced and when it is needed is needing to be resolved by increasing the amount of storage available. The high cost of batteries must be recouped by investors, which necessarily adds to the overall system costs and therefore electricity prices paid for by consumers.
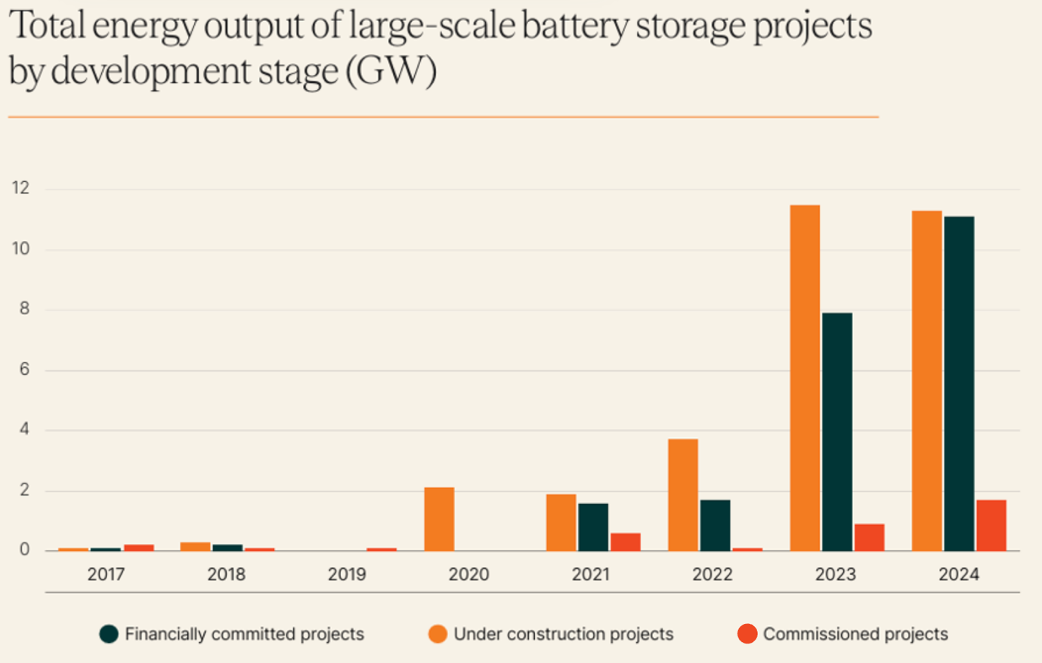
Figure 9. Total energy output of large-scale battery storage projects (GW) has grown substantially over the past few years.
The increase in battery storage capacity may result in reduced curtailment, as energy is moved through time instead of being wasted. However, this necessarily requires additional capital for storage, in order to reduce this energy wastage. Assuming that the rollout is proceeding on an efficient ‘least cost’ pathway, this still means that overall cost per unit of electricity delivered will continue to rise. Any downward pressure on prices can only arise momentarily, as the correction of previous suboptimal investment choices. On an efficient build-out, the amount of capital per unit of energy delivered must inexorably rise.
The need to move increasing amounts of wind and solar energy through time at great cost is a clear example of Australia’s post-honeymoon challenges.
5.1.3 Moving through space: Rising transmission costs
As well as being moved through time to when it is needed, weather-dependent energy must also be moved through space to where it is needed. This has instigated a massive rollout of new transmission lines across Australia to connect solar and wind farms with load centres, and augment transmission capacity. As the push to add more renewables to the grid continues, the need to move more wind and solar energy further and further through space by building new transmission lines will only continue to grow — another post-honeymoon challenge. The more transmission is built to carry the same amount of electricity, the higher the additional costs for consumers.
The unprecedented increase in transmission capacity required by renewables has been remarked upon by Australia’s energy market bodies. As AEMO CEO Daniel Westerman stated about the 2022 ISP, “It calls for levels of investment in generation, storage, transmission and system services that exceed all previous efforts combined”.[77] Unprecedented levels of new transmission, not to mention other system costs, to deliver similar amounts of energy logically translates to unprecedented costs for consumers.
Additionally, the rapid buildout required to meet government renewables targets means that many transmission projects must be built concurrently, increasing demand for materials, equipment, financing, and labour, which increases the risks of cost blowouts and delays. The recently observed rise in transmission costs over the last few years is one key sign that the renewables honeymoon is coming to an end in Australia.
In 2023, AEMO confirmed there had been “unprecedented cost increases” observed across the transmission sector, with project cost estimates showing increases in real costs of up to around 30% compared to equivalent cost estimates prepared for the 2022 ISP.[78] In 2025, even greater cost increases have been observed. AEMO has confirmed that, since 2024, real costs for overhead transmission line projects have blown out by a further 25% to 55% and substation projects by 10% to 35%.[79] These cost blowouts have five key drivers:
- sustained supply chain pressures on materials, equipment and workforce;
- market competition driven by a high number of concurrent projects under development in the NEM;
- additional contracting costs to account for risk allocation in engineering, procurement and construction contracts in response to pressures in the current market;
- project complexity, including an increased number of projects planned for remote areas; and
- social licence and additional community and landholder engagement along proposed transmission line routes.[80]
The first three factors result from the push to build many transmission projects in many different areas all at the same time (Figure 10).[81] This increases market competition, which puts pressure on supply chains and increases the risk that necessary resources will not be available for projects in time, adding to construction costs.
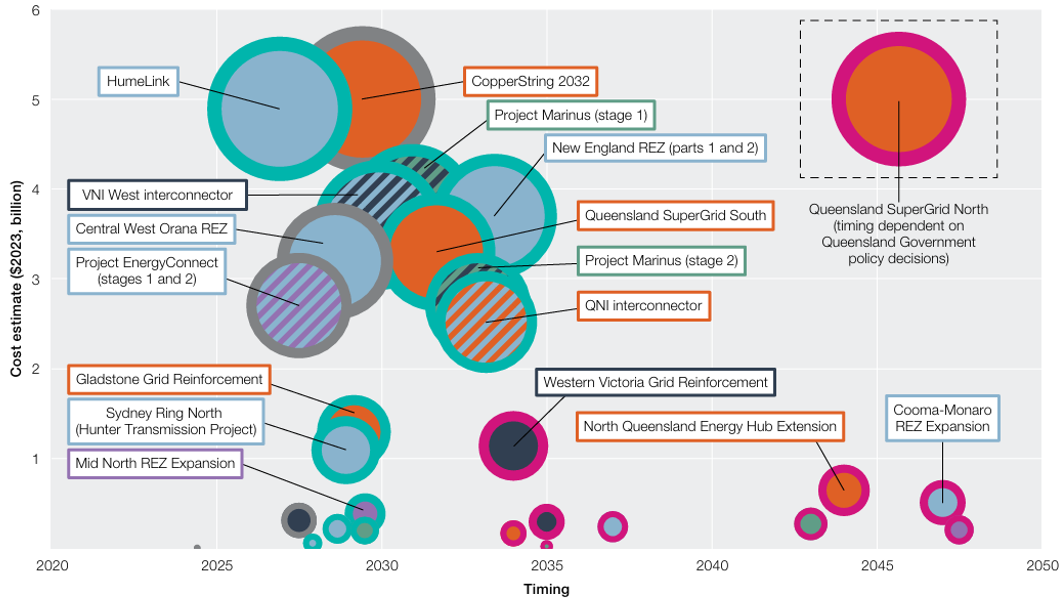
Figure 10. Most transmission projects in the 2024 ISP are scheduled for construction in the next several years. Border colours indicate project status (green: actionable, grey: committed/anticipated, pink: future). Fill colours indicate state (orange: Queensland, light blue: New South Wales, dark grey: Victoria, purple: South Australia, green: Tasmania). The size of the bubble reflects the estimated costs, not the estimated construction time for each project.
The last two factors arise from the locational requirements of wind and solar farms. They must be located in areas with good solar and wind resources, which are often in remote areas or areas that require new transmission lines cutting through prime agricultural land. This increases the complexity of projects and creates significant social licence issues in new areas which do not already have transmission lines.
It is therefore unsurprising that transmission projects in Australia have faced such substantial cost increases in recent years. As long as the mass-buildout of transmission lines to support renewables continues, these problems will persist and will continue driving up costs. Moving additional units of wind and solar energy through space will only get more costly in future. The unprecedented transmission buildout Australia is attempting is yet another example of a post-honeymoon challenge.
5.2 Additional challenges with scaling up renewables
5.2.1 Diminishing returns for wind sites
The diminishing returns for new wind sites are an excellent example of the additional challenges associated with scaling up renewables. As the low-hanging fruit of well-suited wind sites has already been taken, new wind farms must be located on increasingly less ideal sites. These sites may have difficult terrain requiring extensive clearing, be located further away from existing transmission lines or have a lower quality wind resource, all of which result in increased costs for each additional unit of wind capacity added to the grid.
The problem of diminishing returns has been flagged by the Independent Expert Advisory Panel for Energy Transition (IEAPET) in the proposal for the Hills of Gold wind farm in New South Wales:
Conceptually, the lowest cost sites would have simple terrain for constructability, be located close to major transmission lines with available capacity, and have very strong wind resources. They would also be on already cleared land and be removed from houses and population centres. Many of the ‘easiest’ i.e. most favourable sites in NSW have already been developed. Hence the pipeline of remaining sites all have less than ideal conditions in one or more respects.[82]
For the Hills of Gold wind farm, there were several factors that made the site less ideal, increasing costs.[83] These included:
- Slightly more complex terrain than for most of the already completed wind projects, which was deemed likely to be more representative of the next generation of windfarms proposed to be located on or in the foothills of the Great Dividing Range.
- Some turbines requiring vegetation clearing that would generate significant biodiversity offset costs of up to $1.2 million per turbine.
- Grid connection costs higher than those advised for projects to be located in the New England Renewable Energy Zone.
The increased difficulty of finding suitable wind farm sites on land can also be seen in the recent push for offshore wind development, despite substantially higher costs compared to onshore wind. As set out in its 2022 Policy Directions Paper, the Victorian government has committed to offshore wind targets of 2GW by 2032, 4GW by 2035 and 9GW by 2040.[84] Land use limitations were cited as the reason for pursuing this policy, with government analysis indicating that “to meet net-zero targets using onshore renewables could require up to 70% of Victoria’s agricultural land to host wind and solar farms”.[85] However, the CSIRO’s GenCost report found offshore wind to have 40% higher capital costs and six times the operating costs of onshore wind,[86] leading the authors to exclude offshore wind from their renewables system model due to its lack of cost-competitiveness.[87]
IEAPET’s confirmation that the remaining NSW wind sites are less than ideal and Victoria’s push for offshore wind to offset the need for onshore wind both illustrate how diminishing returns for wind sites signal the end of the honeymoon, with future costs escalating as more and more wind capacity enters the grid.
5.2.2 Delayed coal retirements
Coal plants provide critical inertia necessary to maintain grid stability, which has only become more critical with increasing wind and solar penetrations. Despite governments being ostensibly committed to closing coal plants before their technical end of life due to emissions reduction targets, there have been notable examples of the opposite occurring in recent years. Governments have been delaying coal plant closures out of concern that the announced schedule of retirements would unjustifiably increase the risk of blackouts. Delayed coal retirements are yet another sign that the honeymoon has come to an end and the promise of a renewables-dominated grid at minimal cost remains illusory.
In May 2024, the NSW government offered Origin Energy — the owner of Eraring, Australia’s largest coal-fired power station — up to $225 million a year in underwriting to keep the coal plant open until August 2027.[88] This was to ensure Eraring provided at minimum the typical annual output of two of its four generating units, enough to fill the forecast reliability gap.[89] Origin originally intended to close Eraring in August 2025, seven years earlier than previously planned, citing “the rapidly changing conditions in the national electricity market, which are increasingly not well suited to traditional baseload power stations”.[90] Origin CEO Frank Calabria said that “the reality is the economics of coal-fired power stations are being put under increasing, unsustainable pressure by cleaner and lower cost generation, including solar, wind and batteries”.[91] In other words, the honeymoon was ending. However, in April 2025, it was revealed that Origin had declined taxpayer underwriting for Eraring over the next year.[92] This was because Origin was now confident of making a profit due to the high wholesale electricity prices seen in New South Wales, and declining the underwriting meant Origin did not have to share any profits with the government.[93]
A similar situation has emerged in Queensland, where the state government owns most of the state’s coal plants. In April 2025, the Queensland government announced a review of its emissions reduction targets[94] and an extension of the state-owned Callide B coal plant for up to three years past the originally planned 2028 closure date.[95] This is despite Callide B having high downtime (averaging 12 weeks a year) and frequent unplanned outages in recent years.[96] The government also plans to extend other state-owned plants, with dates to be announced by the end of 2025.[97] Such extensions are clear evidence the Queensland government is becoming keenly aware of the end of the renewables honeymoon and the need to keep ageing coal plants in the system as long as possible to avoid blackouts, as there is insufficient new energy supply from reliable sources being added to the grid. The failure of renewable energy generation to allow substantial thermal generators to actually retire is another reason why system costs will inevitably continue to mount.
5.2.3 Increasing grid stability costs
Australia’s electricity grids have traditionally been kept stable by large shares of dispatchable generation sources, mainly coal and gas. But as wind and solar penetrations have increased in recent years, this stability has come under threat. To avoid blackouts, additional investment must now be made in system strength and resilience that was never necessary in the old system. While thermal generation sources produce necessary grid inertia as a byproduct, wind and solar generators do not. Closing down coal plants means artificial inertia must now be created, typically through adding synchronous condensers to the system, which represent an additional cost of scaling up renewables.
NSW provides a pertinent example of system security issues requiring increased expenditure on infrastructure. Transgrid, the NSW transmission network operator, has already observed that the NSW power system is “sitting closer to the edge of its secure operating envelope”, with a sharp rise in possible violation events since 2020 – a trend that is “projected to continue as the energy transition gathers momentum” (Figure 11).[98]
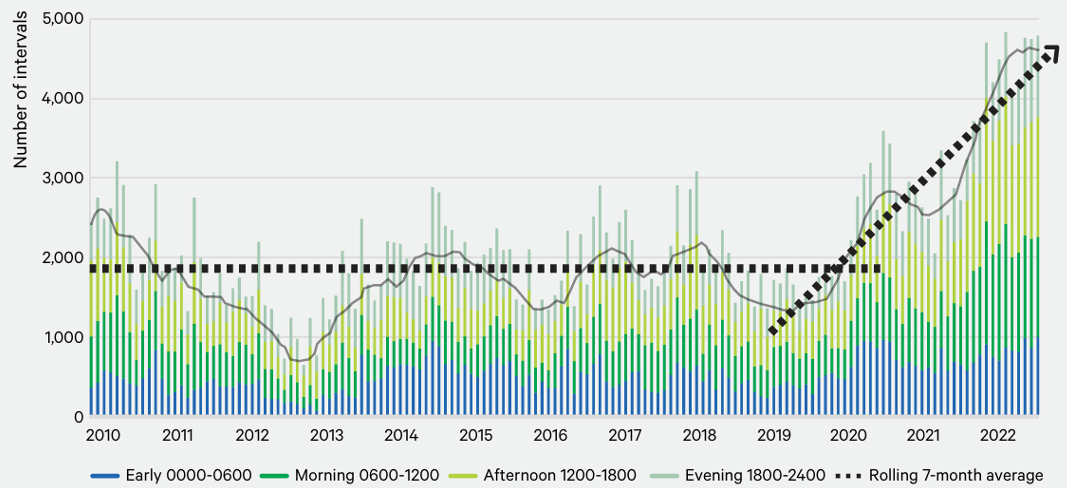
Figure 11. Operating intervals (5 minute granularity) per month when at least one credible contingency on the NSW transmission system would have resulted in a violation of the power system technical envelope, with a simplified trend overlayed.
Transgrid has flagged that coal retirements and increasing wind and solar penetrations over the next decade will mean the equivalent of up to 21 large 200MVA synchronous condensers will be required to provide sufficient system strength support to NSW, costing around $2.2 billion.[99] However, the network company is struggling to finance even five of these machines at a cost of $700 million without blowing up its credit rating as it grapples with major transmission project cost blowouts.[100] This has driven Transgrid to seek taxpayer support instead of going through the standard regulatory process, calling into question the economic benefits for consumers of Transgrid’s projects.[101]
Previously unnecessary investments in synchronous condensers provide yet another example of the additional challenges associated with scaling up renewables. Building additional systems to ensure the grid remains stable will inevitably result in increased system costs, and therefore elevated prices for consumers.
5.3 Investors respond to honeymoon ending
5.3.1 Falling capture prices for wind and solar projects
The market response to renewable oversaturation has been reflected clearly in wholesale prices. As more intermittent renewable generation enters the grid — particularly during peak solar output in the middle of the day — prices have frequently been suppressed to low or even negative levels. This clearly signals that additional renewable capacity increasingly offers limited to no economic value due to the growing mismatch between renewable generation and actual market demand.
Since 2021, when wind and solar penetration surpassed 20%, the decline in renewable capture prices relative to average wholesale market prices has become particularly noticeable (Figure 12).[102] Solar capture prices have now dropped below 50% of the average wholesale market price, while wind capture prices have declined to around 60%. By contrast, gas-fired generators capture prices have risen significantly above the market average, often reaching 200-300%. This premium reflects the necessity of gas to fill gaps in renewable supply, particularly during evening peak periods, offsetting the lower daytime prices driven by solar generation.
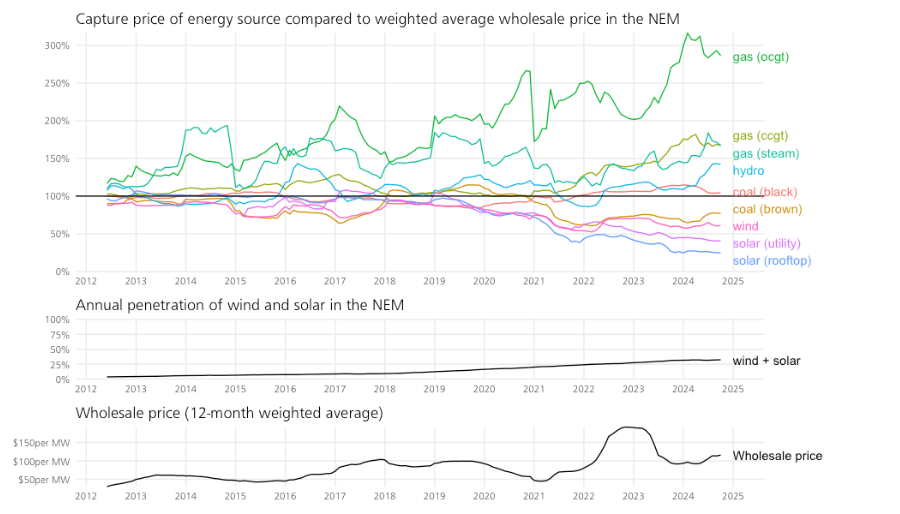
Figure 12. Capture price of energy source relative to volume-weighted wholesale price in the NEM.
This decline in capture prices is a direct consequence of the significant increase in renewable penetration, as renewables begin to cannibalise their own revenues. As shown in Figure 13, wind and solar have grown from around 5% of NEM generation in 2015 to approximately 34% in 2025. Yet, the total share of market revenue captured by renewables has plateaued since 2021 at about 16%. This divergence again points to market oversaturation, where additional renewable generation increasingly fails to deliver proportionate economic returns.
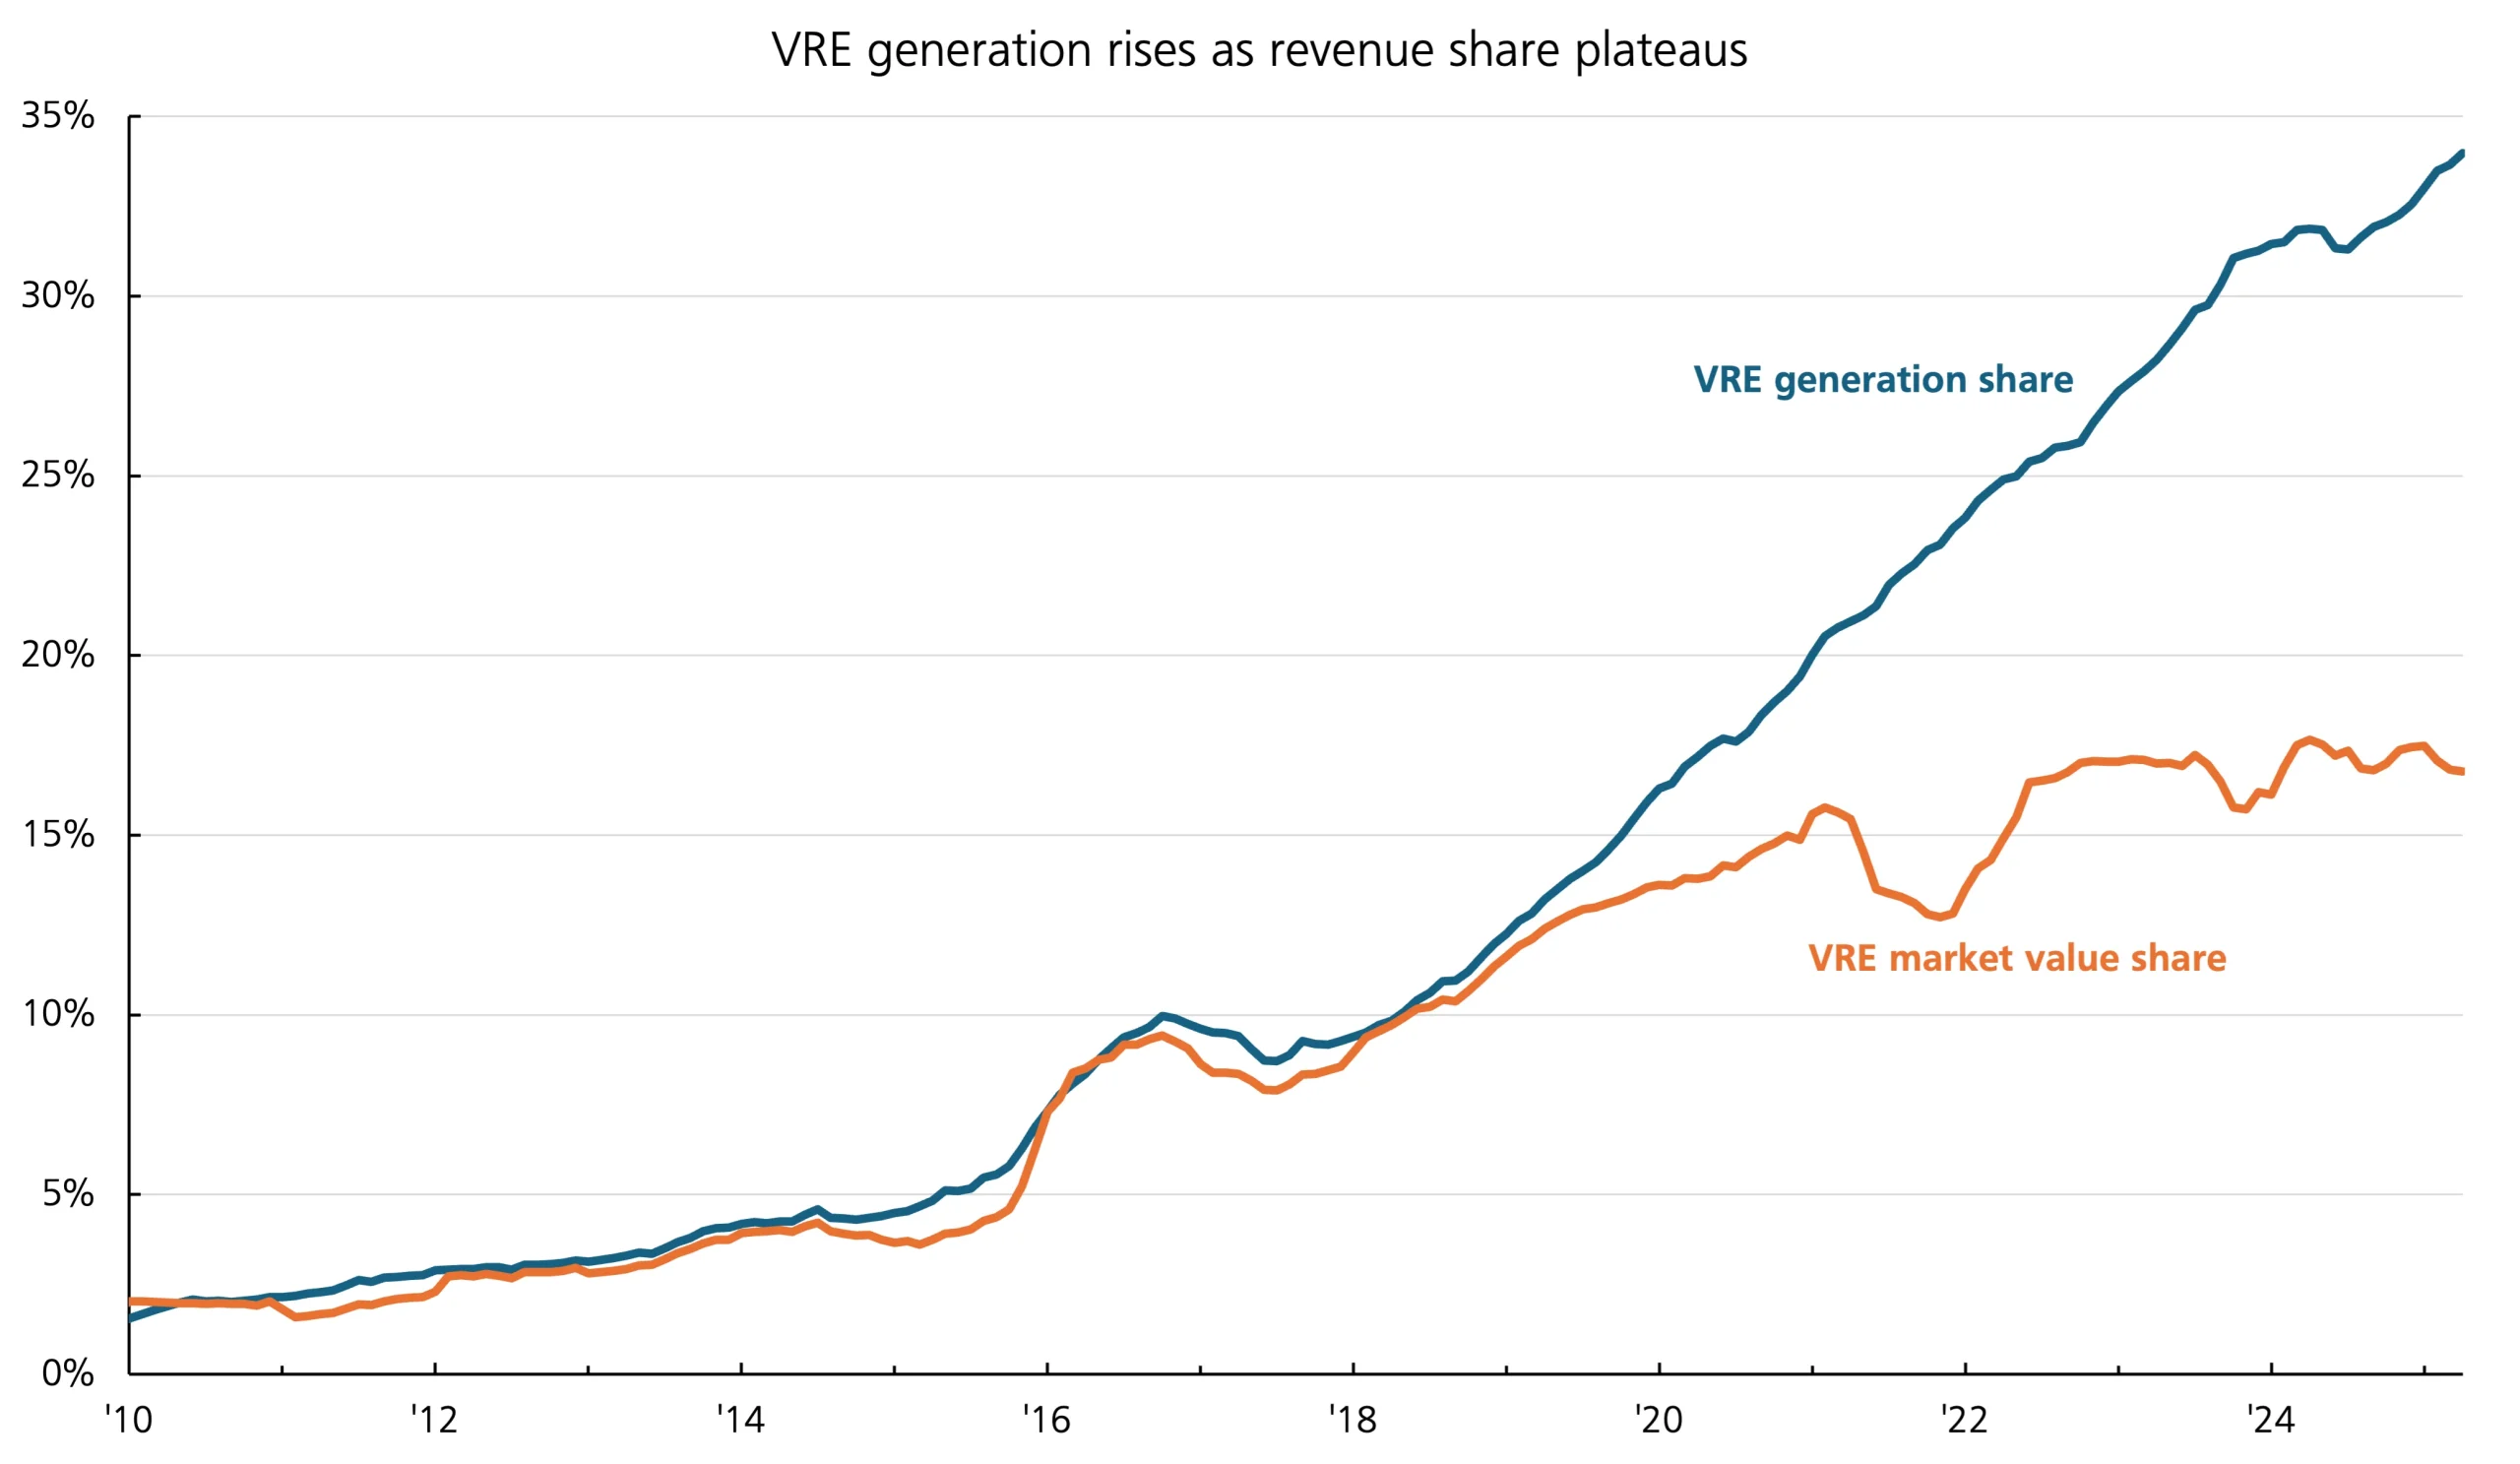
Figure 13. Wind and solar generation share versus its market value share in the NEM.
5.3.2 Declining renewables investment in Australia
As capture prices for wind and solar have fallen substantially in recent years, private investment in large-scale wind and solar farms has declined. Almost all projects financially committed to or built in recent years have been propped up by taxpayer subsidies or underwriting, in addition to receiving Large-scale Generation Certificates under the Large-scale Renewable Energy Target. This lack of investor interest in wind and solar projects without government subsidies is a clear sign the renewables honeymoon has ended in Australia. Market saturation of highly correlated renewable energy means it no longer makes financial sense to invest in solar and wind farms. This is true across the country, in both the NEM and the South West Interconnected System (SWIS).
New financial commitments to renewables have fallen dramatically from a high of around 7 GW in 2018 to around 5 GW in 2021 and then to a mere 1.3 GW in 2023 (Figure 14).[103] While the second half of 2024 showed a slight recovery, financial commitments have once again fallen in the first half of 2025. Furthermore, new renewables investment is now being driven almost entirely by substantial government subsidies and taxpayer underwriting. In FY25, only one wind project and three solar projects were committed to by private investors or commenced construction without any grants, underwriting or PPAs with government (Table 1 in Appendix).[104] This excludes projects that involve co-located storage or diesel generators.
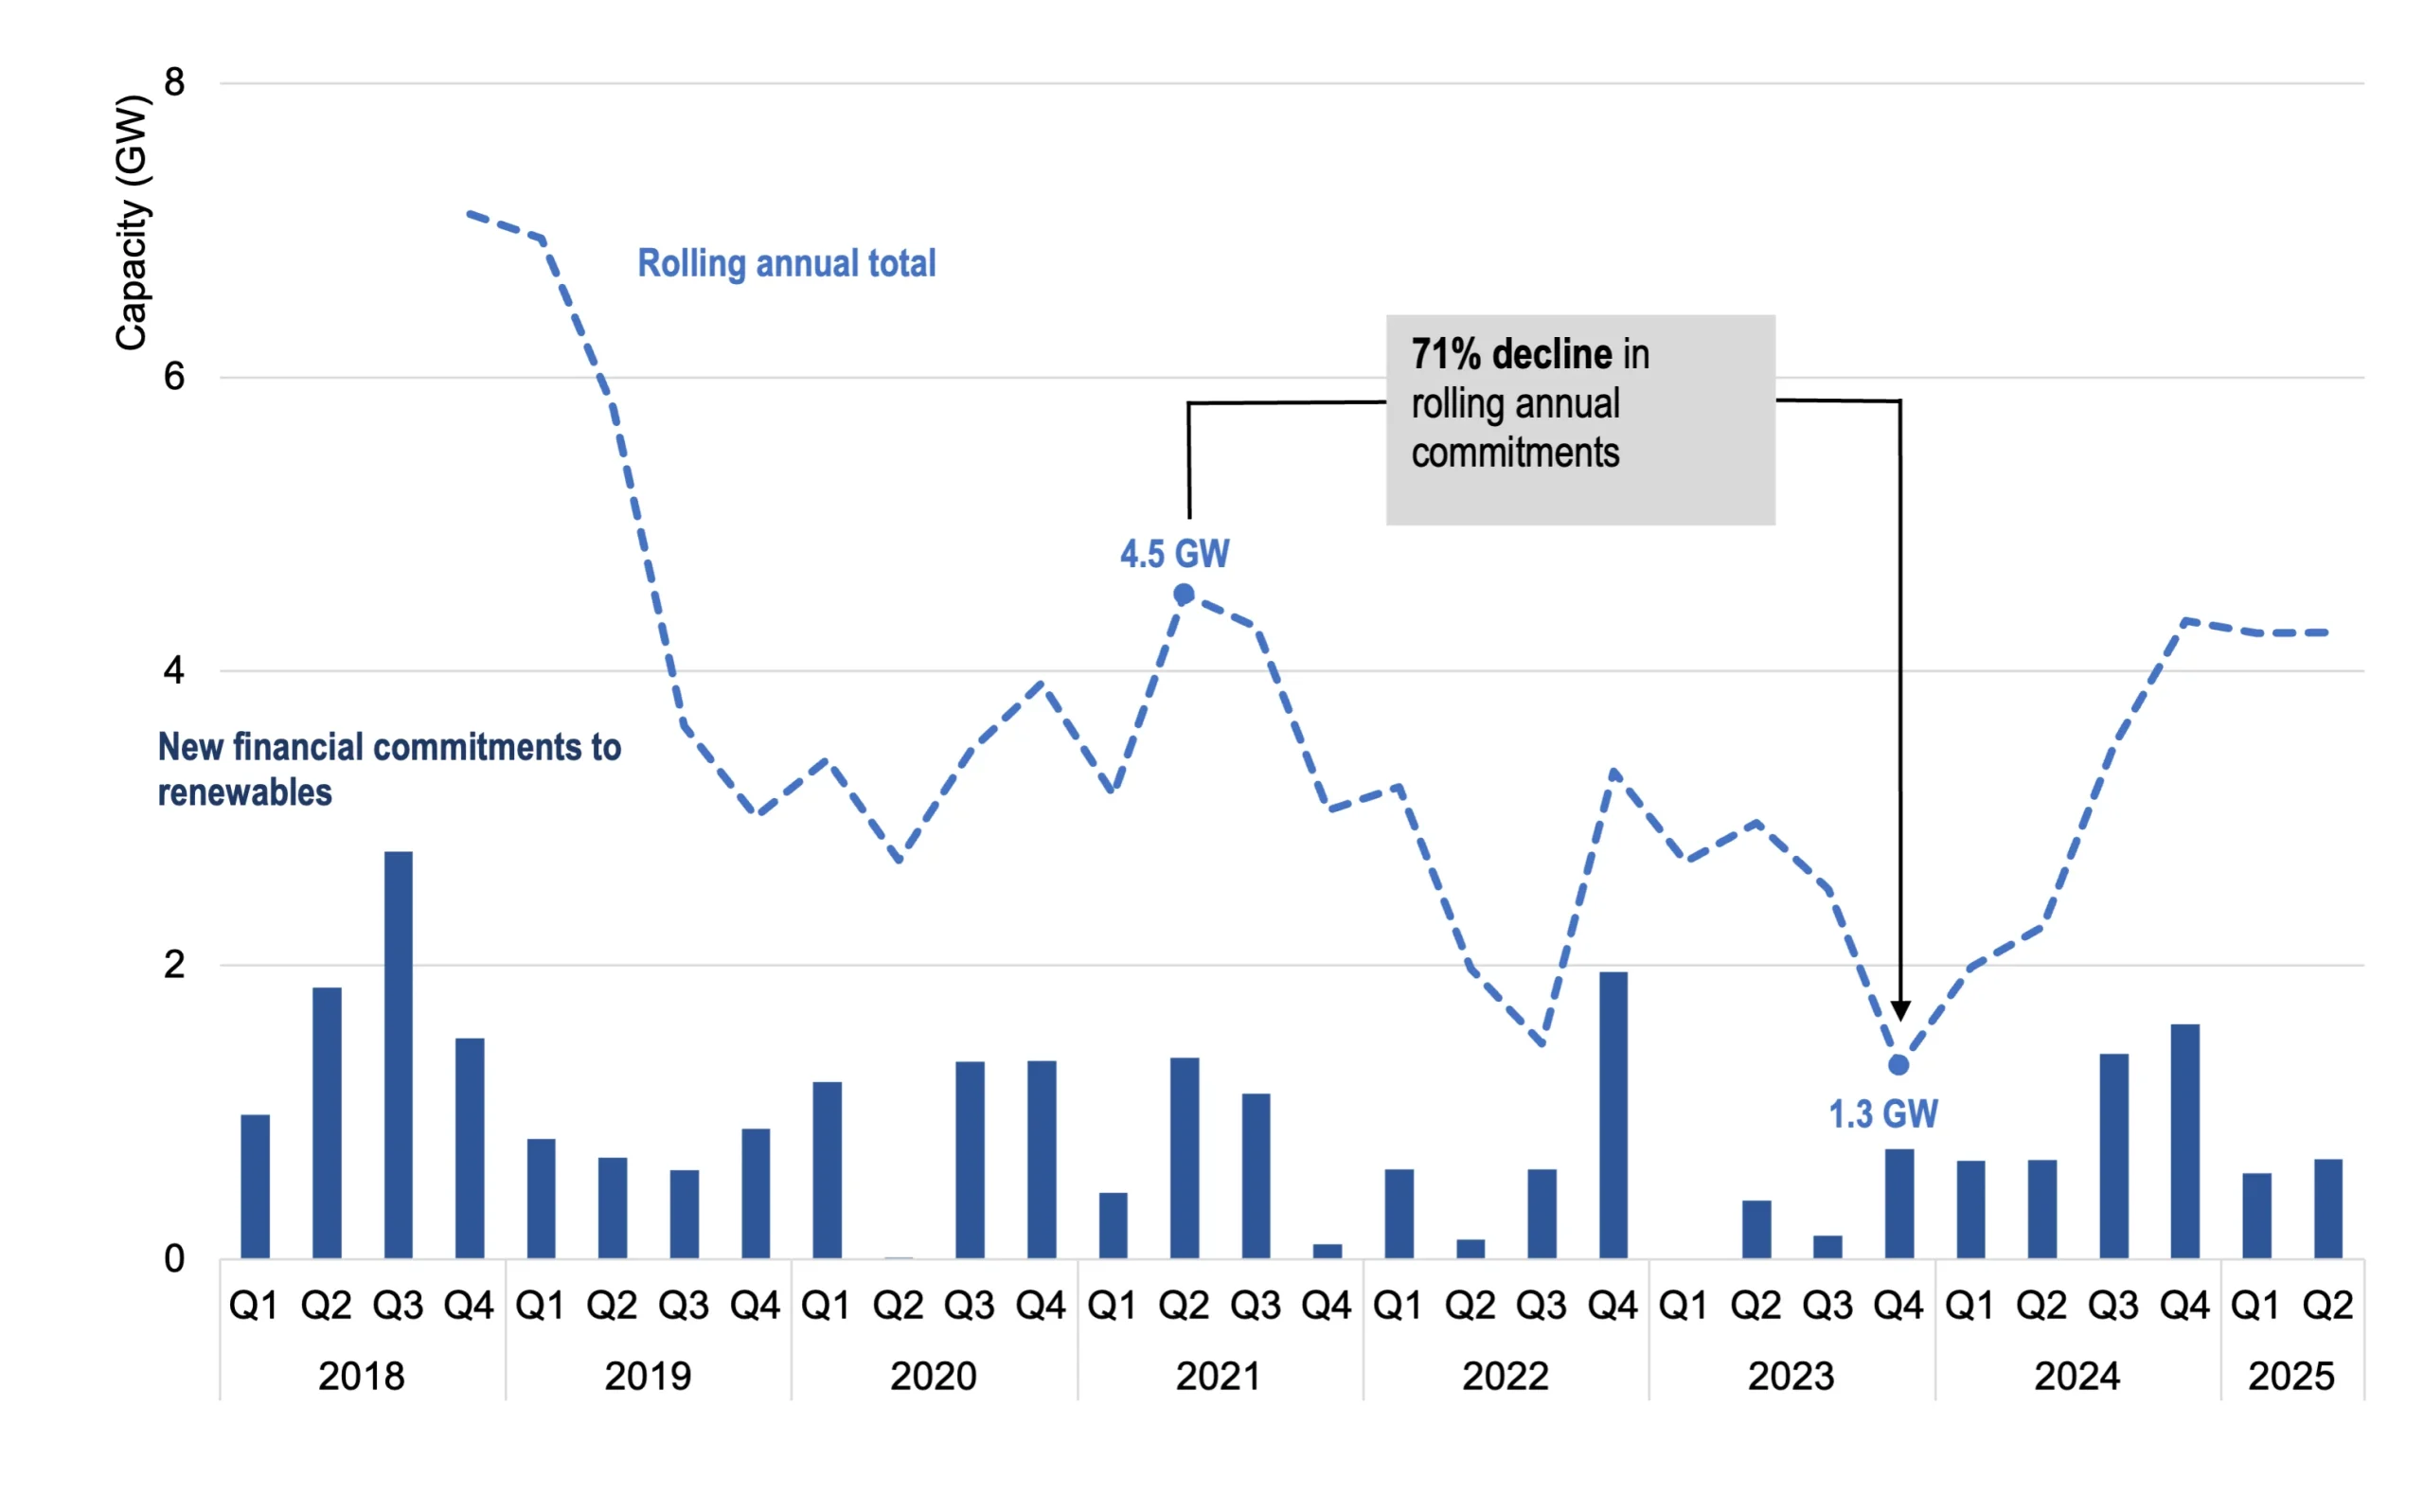
Figure 14. The total capacity (GW) of new financial commitments to renewables has declined over the last few years and the recent uptick has been driven by government subsidies and underwriting.
Of the three privately funded solar projects reaching financial close or commencing construction in FY25, it is unclear whether any would have secured private investment without corporate emissions reduction policies. The Gove Solar Project comprises two solar farms with a small capacity (10.5 MW) that are being built by Rio Tinto to reduce carbon emissions of mining operations, rather than for economic reasons.[105] Likewise, the Cloudbreak Solar Farm is being built by Fortescue to decarbonise mining operations.[106] The 250 MW Goorambat East Solar Farm appears to have been financed by private investment alone.[107] However, Deutsche Bank has been named as ‘hedge provider’, which suggests that an offtake agreement may be in place with a third party. Neither Deutsche Bank nor ENGIE, which is developing the project, were able to confirm or deny whether an offtake agreement is in place, which raises doubts over whether this project is indeed competitive purely on its own economic merit.
Port Latta wind farm, the one privately-funded wind project commencing construction in FY25, has a small capacity (21 MW) and will be connected directly into an existing substation.[108] Its five-year development permit had almost expired, but Tasmanian Parliament passed the Land Use Planning and Approvals Amendment (Supporting Development) Act 2024, which allowed the minister to grant the project a two-year extension.[109] This project provides little hope that wind investment will lift in future for larger projects on less ideal sites without substantial government subsidies or underwriting.
The Clean Energy Council has flagged a higher degree of cost and complexity and lengthy planning and environmental assessment processes as the reason for the lack of new onshore wind financial commitments in 2025.[110] Other challenges, including the slow transmission rollout and lack of interest in long-term offtake agreements, have also been cited as factors impacting the renewables rollout, with the Clean Energy Council declaring commitments are “well short of the pace required to meet Australia’s 82% renewable energy target by 2030”.[111] This highlights the fundamental challenges of attracting private investment in and integrating renewables at high penetrations, particularly as falling capture prices render wind and solar projects unappealing to investors.
In the NEM, the amount of new generation relying on government support has skyrocketed in recent years as more wind and solar and less dispatchable generation has been built. Analysis conducted for the NEM Review, supported by the Department of Climate Change, Energy, the Environment and Water, shows that all wind and solar projects built in the NEM between 2010 and 2023 have had significant government support (Figure 15).[112] The only projects to be built with minimal support over this period were gas and hydro projects.[113]
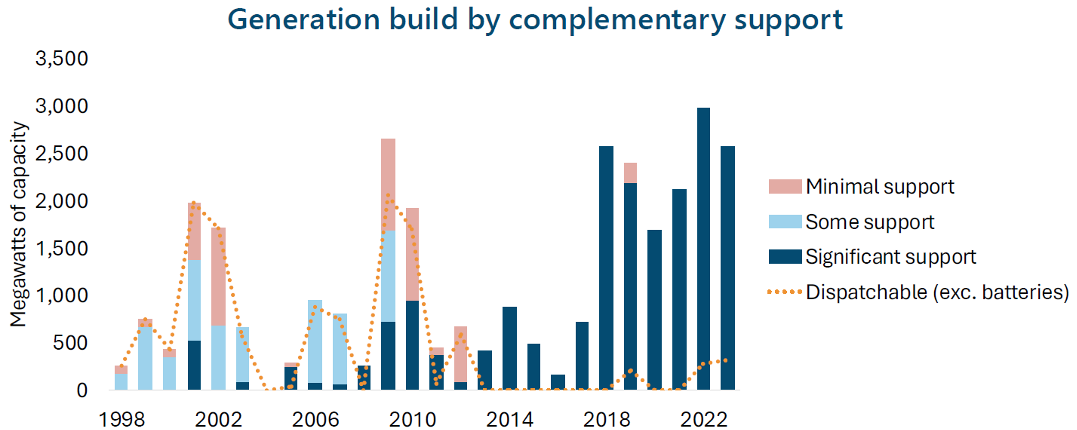
Figure 15. NEM generation build of coal, gas, solar, wind and hydro shows increasing proportion of projects with significant government support over time as dispatchable generation build declines.
In Western Australia, a similar pattern emerges. Despite Premier Roger Cook wanting the state to be a “renewable energy powerhouse”, the amount of electricity from wind and solar farms in the SWIS has effectively flatlined at about 18% of total generation, with no projects being added to the grid between 2021 and 2023.[114] In 2024, only one wind project was added, Flat Rocks Wind Farm, with BHP fully contracting a PPA.[115] In 2025, only one solar project was added, the Cunderdin Hybrid PV Solar and BESS project.[116] This slowdown has been attributed to investors not making financial decisions because it is too difficult and expensive to get connected to the grid.[117] Unsurprising, given transmission projects are notorious for cost blowouts, as occurred with the $655 million Clean Energy Link planned for completion in 2027 blowing out recently to $1 billion.[118] The end of the honeymoon is seemingly being felt by renewables investors all over Australia.
5.4 Government efforts to prolong the honeymoon
Declining private investment creates a problem for governments determined to meet their renewables targets. Increasing government intervention in the form of subsidies, loans and underwriting for wind, solar, battery and transmission projects becomes necessary to prevent the energy transition grinding to a halt.
5.4.1 Capacity Investment Scheme expansion in size and scope
The strongest indication of the end of the renewables honeymoon is the introduction and expansion of the Capacity Investment Scheme (the Scheme), potentially the largest renewables subsidies scheme in Australia. The Scheme was originally a capacity mechanism to de-risk private investment into dispatchable capacity (i.e. pumped hydro and batteries) with Commonwealth revenue underwriting. The initial terms of the Scheme in December 2022 were exclusively focused on storage, underwriting a pilot round of 6GW of capacity.
In November 2023, however, the Scheme underwent significant revisions, expanding substantially in both scale and scope. It grew to encompass 32 GW (more than five times the initial capacity), and was extended beyond dispatchable projects to include generation projects as well. Rather than being a small-scale, targeted policy to facilitate more private investment in an already growing renewables industry,[119] the Scheme is now the central funding mechanism to underwrite new projects that otherwise would not receive private capital.
Critically, as renewable capture prices continue to decline, the widening gap between the wholesale prices the market will pay for renewables and their guaranteed revenue levels implies that taxpayers will inevitably shoulder an ever-increasing financial burden. Australians will therefore be writing progressively larger cheques to renewable developers to cover these expanding shortfalls.
A targeted and temporary capacity mechanism might have been justified as a means to bridge short-term capacity gaps. But the government turning the Scheme into a perpetual subsidy for renewables is demonstrative of the post-honeymoon stage of the renewables transition Australia has entered.
5.4.2 Off-budget spending on clean energy public investment vehicles
The Capacity Investment Scheme is only the most recent example of governments deploying off-budget spending to prop up renewables. Declining private investment in renewables has led to governments increasingly needing to take an active role in providing subsidies, loans and underwriting for wind and solar projects — as well as supporting infrastructure — if they are to have any hope of meeting their renewables targets. Clean energy public investment vehicles like the Australian Renewable Energy Agency (ARENA) and Clean Energy Finance Corporation (CEFC), established in 2012,[120] have received more and more funding to support renewables in recent years. Since expenditure on projects through these vehicles is considered an ‘investment’, it is considered off-budget.
In 2022, the $19 billion Rewiring the Nation Fund was announced, expanding the CEFC’s portfolio to fund the transmission needed by renewables.[121] The CEFC’s portfolio of investments also includes $10.7 billion worth of solar and wind projects, and billions more of investment in storage, clean energy innovation, hydrogen and upgrades for homeowners.[122]
Second is the National Reconstruction Fund (NRF), a $15 billion investment vehicle “to diversify and transform Australia’s industry and economy.”[123] Its mandate includes ‘Renewables and low emissions technologies’ as one of the seven priority areas, which will focus on, among other things: renewable energy generation, transmission, distribution, or storage, reducing greenhouse gas emissions, and energy efficiency.
Between this fiscal year and 2028, the CEFC, NRF, and Snowy Hydro 2.0 will cost approximately $32.8 billion in public finance.[124] While that may be a modest amount in the grand scheme of energy infrastructure, the point is to illuminate the creative accounting required to keep system costs off the Budget balance sheet.
Another example is found in the announcement by the Future Fund, Australia’s sovereign wealth fund, to change its mandate, which was met with appropriate disdain.[125] This was an unprecedented move by the Fund, originally set up by Peter Costello in 2006. The original mandate for the fund was solely to maximise the long-term investment returns, requiring an average annual return of at least CPI plus 4.5% to 5.5% per annum over the long term, which was reduced by 50 basis points in 2017. In November 2024 the Fund’s mandate was altered, with the federal government announcing it will defer withdrawals to 2032-33 to start deploying funds today into ‘national priority areas’. Priority area number one is “supporting the energy transition,”[126] confirming yet another pool of Australian wealth being hijacked into clean energy infrastructure investments that have not been proven to be optimal. The Fund announced a long-term investment in new capacity at Tilt Renewables, which has 1.8 GW of active renewable energy and storage capacity,[127] and has acquired a 9.995% stake in Transgrid, the NSW transmission network company.[128]
Again, the present-day magnitude of the finance is not as important as what it symbolises: that costs for the energy transition are sharply escalating, and the reliance on public finance grows, with more and more public resources being encroached upon to underwrite system costs.
6. Conclusion
The renewables honeymoon must always come to an end. Costs will inevitably rise as wind and solar penetration increases, necessitating ever-greater amounts of supporting infrastructure to move each additional unit of energy further in space and time than the last. The fundamental physical limitations of the grid and the nature of renewables make this trajectory inescapable.
Once solar and wind reach saturation, they begin to cannibalise themselves and each other, causing capture prices to fall and threatening system stability and reliability. Network and storage costs dramatically increase, pushing up the cost of electricity. If sufficient firming infrastructure is not put in place in time, blackouts become more frequent. To avoid broadscale voter backlash in response to rising electricity costs and/or more frequent blackouts, the cost of the energy transition must increasingly be socialised. Taxpayer subsidies become the only way to drive renewables penetrations higher; further adding to government debt or taking away funding from other government services.
Across the globe, a clear trend of increasing costs with increasing wind and solar penetration emerges. No country has achieved penetrations higher than 60%, let alone 90%, without costs going up. A low-cost, wind-and-solar-dependent country simply does not exist. Suggestions that this is possible to achieve ignore the basic engineering and economic principles that underpin electricity grids.
The honeymoon is over in Australia and the cost curve will only get steeper. The falling wind and solar capture prices and rising electricity bills observed over the past several years are clear indicators of this. So too are the increase in government intervention in the energy market through subsidies and taxpayer underwriting of privately owned energy assets, and the recent calls for centralised control of consumer energy assets.
Governments need to stop making false promises to consumers about more renewables meaning cheaper electricity bills. Energy policy must be based in engineering and economic reality, not ideology. If Australia is to have affordable electricity and a reliable grid capable of supporting industry, policymakers need to focus on getting more reliable, dispatchable generation into the system. This will ward off further dramatic cost increases arising from the extensive network and storage infrastructure needed to support higher penetrations of renewables.
7. Appendix
Table 1. Almost all wind and solar projects (excluding those with batteries or back-up generation such as diesel) reaching financial commitment or commencing construction between Q3 2024 and Q2 2025 have received direct funding or underwriting from state or federal governments.
| Projects reaching financial commitment/commencing construction | Government Support? |
| Q3 2024 | |
| Boulder Creek Wind Farm | Yes. $400 million from Queensland government. |
| Glenellen Solar Farm | No. 50% PPA with Telstra. |
| Lotus Creek Wind Farm | Yes. $624 million from Queensland government and $300 million from coal royalties. |
| Moama Solar Farm | Yes. Part of a $48 million NSW government commitment. |
| Goorambat East Solar Farm | No. Funded by ENGIE, with Deutsche Bank providing hedging. Neither would provide details about whether an offtake agreement is in place. |
| Gove Solar Project | No. Built by Rio Tinto to meet decarbonisation commitment. Small project (10.5 MW). |
| Q4 2024 | |
| Carwarp Energy Park | Yes. $15 million ARENA grant. |
| Goulburn River Solar Farm | Yes. Won Capacity Investment Scheme tender. |
| Hay Solar Farm | Yes. Part of a $48 million NSW government commitment. |
| Horsham Renewable Energy Park | Yes. Owned by Victorian government. |
| King Rocks Wind Farm | Yes. $513 million from WA government. |
| Orange Community Renewable Energy Park | Yes. $3.5 million from NSW government. |
| Warradarge Wind Farm – Stage 2 | Yes. $30 million from WA government. |
| Q1 2025 | |
| None. | |
| Q2 2025 | |
| Cloudbreak Solar Farm | No. Built by Fortescue to meet decarbonisation commitment. |
| Port Latta Wind Farm | No. Tasmanian Parliament passed Act to allow minister to grant a one-off planning permit extension. Small project (21 MW) connected directly to existing substation. |
[1] Kean, Matt. 2024. ‘ANU Energy Update’. Climate Change Authority. https://www.climatechangeauthority.gov.au/sites/default/files/documents/2025-03/18%20Sept%202024%20-%20ANU%20Energy%20Update%20speech%20by%20Matt%20Kean%20Chair%20CCA.pdf.
[2] Bowen, Chris. 2024. ‘2024 Annual Climate Change Statement to Parliament’. https://minister.dcceew.gov.au/bowen/speeches/2024-annual-climate-change-statement-parliament.
[3] Australian Conservation Foundation. 2024. ‘A safe climate and a healthy natural world’. https://community.acf.org.au/rf-read-the-report.
[4] Climate Council. 2024. ‘Race to the Top: Australia’s Clean Energy Momentum’. https://www.climatecouncil.org.au/wp-content/uploads/2024/08/Race-to-the-top-Australias-clean-energy-momentum.pdf.
[5] Rudd, Kevin, Peter Garrett & Chris Evans. 2007. ‘Labor’s 2020 target for a renewable energy future’. p 2. https://parlinfo.aph.gov.au/parlInfo/download/library/partypol/5VRO6/upload_binary/5vro62.pdf.
[6] International Energy Agency. 2023. ‘Australia 2023 Energy Policy Review’. p 80. https://iea.blob.core.windows.net/assets/02a7a120-564b-4057-ac6d-cf21587a30d9/Australia2023EnergyPolicyReview.pdf; Clean Energy Council. 2024. ‘Clean Energy Australia Report’. https://cleanenergycouncil.org.au/news-resources/clean-energy-australia-report.
[7] Chambers, Geoff & Greg Brown. 2025. ‘Anthony Albanese abandons modelling underpinning Labor’s energy and climate agenda’. The Australian. https://www.theaustralian.com.au/nation/politics/anthony-albanese-abandons-modelling-underpinning-labors-energy-and-climate-agenda/news-story/2b75da5a71e8ddff7c393ae56db08cfe.
[8] AER. 2024. ‘Q&A with the AER Chair Clare Savage’. https://www.aer.gov.au/news/articles/news-releases/qa-aer.
[9] Graham, Paul, Jenny Hayward & James Foster. 2024. ‘GenCost 2024-25: Final Report’. pp. 113-114. CSIRO. https://www.csiro.au/-/media/Energy/GenCost/GenCost-2024-25-Final_20250728.pdf.
[10] https://ieefa.org/wp-content/uploads/2021/03/Australias-Opportunity-To-Plan-Ahead-for-a-Secure-Zero-Emissions-Grid_March-2021.pdf
[11] Osmond, David. 2023. ‘A near 100pct renewable grid for Australia is feasible and affordable, with just a few hours of storage’. RenewEconomy. https://reneweconomy.com.au/a-near-100pct-renewable-grid-for-australia-is-feasible-and-affordable-with-just-a-few-hours-of-storage/.
[12] Holmes à Court, Simon. 2025. ‘David Osmond’s work below helps communicate the one thing I wish every Australian armchair energy commentator understood.’ https://www.linkedin.com/posts/simonahac_david-osmonds-work-below-helps-communicate-activity-7348767524827615232-2tIf/.
[13] Parkinson, Giles. 2024. ‘“Worst week for wind:” But is that a reason to panic about transition to renewables?’ RenewEconomy. https://reneweconomy.com.au/worst-week-for-wind-but-is-that-a-reason-to-panic-about-transition-to-renewables/.
[14] Morton, Adam. 2022. ‘Rather than an endlessly reheated nuclear debate, politicians should be powered by the evidence’. The Guardian. https://www.theguardian.com/environment/2022/oct/30/rather-than-an-endlessly-reheated-nuclear-debate-politicians-should-be-powered-by-the-evidence.
[15] Hilton, Zoe, Aidan Morrison & Michael Wu. 2024. ‘The six fundamental flaws underpinning the energy transition’. https://www.cis.org.au/publication/the-six-fundamental-flaws-underpinning-the-energy-transition/.
[16] KPMG. 2023. ‘Turning the tide in scaling renewables’. https://assets.kpmg.com/content/dam/kpmg/es/pdf/2023/12/turning-the-slide-in-the-scaling-renewables.pdf.
[17] Australia Institute. 2025. ‘Fake fight over nuclear a distraction from real climate issues’. https://australiainstitute.org.au/post/fake-fight-over-nuclear-a-distraction-from-real-climate-issues/; Crikey. 2024. ‘The Coalition’s nuclear push is a dangerous distraction — but is Labor much better?’ https://www.crikey.com.au/2024/06/21/peter-dutton-nuclear-energy-distraction-labor/.
[18] In 2024, wind power contributed 13.4% of total generation, rooftop solar contributed 12.4% and large-scale solar contributed 6.6%. Source: Clean Energy Council. 2025. ‘Clean Energy Australia’. https://cleanenergycouncil.org.au/getmedia/f40cd064-1427-4b87-afb0-7e89f4e1b3b4/clean-energy-australia-report-2025.pdf.
[19] Romm, Joe. 2018. ‘A 100% renewable grid isn’t just feasible, it’s already happening’. RenewEconomy. https://reneweconomy.com.au/a-100-renewable-grid-isnt-just-feasible-its-already-happening-73505/; Gipe, Paul. 2012. ‘Iceland: A 100% renewables example in the modern era’. RenewEconomy. https://reneweconomy.com.au/iceland-a-100-renewables-example-in-the-modern-era-56428/; RMIT ABC Fact Check. 2024. ‘Dick Smith says no country has ever been able to run entirely on renewables. Is that correct?’ ABC. https://www.abc.net.au/news/2024-03-22/fact-check-dick-smith-renewables-entire-country/103617364.
[20] Human Rights Watch. 2023. ‘“Cut Off From Life Itself”: Lebanon’s Failure on the Right to Electricity’. https://www.hrw.org/report/2023/03/09/cut-life-itself/lebanons-failure-right-electricity.
[21] Red Electrica. 2024. ‘Renewable energies generated 56% of Spain’s electricity mix in 2024’. https://www.ree.es/en/press-office/press-release/news/press-release/2025/01/renewable-energies-generated-56-per-cent-spains-electricity-mix-2024.
[22] Sutherland, Callum. 2025. ‘Power Is Restored in Spain and Portugal. But the Cause of the Outage Remains a Mystery’. https://time.com/7281189/spain-portugal-power-restored-cause-mystery/.
[23] Draghia, Letara. 2025. ‘Spain’s 100% renewable energy milestone followed by historic blackout – Coincidence?’ EuroWeekly. https://euroweeklynews.com/2025/04/29/spains-100-renewable-energy-milestone-followed-by-historic-blackout-coincidence/.
[24] Porter, Kathryn. 2025. ‘Voltage, inertia and the Iberian blackout part 2: faulty PV inverter crashed the grid’. Watt Logic. https://watt-logic.com/2025/07/16/voltage-inertia-and-the-iberian-blackout-part-2-a-faulty-solar-inverter-crashed-the-spanish-grid12088/.
[25] StratNews Global. 2025. ‘Granada Substation Fault Identified as Cause of Spain-Portugal Blackout’. https://stratnewsglobal.com/europe/granada-substation-fault-identified-as-cause-of-spain-portugal-blackout/.
[26] Stahel, Alexander. 2025. ‘Europe’s Largest Blackout Exposes Grid Vulnerability’. The Commodity Compass. https://www.thecommoditycompass.com/p/europes-largest-blackout-exposes.
[27] Crownhart, Casey. 2025. ‘Did solar power cause Spain’s blackout?’ MIT Technology Review. https://www.technologyreview.com/2025/05/08/1116166/spain-blackout-grid/.
[28] Porter, Kathryn. 2025. ‘Voltage, inertia and the Iberian blackout part 2: faulty PV inverter crashed the grid’. Watt Logic. https://watt-logic.com/2025/07/16/voltage-inertia-and-the-iberian-blackout-part-2-a-faulty-solar-inverter-crashed-the-spanish-grid12088/.
[29] Stahel, Alexander. 2025. ‘Europe’s Largest Blackout Exposes Grid Vulnerability’. The Commodity Compass. https://www.thecommoditycompass.com/p/europes-largest-blackout-exposes.
[30] France24. 2025. ‘Renewable energy in the dock in Spain after blackout’. https://www.france24.com/en/live-news/20250430-renewable-energy-in-the-dock-in-spain-after-blackout.
[31] Gaertner, Reiner. 2001. ‘Germany Embraces the Sun’. Wired. https://www.wired.com/2001/07/germany-embraces-the-sun/.
[32] Götz, Philipp, Johannes Henkel, Thorsten Lenck & Konstantin Lenz. 2014. ‘Negative Electricity Prices: Causes and Effects’. Agora Energiewende. https://www.agora-energiewende.de/fileadmin/Projekte/2013/Agora_Negative_Electricity_Prices_Web.pdf.
[33] Bundesnetzagentur für Elektrizität, Gas, Telekommunikation, Post und Eisenbahnen. 2015. ‘Monitoring Report 2015’. https://www.bundesnetzagentur.de/SharedDocs/Downloads/EN/BNetzA/PressSection/ReportsPublications/2015/MonitoringReport_2015_Summary.pdf.
[34] Amelang, Sören. 2024. ‘Electricity grid upgrades will cost Germany 650 billion euros by 2045 – report’. Clean Energy Wire. https://www.cleanenergywire.org/news/electricity-grid-upgrades-will-cost-germany-650-billion-euros-2045-report.
[35] Latham & Watkins. 2024. ‘Battery Storage: Accelerating Germany’s Transition to Renewable Energy’. p. 2. https://www.lw.com/admin/upload/SiteAttachments/Battery-Storage-Accelerating-Germanys-Transition-to-Renewable-Energy.pdf. Euros have been converted to AUD.
[36] DIHK. 2024. ‘Energieprobleme verfestigen Abwanderungstendenzen’. https://www.dihk.de/de/themen-und-positionen/wirtschaftspolitik/energie/energiewende-barometer-24/energieprobleme-verfestigen-abwanderungstendenzen-120314.
[37] LEAG, IGBCE, ArcelorMittal & BASF. 2025. ‘Es ist 5 nach 12 – deshalb Industriearbeitsplätze JETZT!’ https://assets.ctfassets.net/mj324dykhxwi/3rM7ErCpUK2ETp3yZKONP0/1fc6ab8246e863df6db4e47fd5008c07/2025-07-03_Anschreiben_Bundeskanzler_IndustriearbeitsplaÌ_tze_-_JETZT.pdf.
[38] Statista. 2024. ‘Share of wind power over the total electricity supply in Denmark from 2009 to 2023’. https://www.statista.com/statistics/991055/share-of-wind-energy-coverage-in-denmark/.
[39] Unger, Elizabeth, Gudmundur Ulfarsson, Sigurdur Gardarsson & Thorolfur Matthiasson. 2018. ‘The effect of wind energy production on cross-border electricity pricing: The case of western Denmark in the Nord Pool market’. Economic Analysis and Policy. 58: 121-130. https://www.sciencedirect.com/science/article/abs/pii/S0313592617302011.
[40] Milne, Richard. 2024. ‘Norway campaigns to cut energy links to Europe as power prices soar’. Financial Times. https://www.ft.com/content/f0b621a1-54f2-49fc-acc1-a660e9131740.
[41] Emanuel, Chloe. 2025. ‘Denmark cancels 3 GW offshore wind auction’. TGS. https://www.4coffshore.com/news/denmark-cancels-3-gw-offshore-wind-auction-nid30750.html.
[42] Martin, Polly. 2024. ‘Orsted exits multiple Danish green hydrogen projects’. Hydrogen Insight. https://www.hydrogeninsight.com/production/orsted-exits-multiple-danish-green-hydrogen-projects/2-1-1723198.
[43] Ambrose, Jillian. 2025. ‘Denmark rethinking 40-year nuclear power ban amid Europe-wide shift’. The Guardian. https://www.theguardian.com/world/2025/may/14/denmark-rethinking-40-year-nuclear-power-ban-amid-europe-wide-shift.
[44] California Energy Commission. 2022. ‘Estimated Annual Clean Energy’. https://www.energy.ca.gov/programs-and-topics/topics/renewable-energy/clean-energy-serving-california/estimated-annual-clean.
[45] McGhee, Eric. 2025. ‘A Closer Look at California’s Surging Electricity Rates’. Public Policy Institute of California. https://www.ppic.org/blog/a-closer-look-at-californias-surging-electricity-rates/.
[46] Enphase Energy. 2024. ‘Understanding NEM 3.0 and the future of net energy metering’. https://enphase.com/blog/homeowners/understanding-nem-30-and-future-net-energy-metering.
[47] The Public Advocates Office. 2024. ‘Rooftop solar incentive to cost customers without solar an estimated $8.5 billion by the end of 2024’. https://www.publicadvocates.cpuc.ca.gov/-/media/cal-advocates-website/files/press-room/reports-and-analyses/240822-public-advocates-office-2024-nem-cost-shift-fact-sheet.pdf.
[48] Jowett, Patrick. 2024. ‘Grid defection is profitable in some solar-rich U.S. locations’. PV Magazine. https://pv-magazine-usa.com/2024/10/17/grid-defection-is-profitable-in-some-solar-rich-u-s-locations/.
[49] Fleming, Sean. 2024. ‘Grid defection is coming to California’. Clean Energy Review. https://cleanenergyreview.io/p/grid-defection-is-coming-to-california.
[50] Climate Council. 2022. ‘11 countries leading the charge on renewable energy’. https://www.climatecouncil.org.au/11-countries-leading-the-charge-on-renewable-energy/.
[51] Our World in Data. 2025. ‘China: Energy Country Profile’. https://ourworldindata.org/energy/country/china.
[52] Carbon Brief. 2025. ‘Explainer: How China’s renewable pricing reforms will affect its climate goals’. https://www.carbonbrief.org/explainer-how-chinas-renewable-pricing-reforms-will-affect-its-climate-goals/.
[53] Carbon Brief. 2025. ‘Analysis: Record surge of clean energy in 2024 halts China’s CO2 rise’. https://www.carbonbrief.org/analysis-record-surge-of-clean-energy-in-2024-halts-chinas-co2-rise/.
[54] Carbon Brief. 2025. ‘Explainer: How China’s renewable pricing reforms will affect its climate goals’. https://www.carbonbrief.org/explainer-how-chinas-renewable-pricing-reforms-will-affect-its-climate-goals/.
[55] Capacity factors derived from AEMO’s 2024 ISP Variable Renewable Energy trace data. Average annual capacity factors were calculated across locations for each reference year, then averaged. https://aemo.com.au/energy-systems/major-publications/integrated-system-plan-isp/2024-integrated-system-plan-isp.
[56] Sepulveda, Nestor A., Jesse D. Jenkins, Fernando J. de Sisternes & Richard K. Lester. 2018. ‘The Role of Firm Low-Carbon Electricity Resources in Deep Decarbonization of Power Generation’. Joule. 2:2403–2420. https://www.cell.com/action/showPdf?pii=S2542-4351%2818%2930386-6; Mai, Trieu, Debra Sandor, Ryan Wiser & Thomas Schneider. 2012. ‘Renewable Electricity Futures Study: Executive Summary’. National Renewable Energy Laboratory. https://www.nrel.gov/docs/fy13osti/52409-ES.pdf; Elliston, Ben, Jenny Riesz & Iain MacGill. 2016. ‘What cost for more renewables? The incremental cost of renewable generation – An Australian National Electricity Market case study’. Renewable Energy. 95:127-139. https://arena.gov.au/assets/2017/06/Elliston_etal_2016_6.pdf.
[57] AEMO. 2024. ISP Variable Renewable Energy trace data.
[58] Frontier Economics. 2020. ‘Sunny with a chance of rain’. https://www.frontier-economics.com.au/sunny-with-a-chance-of-wind/
[59] Transgrid. 2024. Transmission Annual Planning Report. p 27. https://www.transgrid.com.au/media/tzclb1hb/tapr-2024.pdf
[60] AEMO. 2025. ‘Fact sheet: The National Electricity Market’. https://aemo.com.au/learn/energy-explained/fact-sheets/the-national-electricity-market-fact-sheet
[61] OpenElectricity. Last accessed 15 May 2025. https://explore.openelectricity.org.au.
[62] AEMO. 2025. Draft 2025 Stage 2 Inputs and Assumptions Workbook. https://aemo.com.au/consultations/current-and-closed-consultations/2025-iasr
[63] Based on an annual total generation of 210.7 TWh in the NEM in FY 2023-24.
[64] AEMO. 2025. ‘AEMO CEO speech at CEDA Climate and Energy Summit’. https://aemo.com.au/newsroom/speeches/aemo-ceo-speech-at-ceda-climate-and-energy-summit.
[65] Hilton, Zoe, Michael Wu & Aidan Morrison. 2025. ‘Rooftop solar: Paradise Lost’. https://www.cis.org.au/publication/rooftop-solar-paradise-lost/.
[66] Ibid.
[67] AEMO. 2024. ‘Supporting secure operation with high levels of distributed resources’. p 3. https://aemo.com.au/-/media/files/initiatives/der/managing-minimum-system-load/supporting-secure-operation-with-high-levels-of-distributed-resources-q4-2024.pdf.
[68] Ibid. p. 3.
[69] Mercer, Daniel. 2024. ‘AEMO says emergency powers to switch off solar needed in every state amid ‘system collapse’ fears’. ABC. https://www.abc.net.au/news/2024-12-02/aemo-demands-emergency-backstop-to-switch-off-solar/104670332.
[70] Hannam, Peter. 2024. ‘Your smoke detector may be at risk if solar power is turned off during sunny days to protect the grid, experts say’. The Guardian. https://www.theguardian.com/australia-news/2024/dec/07/smoke-detector-risk-power-shutdowns-blackouts-solar-power-grid.
[71] AEMO. 2024. ‘Supporting secure operation with high levels of distributed resources’. p 22. https://aemo.com.au/-/media/files/initiatives/der/managing-minimum-system-load/supporting-secure-operation-with-high-levels-of-distributed-resources-q4-2024.pdf.
[72] AEMO. 2024. ‘Supporting secure operation with high levels of distributed resources’. p. 7. https://aemo.com.au/-/media/files/initiatives/der/managing-minimum-system-load/supporting-secure-operation-with-high-levels-of-distributed-resources-q4-2024.pdf.
[73] AEMO. 2024. ‘Supporting secure operation with high levels of distributed resources’. p. 6. https://aemo.com.au/-/media/files/initiatives/der/managing-minimum-system-load/supporting-secure-operation-with-high-levels-of-distributed-resources-q4-2024.pdf.
[74] Vorrath, Sophie. 2025. ‘Snowy Hydro-worth of solar and wind wasted in 2024, as curtailment continues to bite’. RenewEconomy. https://reneweconomy.com.au/snowy-hydro-worth-of-solar-and-wind-wasted-in-2024-as-curtailment-continues-to-bite/.
[75] Clean Energy Council. 2025. ‘Clean Energy Australia 2025’. https://cleanenergycouncil.org.au/getmedia/f40cd064-1427-4b87-afb0-7e89f4e1b3b4/clean-energy-australia-report-2025.pdf.
[76] Clean Energy Council. 2024. ‘Clean Energy Australia 2024’. https://cleanenergycouncil.org.au/getmedia/0cb12425-37ab-479e-9a4b-529622cc9c02/clean-energy-australia-2024.pdf.
[77] AEMO. 2022. ‘2022 Integrated System Plan’. https://aemo.com.au/-/media/files/major-publications/isp/2022/2022-documents/2022-integrated-system-plan-isp.pdf.
[78] AEMO. 2023. ‘2023 Transmission Expansion Options Report’. p 3-4. https://aemo.com.au/-/media/files/major-publications/isp/2023/2023-transmission-expansion-options-report.pdf.
[79] AEMO. 2025. ‘Draft 2025 Electricity Network Options Report’. p 5. https://aemo.com.au/-/media/files/stakeholder_consultation/consultations/nem-consultations/2025/2025-electricity-network-options-report/draft-2025-electricity-network-options-report.pdf.
[80] Ibid.
[81] AER. 2024. ‘State of the energy market: 2024’. p 118. https://www.aer.gov.au/system/files/2024-11/State%20of%20the%20energy%20market%202024.pdf.
[82] Independent Expert Advisory Panel for Energy Transition. 2024. ‘Hills of Gold Wind Farm Proposal: Advice on energy production cost impacts under turbine configuration scenarios’. p 31. https://www.ipcn.nsw.gov.au/resources/pac/media/files/pac/projects/2023/12/hills-of-gold-wind-farm/additional-case-material-available-for-public-submission/attachment-d–ieapet-advice.pdf.
[83] Independent Expert Advisory Panel for Energy Transition. 2024. ‘Hills of Gold Wind Farm Proposal: Advice on energy production cost impacts under turbine configuration scenarios’. p 31. https://www.ipcn.nsw.gov.au/resources/pac/media/files/pac/projects/2023/12/hills-of-gold-wind-farm/additional-case-material-available-for-public-submission/attachment-d–ieapet-advice.pdf.
[84] Victoria State Government. 2022. ‘Offshore Wind Policy Directions Paper’. p 1. https://nla.gov.au/nla.obj-3163118181/view.
[85] Victoria State Government. 2022. ‘Offshore Wind Policy Directions Paper’. p 18. https://nla.gov.au/nla.obj-3163118181/view.
[86] Graham, Paul, Jenny Hayward & James Foster. 2024. ‘GenCost 2024-25: Final Report’. p. 94. CSIRO. https://www.csiro.au/-/media/Energy/GenCost/GenCost-2024-25-Final_20250728.pdf.
[87] Graham, Paul, Jenny Hayward & James Foster. 2024. ‘GenCost 2024-25: Final Report’. p. 71. CSIRO. https://www.csiro.au/-/media/Energy/GenCost/GenCost-2024-25-Final_20250728.pdf.
[88] NSW Government. 2024. ‘NSW Government secures two-year extension to Eraring Power Station to manage reliability and price risks’. https://www.nsw.gov.au/media-releases/nsw-government-secures-two-year-extension-to-eraring-power-station.
[89] Ibid.
[90] Morton, Adam & Peter Hannam. 2022. ‘Australia’s largest coal-fired power station, Eraring, to close in 2025, seven years early’. The Guardian. https://www.theguardian.com/australia-news/2022/feb/17/australias-largest-coal-fired-power-station-eraring-to-close-in-2025-seven-years-early.
[91] Origin. 2022. ‘Origin proposes to accelerate exit from coal-fired generation’. https://www.originenergy.com.au/about/investors-media/origin-proposes-to-accelerate-exit-from-coal-fired-generation/.
[92] Packham, Colin. 2025. ‘Origin Energy declines NSW underwriting for Eraring as high wholesale prices boost confidence’. The Australian. https://www.theaustralian.com.au/business/mining-energy/origin-energy-declines-nsw-underwriting-for-eraring-as-high-wholesale-prices-boost-confidence/news-story/95f2e8d48713eab706cad4f6bec7871a.
[93] Ibid.
[94] Stewart, Rachel. 2025. ‘Queensland government announces review of greenhouse gas emission reduction targets’. ABC. https://www.abc.net.au/news/2025-04-08/qld-productivity-commission-lnp-emissions-reduction-targets/105148146.
[95] Hall, James. 2025. ‘Queensland tears up transition targets and will keep coal for longer’. Australian Financial Review. https://www.afr.com/policy/energy-and-climate/queensland-tears-up-transition-targets-and-will-keep-coal-for-longer-20250407-p5lpn7.
[96] Energy Source and Distribution. 2025. ‘Report reveals case to close Queensland’s “unreliable” Callide’. https://esdnews.com.au/report-reveals-case-to-close-unreliable-callide.
[97] Ibid.
[98] Transgrid. 2023. ‘System Security Roadmap’. p 29. https://www.transgrid.com.au/media/avyondr4/system-security-roadmap-2023.pdf.
[99] Ibid, p 22.
[100] Macdonald-Smith, Angela. 2025. ‘Transgrid seeks government support for vital $700m grid investment’. https://www.afr.com/companies/energy/transgrid-seeks-government-support-for-vital-700m-grid-investment-20250314-p5ljly.
[101] Ibid.
[102] Analysis performed using the 12-month rolling average of capture prices for each technology and the generation-weighted price for the whole market, and dividing the technology capture price by the market price to show the change as wind and solar penetration increases. Data was taken from https://explore.openelectricity.org.au/energy/nem/.
[103] Clean Energy Council. 2025. ‘Reports’. https://cleanenergycouncil.org.au/clean-energy-council-reports. Data was extracted manually from the ‘Financially committed generation projects and megawatt capacity (by quarter)’ charts in each Renewable Projects Quarterly Report from Q1 2018 to Q2 2025.
[104] CS Energy. 2024. ‘Construction to start on second CS Energy wind project’. https://www.csenergy.com.au/news/construction-to-start-on-second-cs-energy-wind-project; Telstra. 2024. ‘Telstra boosts renewable energy commitment with Glenellen Solar Farm investment’. https://www.telstra.com.au/aboutus/media/media-releases/telstra-renewable-energy-glenellen-solar-farm; Deutsche Bank. 2024. ‘Deutsche Bank finances the construction of the Goorambat East Solar Farm’. https://www.db.com/news/detail/20240816-deutsche-bank-finances-the-construction-of-the-goorambat-east-solar-farm; Rio Tinto. 2024. ‘Two new solar farms for Gove Peninsula as Rio Tinto works to secure more sustainable power’. https://www.riotinto.com/en/news/releases/2024/two-new-solar-farms-for-gove-peninsula-as-rio-tinto-works-to-secure-more-sustainable-power; Livingston, Katie. 2024. ‘Green light for $1.3B Qld wind farm’. Utility. https://utilitymagazine.com.au/green-light-for-1-3b-qld-wind-farm/; Foley, Ev. 2025. ‘CleanPeak rolls out Moama solar farm to keep city precinct carbon neutral’. PV Magazine. https://www.pv-magazine-australia.com/2025/04/11/cleanpeak-rolls-out-moama-solar-farm-to-keep-city-precinct-carbon-neutral/; ARENA. 2025. ‘RayGen Solar Power Plant Demonstration’. https://arena.gov.au/projects/raygen-solar-power-plant-demonstration/; Axup, Kate, Danielle Jones & Lisa Zhou. 2024. ‘Allens advises Lightsource bp on Capacity Investment Scheme NEM Generation Tender win’. https://www.allens.com.au/insights-news/news/2024/12/allens-advises-lightsource-bp-on-capacity-investment-scheme-nem-generation-tender-win/; Infrastructure NSW. 2024. ‘Barangaroo breaks ground on solar farms’. https://www.infrastructure.nsw.gov.au/news/barangaroo-breaks-ground-on-solar-farms/; Tippet, Harrison & Gillian Aeria. 2025. ‘Victorian government unveils plans for SEC Renewable Energy Park solar project in Horsham’. https://www.abc.net.au/news/2024-11-20/sec-renewable-energy-park-victoria-solar-farm-project-horsham/104624172; Whitby, Reece. 2024. ‘Decarbonisation milestone as King Rocks Wind Farm builder named’. https://www.wa.gov.au/government/media-statements/Cook%20Labor%20Government/Decarbonisation-milestone-as-King-Rocks-Wind-Farm-builder-named-20241224; Vorrath, Sophie. 2022. ‘Trail-blazing community solar and battery project prepares to power up’. https://onestepoffthegrid.com.au/trail-blazing-community-solar-and-battery-project-prepares-to-power-up/; Gameng, Monica. 2025. ‘Delivery partner appointed for $400m Warradarge Wind Farm Stage 2’. https://www.felix.net/project-news/delivery-partner-appointed-for-warradarge-wind-farm-stage-2.
[105] Rio Tinto. 2024. ‘Two new solar farms for Gove Peninsula as Rio Tinto works to secure more sustainable power’. https://www.riotinto.com/en/news/releases/2024/two-new-solar-farms-for-gove-peninsula-as-rio-tinto-works-to-secure-more-sustainable-power.
[106] Carroll, David. 2025. ‘Fortescue begins works at Cloudbreak solar farm’. PV Magazine. https://www.pv-magazine-australia.com/2025/04/16/fortescue-begins-works-at-cloudbreak-solar-farm/.
[107] Deutsche Bank. 2024. ‘Deutsche Bank finances the construction of the Goorambat East Solar Farm’. https://www.db.com/news/detail/20240816-deutsche-bank-finances-the-construction-of-the-goorambat-east-solar-farm.
[108] AltEnergy. 2025. ‘Wind farms quietly pushed ahead into late development stage by new owners’. https://www.altenergy.com.au/newsandviews/show/wind-farms-quietly-pushed-ahead-into-late-development-stage-by-new-owners.
[109] Williamson, Rachel. 2025. ‘Small Tasmania wind project finally begins construction after long delay and political reprieve’. RenewEconomy. https://reneweconomy.com.au/small-tasmania-wind-project-finally-begins-construction-after-long-delay-and-political-reprieve/.
[110] Clean Energy Council. 2025. ‘Quarterly investment report: Large-scale renewable generation and storage’. p 5. https://cleanenergycouncil.org.au/getmedia/258ddf47-4d31-4c80-bea4-f602584ed585/q2-2025_clean-energy-council_quarterly-investment-report.pdf.
[111] Ibid.
[112] Nelson, Tim, Paula Conboy, Ava Hancock & Phil Hirschhorn. 2025. ‘NEM Review: Findings and directions’. NEM review analysis, drawing on AEMO Generation Information, Bloomberg New Energy Finance, and the work and expertise of a range of experts.
[113] The gas plants built with minimal government support shown in Figure 15 from 2010 onwards are as follows: Darling Downs (630 MW) & Condamine (140 MW) in 2010, Mortlake (566 MW) in 2012 and Barker Inlet (210 MW) in 2019. The hydro plants built with minimal government support shown in the chart from 2010 onwards are as follows: Jounama Dam (14.4 MW) in 2010, Jindabyne Dam (1.1 MW) in 2011 and Tumut 3 Power Station Upgrade (150-300 MW) in 2010-2011. Note: Snowy Hydro is government-owned but the hydro projects listed did not receive subsidies – they were built on a commercial basis.
[114] Morton, Adam. 2025. ‘Premier claims WA a ‘renewable energy powerhouse’ but leaked document shows wind and solar projects have “stalled”’. The Guardian. https://www.theguardian.com/australia-news/2025/mar/03/premier-claims-wa-a-renewable-energy-powerhouse-but-leaked-document-shows-wind-and-solar-projects-have-stalled.
[115] Potentia Energy. 2025. ‘Flat Rocks Wind Farm’. https://potentiaenergy.com.au/project/flat-rocks-stage-1-wind-farm/.
[116] Monford Group. 2025. ‘Western Australia’s first and largest DC-coupled BESS and Solar PV Hybrid Project’. https://www.monfordgroup.com/2025/04/04/monford-group-celebrates-the-opening-of-the-cunderdin-hybrid-solar-pv-bess-project/.
[117] Morton, Adam. 2025. ‘Premier claims WA a ‘renewable energy powerhouse’ but leaked document shows wind and solar projects have “stalled”’. The Guardian. https://www.theguardian.com/australia-news/2025/mar/03/premier-claims-wa-a-renewable-energy-powerhouse-but-leaked-document-shows-wind-and-solar-projects-have-stalled.
[118] Morton, Adam. 2025. ‘Premier claims WA a ‘renewable energy powerhouse’ but leaked document shows wind and solar projects have “stalled”’. The Guardian. https://www.theguardian.com/australia-news/2025/mar/03/premier-claims-wa-a-renewable-energy-powerhouse-but-leaked-document-shows-wind-and-solar-projects-have-stalled.
[119] Bowen, Chris. 2022. ‘Capacity Investment Scheme to power Australian energy market transformation’. DCCEEW. https://minister.dcceew.gov.au/bowen/media-releases/capacity-investment-scheme-power-australian-energy-market-transformation.
[120] Miller, Monique. 2018. ‘Climate Finance and Financial Markets in Australia: The CEFC and ARENA’. https://www.cefc.com.au/media/402005/mmiller_alj_v92_pt10.pdf.
[121] CEFC. 2025. ‘Where we invest: Rewiring the Nation Fund’. https://www.cefc.com.au/where-we-invest/investment-focus-areas/rewiring-the-nation-fund/.
[122] CEFC. 2025. ‘Where we invest: Renewable energy’. https://www.cefc.com.au/where-we-invest/investment-focus-areas/renewable-energy/.
[123] National Reconstruction Fund Corporation. 2024. ‘National Reconstruction Fund Corporation’. https://www.nrf.gov.au/.
[124] Read, Michael. 2024. ‘Chalmers’ hidden spending boom to top $87b’. Australian Financial Review. https://www.afr.com/policy/economy/chalmers-hidden-spending-boom-to-top-87b-20241126-p5ktl5.
[125] Premetis, Spiro. 2024. ‘Hands off, the Future Fund is not a political slush pool’. Australian Financial Review. https://www.afr.com/politics/federal/hands-off-the-future-fund-is-not-a-political-slush-pool-20241120-p5ks1x.
[126] Future Fund Management Agency. 2024. ‘Future Fund’s New Investment Mandate’. https://www.futurefund.gov.au/news-room/20241211–Future-Funds-New-Investment-Mandate.
[127] Future Fund. 2025. ‘Future Fund’s New Investment Mandate’. https://www.futurefund.gov.au/news-room/20241211–Future-Funds-New-Investment-Mandate.
[128] Future Fund. 2025. ‘Future Fund and OMERS complete transaction for 9.995% of Transgrid’. https://www.futurefund.gov.au/news-room/20250520—Transgrid-media-release.