This paper outlines the base Indigenous health issues, the key causes, and how they can be rectified.
1. Indigenous health: Introduction
Since its first incarnation in 2008, the Closing the Gap framework has in essence been focused on Indigenous health. Over the final decades of the 20th century an increased focus by government — including the transfer of Indigenous issues from state to federal responsibility, and the controversial Aboriginal and Torres Strait Islander Commission (ATSIC) era — failed to make notable improvement to Indigenous health outcomes.
Headlining these ongoing failures was the very real and inescapably obvious gap in key health areas such as life expectancy. Life expectancy is the primary metric used to measure the health of a population. The massive increases experienced in life expectancy in most developed nations in the 20th century helped facilitate the progress and prosperity seen in their post-industrial society over those decades. As Australia entered the 21st century however, the plight of its original inhabitants was laid bare by an estimated Indigenous life expectancy gap as large as 20 years lower than the overall Australian population.
Following a period of advocacy by key peak Indigenous organisations, a formal Closing the Gap (CTG) framework was eventually adopted by state and federal governments. Headlining this was the commitment by the Coalition of Australian Governments (COAG) in December 2007 to closing the gap in life expectancy. By 2008, COAG had committed to addressing a range of targets (including life expectancy and infant mortality) via the National Indigenous Reform Agreement.
Is the Indigenous health focus where it should be?
Over more than a decade, the Closing the Gap agreement has continually evolved, with success in some areas but not in others. From an Indigenous healthperspective, the gap in life expectancy and infant mortality has remained. Stimulated by these gaps and a range of other indicators where Indigenous Australians remain well behind their non-Indigenous peers, a new National Agreement on Closing the Gap was signed by the National Federal Reform Council and the national Coalition of Peaks Indigenous organisation in July 2020. Once again, health-based targets focused on childbirth and life expectancy are at the forefront.
While the headline targets are the right ones, it has to be asked: is the focus in delivering upon these where it should be? Are we focusing enough on the pertinent root causes of the obvious disadvantage faced by Indigenous Australians? What sits behind lagging life expectancy and ongoing childbirth issues? Is Indigenous health care spending reaching the right places?
This paper triangulates the historical and scientific sub-strata behind Indigenous Australia’s health gaps in an effort to better decode the real reasons for these gaps. Discussion is based on the current Closing the Gap framework’s health targets — Life Expectancy (Outcome 1) and Pregnancy and Healthy Birth (Outcome 2) — with the paper seeking to use these understandings to help illuminate the way forward to more real, root cause-based, outputs and outcomes.
2. Life Expectancy – Closing the Gap Indigenous health Outcome 1
Outcome 1: Close the Gap in life expectancy within a generation by 2031
Supporting indicators:
- All-cause mortality
- Leading causes of death
- Potential avoidable mortality rates
- Prevalence rates of health risk factors
- Rates of accessing/utilisation of health services
The objective of the 2020 National Agreement on Closing the Gap is ultimately “to overcome the entrenched inequality faced by too many Indigenous Australians, so that their life outcomes are equal to all Australians.” The lack of equality in outcomes for Indigenous Australians is no more evident than in life expectancy.
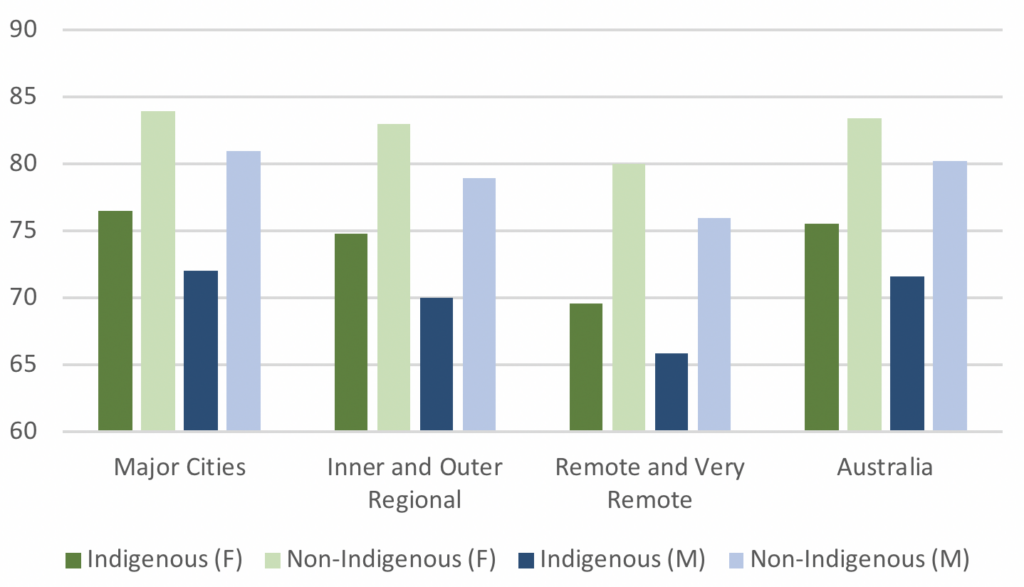
In 2015-2017, mean life expectancy for all non-Indigenous Australians was 80.2 years and 83.4 years for males and females respectively. In Remote and Very Remote areas, it was 76.0 for non-Indigenous males and 80.0 for females. However, mean life expectancy for Indigenous people across Australia was only 71.6 for males and 75.6 for females. In Remote and Very Remote areas, Indigenous Australians were even further behind, with the average male living to 65.9 years the average female living to 69.6 years. The Indigenous life expectancy in those areas is more similar to that in Central Africa than one of the most prosperous countries on Earth.
The variations seen in the health — and ultimately the life expectancy — of Indigenous people were reported on in peer-reviewed literature earlier in 2021. This paper will draw from that review, updating status where possible, and also refer where needed to the Australian Institute of Health and Welfare [AIHW] 2020 report on the Aboriginal and Torres Strait Islander Health Performance Framework to discuss the import of each ‘condition’ as it affects CTG Outcome Area 1 – Life expectancy. Much of the discussion will focus on the Northern Territory and other remote areas where people are often most stressed, as will be seen.
A systemic approach to understanding and addressing Indigenous mortality
Each of the several major organs in the body functions as a self-focused entity, a bodily system, while at the same time working to keep the whole body functioning. Maleficent challenges to, and within, several key systems all contribute to reduced longevity. Table 2 follows below with a bimodal focus: Australia widely at one pole, and the Northern Territory focused at the other.
Figure 1: Years Life Expectancy by Region Type & Indigenous Status (2015-2017)
Source: Australian Institute of Health and Welfare (2020). Indigenous life expectancy and deaths. [online] Australian Institute of Health and Welfare. Available at: https://www.aihw.gov.au/reports/australias-health/Indigenous-life-expectancy-and-deaths & Statista. (2017). Australia – life expectancy of non-Indigenous people by gender and location 2017. [online] Available at: https://www.statista.com/statistics/1125132/australia-life-expectancy-of-non-Indigenous-population-by-gender-and-location/
Table 2 – Factors Contributing to low Indigenous life expectancy rates
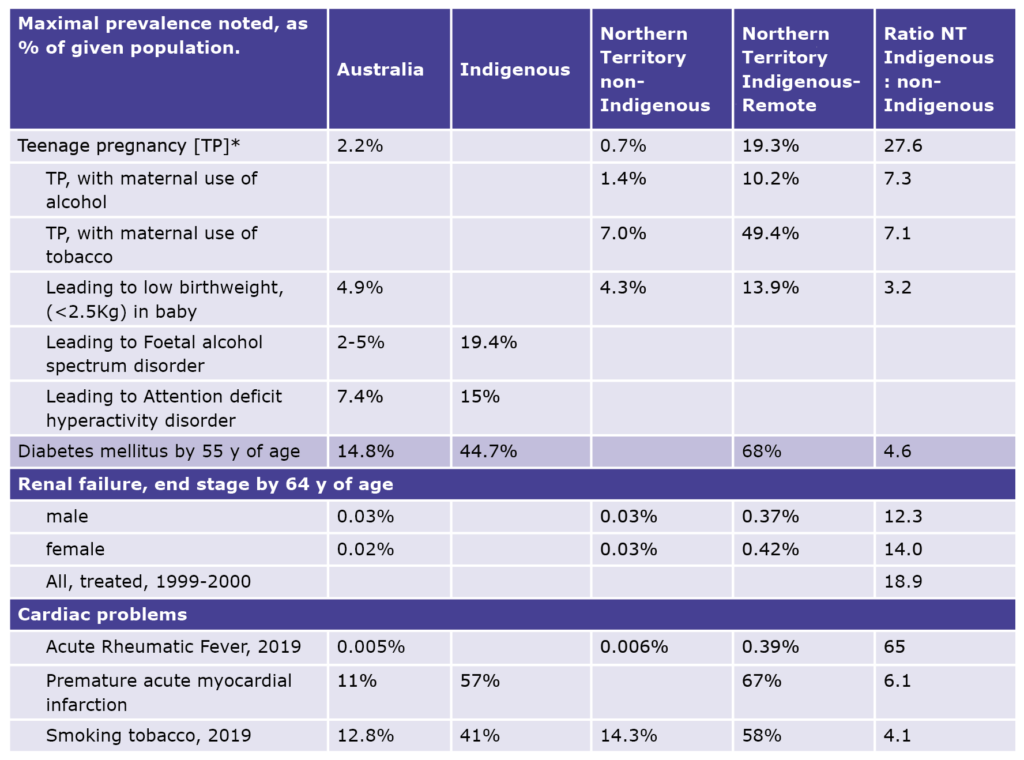
Source: Various.
The efficient operation of four of the major systems below are each critically important to the ongoing health and duration of life.
- Heart
- Kidneys
- Lungs
- Glucose metabolism
While several of the other systems — and one’s brain — are equally vital, and the efficiency of each can be harmed disastrously by disease, they are generally less extensively challenged among Indigenous people than the four listed just above. Each needs comment in order that the gap in life expectancy be better understood and eventually closed.
Hearts and the vasculature
Indigenous people’s hearts and blood vessels are subject to attack from at least three assailants: the outcomes being acute rheumatic fever (ARF) and thence rheumatic heart disease (RHD); myocardial infarction (MI); and in the vessels, hypertension. The enhanced rates of these conditions are the unfortunate product of a wicked combination of socioeconomic, behavioural, and physiological factors. These factors, either in isolation or combined, are a major driver behind the shortened life expectancy of Indigenous people. To help reveal why, we need first to clarify the reasons that make Indigenous Australians so prone to these afflictions.
Infective disease
Although the global burden of ARF and RHD declined dramatically during the 20th century, ARF secondary to infection with the Group A Streptococcus (GAS) is still widely prevalent in the Northern Territory and definitely — but to a lesser extent — in far northern Queensland and Western Australia. From 2013 to 2017 among all Australians, 1,900 people were diagnosed with ARF, 1,776 (93%) of whom were Indigenous. The Northern Territory had the highest such rate, with 973 diagnoses in total, 954 among Indigenous people (98% of all cases), a shocking incidence of 260 per 100,000 Indigenous people.
Worldwide in 2015, the Global Burden of Disease study estimated age-standardized prevalence of RHD to be 444 per 100,000 people for countries with an endemic pattern and 3.4 for countries with a non-endemic pattern. For Australasia, (excluding Oceania), in the entire population, the rate recorded was 2.2 per 100,000 males and 3.2 in females. Australia’s Indigenous people constitute a globally ignored endemic enclave. Their ensuing RHD has produced the largest and youngest cohort of people encumbered by prosthetic heart valves in Australia. It entails a life expectancy reduction of around 15 years.
The great majority of the infecting bacteria in this Australian population are not found in infected tonsils, but in GAS-superinfected scabies skin infestations. Worldwide, the highest prevalence of this impetigo, 49% of the pertinent population, is found in remote Australian Indigenous communities and particularly in children. The prevalence of scabies in remote Indigenous children ranges up to ≥ 60%. In non-Indigenous Australians, the infestation is rare and is also commonly limited to a few digital intertriginous burrows.
How and why do these skin infestations and infections arise? There is uncontested acceptance that they are an inevitable consequence of the combination of massive house overcrowding and the resultant poor living conditions, the latter a difficult to avoid consequence. This combination is seen extensively in remote and very remote Indigenous communities, but rarely in mainstream Australia. It has been quantified. To determine the dwelling size requirements for a given household, Australia utilises the Canadian National Occupancy Standard (CNOS). In 2017, by CNOS rules, 56% of State Owned and Managed Indigenous Housing (SOMIH) in the Northern Territory was overcrowded, but only 7% of similar non-Indigenous public housing. In Australia at large, the latter overcrowding rate was only 4%; the mainland rate in SOMIH outside the Northern Territory ranged from 7.3 to 11.7%. Multiple generations of the Northern Territory Indigenous population do not necessarily choose to — but rather have little option but to — live in the same stock of overcrowded, increasingly decrepit, and ultimately unsafe housing. Comparably, the overall Australian population does not deal with anything resembling these conditions — a contextual factor inextricably linked to the life expectancy gap.
It is now also known that variation in the HLA_DQA1 DQB1 region in the genome is a major genetic risk factor determining one’s propensity for acquiring RHD. Alternative risk and protective haplotypes exist, the risk associated haplotype being common in Northern Territory Indigenous people. Clinically it supports molecular mimicry as the key mechanism in RHD pathogenesis. This finding is of little help clinically but explains why some people are, (and some not), RHD prone. The commonly found Indigenous haplotype in combination with domestic dysphoria is deadly. How these matters might be addressed is taken up below.
Myocardial infarction (Heart Attacks) and Key Risk Factors
Ischaemic heart disease [IHD], leading to acute myocardial infarction [AMI], is presently the leading cause of human death worldwide. In Australia in 2017, it caused 11.6% of all deaths, and among Indigenous people, 11.5%. There is, however, a vast difference in the age distribution of AMI incidence between Indigenous and non-Indigenous Australians, the Indigenous being much younger, and thus myocardial infarction (MI) is also a major causative factor producing the difference seen in life expectancy between the two groups. The difference is most readily seen when remote and very remote Indigenous people are taken as the index group.
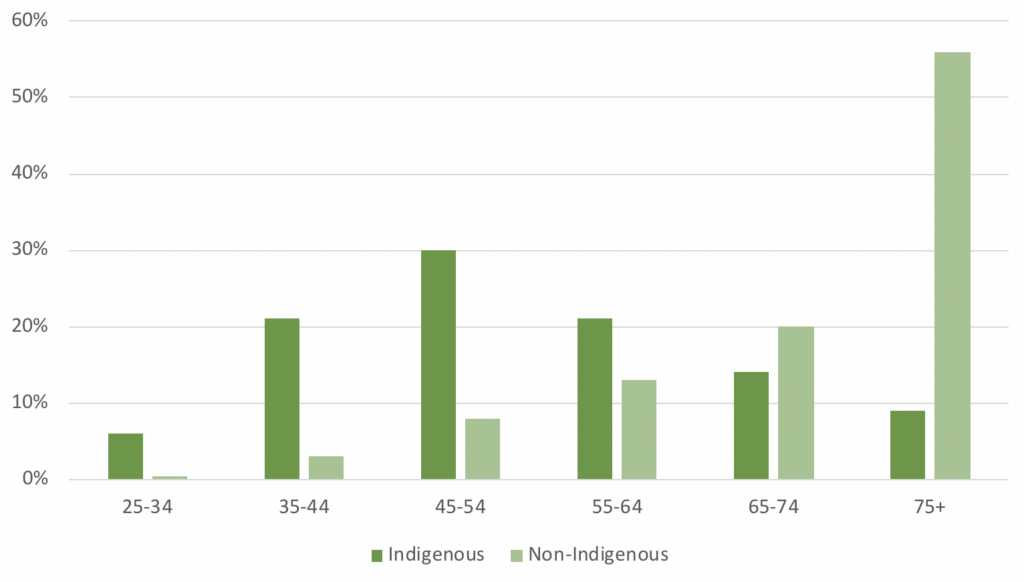
In 2006, the AIHW reported the first ever large-scale study into myocardial infarction in the Indigenous population, utilising 2002 and 2003 hospital and mortality records from Queensland, Western Australia, South Australia and the Northern Territory. It surveyed 242,000 Indigenous people and 9,466,000 non-Indigenous people. Over the two years, 1,196 heart attacks occurred in the Indigenous group and 38,943 in the non-Indigenous. The incident age distribution between the two groups is starkly different, as the following graph shows. Of all Indigenous people experiencing a heart attack, 57% had done so by 55 years of age and 78% by 65. Only 11% of the non-Indigenous population had experienced a heart attack by age 55, and 25% at age 65. The median age for experiencing a heart attack was 50 years among the Indigenous population, and 80 in the non-Indigenous population.
Heart attacks categorised as ‘premature’ in Australia at large are presently the statistical norm in remote Indigenous Australians. While, with contemporary care, most patients survive their first heart attack, it marks the beginning of a more precarious cardiac history which almost inevitably leads to further infarcts and to an early death — more rapidly in the Indigenous than in the non-Indigenous. This is a key driver behind the significant life expectancy differential between the Indigenous and non-Indigenous population, and thus a large and fundamental component of the ongoing Indigenous health gap.
Figure 2 – AMI (Acute Myocardial Infarction, Heart Attack) incidence by age group and ancestry, percentage of total. Australia: NT, Western and South Australia, and Queensland, combined (2002 & 2003)
Source: Mathur, S., Moon, L., Leigh, S. (2006). Aboriginal and Torres Strait Islander people with coronary heart disease:
further perspectives on health status and treatment, summary report. Canberra: Australian Institute of Health and Welfare.
Causes of increased rates of heart attacks in Indigenous Australians
Several underlying causes provoke IHD. They include heritable diseases: diabetes mellitus [DM], dyslipidaemia, chronic kidney disease [CKD] and hypertension. Among habits, tobacco smoking plays a highly significant primary role in IHD generation, damaging arterial walls, but also has a multiplicative interaction with the other major IHD risk factors. Thus, “…if the presence of smoking alone doubles the level of risk, the simultaneous presence of another major risk factor is estimated to quadruple the risk. The presence of two other risk factors with smoking results in approximately eight times the risk of persons with no risk factors.”
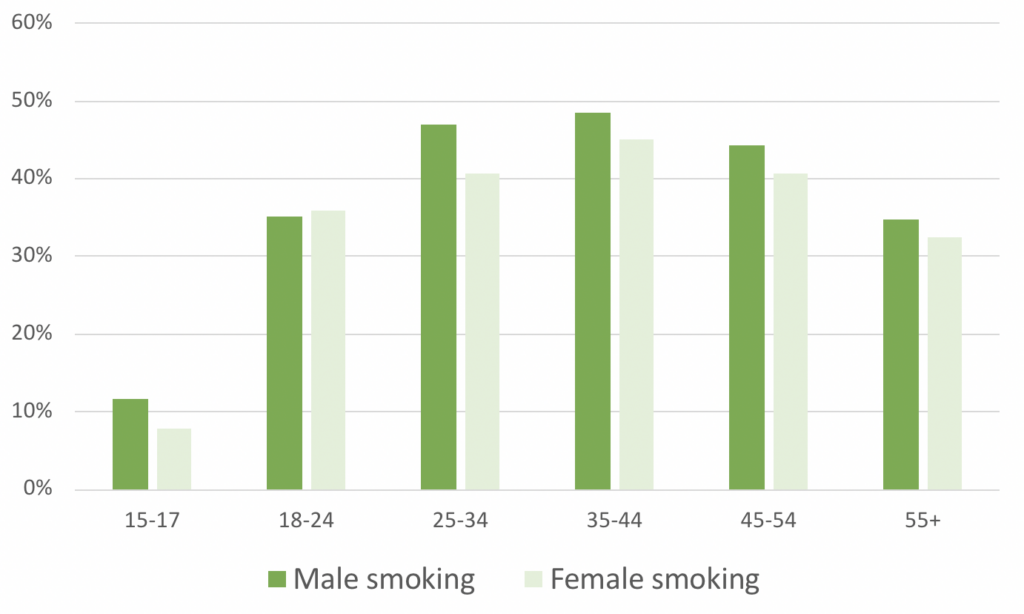
Tobacco may be the most obvious maleficent instrument operative in Indigenous health. Australia-wide Indigenous tobacco usage data for the fiscal year 2018-19 are shown graphically below. At the age of peak usage, 49% of all Indigenous Australian men smoked and 45% of women — though in remote areas marginally more at 52%, the genders combined. The proportion of daily smokers aged ≥18 years in non-remote areas decreased from 48% in 2002 to 35% in 2018–19, but in remote areas the ‘decrease’ was only from 50% to 49%. In contrast Australia-wide, the 2018-19 total population prevalence rate for daily smoking was 12.8%.
Figure 3 – Indigenous daily tobacco use, % by age group (2018-2019)
Source: AIHW (2021). 2.15 Tobacco use. [online] Available at: https://www.Indigenoushpf.gov.au/measures/2-15-tobacco-use#:~:text=In%202018%E2%80%9319%2C%20the%20smoking
The heritable elements in Indigenous people that stimulate their MI outcome’s early occurrence are impossible to delete. However, the environmental and epigenetic factors that aggravate these underlying predispositions can be addressed through the avoidance of tobacco use.
Tobacco smoking thus represents a fundamental root cause of Indigenous people’s disadvantage across the country. It permeates across geographic divides and is one of the most significant discretionary behaviours contributing to increased mortality rates. Its elimination could contribute to a significant increase in the life expectancy of Indigenous Australians by as much as a decade thus decreasing the effective gap between the Indigenous and non-Indigenous populations.
Text Box 1: Smoking in Indigenous communities & Closing the Gap
As discussed in this paper, smoking is perhaps the most prevalent, cross-generational discretionary behaviour influencing Indigenous health outcomes. Smoking rates are linked to a range of socio-cultural factors that have embedded the practice in many Indigenous communities, including, in the opinion of NSW Health:
- Early and ongoing exposure in communities with already high smoking rates leading to the normalisation of smoking.
- Disadvantage, poor education rates and high unemployment.
- Links between smoking and other factors such as housing stress, mental illness, alcohol and other
drug use.- Grief and loss/Sorry Business.
- A communal/sharing based culture.
Consequentially, reducing Indigenous smoking rates has been one of the primary aims of the Closing the Gap framework since it was first established. A range of Indigenous health programs, such as the Tackling Indigenous Smoking (TIS) program, have attempted to deal with the issue nationally.
However, in the first decade of Closing the Gap (2008-2018) smoking rates have only declined 6.4 percentage points to 43.4%. This decline is only just larger (1 percentage point) than the 5.4 percentage point decline in non-Indigenous smoking rates to 15.1%. This suggests that Indigenous-focused anti-smoking initiatives have had minimal impact when the impact of mainstream initiatives is factored into the relative decline.
Sources: NSW Health – Aboriginal Communities and smoking (2020); AIHW – Alcohol, Tobacco & other drugs in Australia (2021)
Hypertension (High Blood pressure)
Hypertension is a mixed bag: cause, effect or both. For example, it can be caused by renal problems, but it also can assault the kidneys. It can remain unobserved until occasionally it finally and near-catastrophically reveals itself with an AMI or a stroke. Its symptoms are variable and common in other conditions — such as headaches and shortness of breath — and thus are not always readily linked to the primary cause.
High blood pressure damages vascular endothelium (the inner membrane lining the arteries) by increasing the haemodynamic pressure as blood flows through the vessel and thence on the membrane, thereby then also by increasing the vulnerability of the arterial wall for exposure to the harmful lipoproteins linked to cholesterol level. This is a vicious, ever more damaging, vortex.
High blood pressure affects the Australian population in the following manner:
• In 2014-2015, 39.8% of all Australians aged ≥ 55y;
• In 2017-2019, 58.6% of all Indigenous Australians aged ≥ 55y;
• In a previously unreported 2000-2019 study of Indigenous people who had suffered an AMI in that decade in the NT’s southern Barkly region
— 89% among all males ≤ 55 y who had had a heart attack, but among the disease free controls (age-matched men attending the same clinic who had no recorded evidence of ischaemic heart disease or of rheumatic fever), 56%; and
— among all similar females, 82% and 63%.
The AIHW believes that in 2011, high blood pressure contributed to 61% of the Indigenous stroke cases, and 37% of the coronary heart disease cases. Unfortunately, the underlying genetics are complex and add little of practical use. As to habits, though smoking tobacco harmfully raises blood pressure acutely, paradoxically it helpfully lowers it chronically. However, smoking induces a vast array of other morbidity, including in the blood vessels; on balance it is better eliminated.
High blood pressure needs finding and treating though, because the great majority has no discernible cause, treatment is targeted at reducing the work-load on the heart. Secondarily, the symptoms themselves, primarily headaches and shortness of breath usually also resolve. In the rare cases where a specific cause is found, then that is also treated. Treatment does not vary ancestrally.
Diabetes
Diabetes is increasingly prevalent in the developed world, including Australia, although the ABS National Health Survey still suggests an Australia-wide known diabetes mellitus (DM) prevalence of only 4.9 % in 2017-2018, 87% of which is type 2.
Text Box 2: Diabetes, Socio-Economic Disadvantage & Closing the Gap Targets
Poverty leads to limited access to healthy food, can impact education levels and understanding of the importance of maintaining a healthy diet and exercising, and can prevent people from seeking medical treatment due to the cost.
Unsurprisingly, research has shown a strong link between socio-economic disadvantage and diabetes. Work published by the Royal Australian College of General Practitioners in 2012-13 found that factors such as unemployment, low education levels, and less access to or utilisation of health services — or both — are directly linked with increased prevalence of obesity and type 2 diabetes. Findings from a 2017 BMC Public Health paper reinforced this by identifying an incremental increase in the prevalence of diabetes as socioeconomic status declines.
With this in mind, it is important to reflect on the focus of a wide range of Closing the Gap targets. Targets do not sit in isolation as health-focused, education-focused, and so on. Many targets are inextricably linked. The prevalence of diabetes in Australia’s Indigenous population is a strong example of this. The socio-economic disadvantages facing a large proportion of Indigenous people are well known. The 17 revised Closing the Gap Indigenous health targets focus on a range of issues that directly impact outcomes such a prevalence of diabetes. Hence, while this paper is ostensibly focused on the Closing the Gap framework health targets, it is important to emphasise that outcomes such as closing the gap in life expectancy are intricately tied to potential improvements in other target areas.
Sources: Reid, J., Anderson, A., Cormack, D. et al (2018). The experience of gestational diabetes for indigenous Māori women living in rural New Zealand: qualitative research informing the development of decolonising interventions. BMC Pregnancy Childbirth 18, 47; Schofield DJ, Cunich M, Shrestha RN, Callander EJ, Passey ME, Kelly SJ, et al. (2014). The Impact of Diabetes on the Labour Force Participation and Income Poverty of Workers Aged 45–64 Years in Australia. PLoS ONE 9(2); Racgp.org.au. (2012). RACGP – A growing problem: diabetes and obesity. [online] Available at: https://foundation.racgp.org.au/research/diabetes-and-obesity#:~:text=Type%202%20diabetes%20is%20far [Accessed 7 May 2022].
Figure 4 – 2017/18: Australians, by ancestry, age, location of domicile and co-morbidity: % with Diabetes Type 2

Source: See Endnotes
In the Indigenous population, diabetes occurs in 7% of Indigenous people in urban areas, increasing to 12% in very remote regions. It was seen in 5% of Indigenous people aged 25 to 34, rising to 39% by age 55. Local data may be more accurately representative of the problem’s extent in far remote locations than are the ABS set. Among Tennant Creek’s Indigenous population, 68% suffered diabetes by age 54. These cases are almost exclusively type 2 diabetes. The type 2 subset is inextricably linked to obesity, with those who are obese being four times more likely to develop type 2 diabetes than those at a healthy weight.
These diabetes sufferers’ lifetime hyperglycaemic (high blood sugar level) exposures are very prolonged and tenfold that of other Australians. How much this contributes to the shortening of Indigenous lives is difficult to quantify; it is likely vast. The diabetes seen among Indigenous people has gestational, genetic and environmental drivers the resolution of which will be pivotal to closing the life expectancy gap.
The relative risk of diabetes in later life in all humans doubles at birthweights around 2kg, with such outcomes not uncommon in Indigenous pregnancy. See Section 3 for more analysis of pregnancy and healthy births.
As to genetics, a pertinent genome-wide search for susceptibility genes to type 2 diabetes in Indigenous people was begun around 20 years ago and has now been significantly advanced by the team of researchers at the University of Queensland Medical Faculty. Their research has found variations in the gene encoding the enzyme ceramide synthase 6, which are associated with type 2 diabetes in a large proportion of the Indigenous population. These associations were successfully replicated in an independent collection of Indigenous Australian type 2 cases and controls, thus demonstrating the relative ubiquity of the mutations.
The fine detail of how these mutations play out metabolically is still being investigated, though it is clear that the findings favour Neel’s hypothesis of the thrifty genotype — the theory that certain populations were evolutionarily geared to increase fat storage when food was abundant, thus providing a survival advantage in subsequent times of food shortages. However, with contemporary Western lifestyles, it is thought the genotype can cause obesity and type 2 diabetes. Indeed, Diabetes Australia observes, “Aboriginal … people [now] live different[ly] to how they used to live. People living the old way were active, leaner and fitter, … eating healthy food, bush tucker, [rather than] … fatty, salty, sugary foods.” Contemporary Indigenous people may thus be yet further afflicted by the challenge from often sweet and fatty European diets interacting with genetic predispositions from pre-European settlement.
All these causes, gestational, genetic and habitual, interact to produce the grossly abnormal diabetic outcomes seen in Australia’s Indigenous people. Each, when it is present, is a predictably operative root cause for diabetes, that makes an extremely efficient ‘gap enhancer’.
No one can control their mother’s actions prior to or during pregnancy, nor has one any choice of one’s genomic inheritance. However, if one or both of those potentially maleficent influences governs one’s health then it is common sense that people with such predispositions take care to not further aggravate the problem — inherited, delivered, or both.
Type 2 diabetes itself aggravates management of the problem. It is an initially invisible killer, producing no symptoms for up to several years while harming the body silently at critical points in critically vital systems. In Australia’s overall Indigenous population, the possibility of it being operative needs to be considered by clinicians and by Indigenous people themselves. Based on genetic disposition, all Indigenous Australians need to carefully manage their diet, carefully evaluating the cost/benefit ratio of European food before they consume it. And if an Indigenous Australian is diagnosed with diabetes, they need to maintain diligent practices to safely manage the disease.
Lungs
By comparison with the systems reported on just above, the lungs are minor players in Indigenous health. However, two lung diseases that disproportionately impact Indigenous people must be briefly discussed.
Bronchiectasis
Bronchiectasis, caused by chronic bacterial or viral lung infection and inflammation in infancy, is characterised by dilated bronchi with thick walls. It is now rare in developed countries, except in people with cystic fibrosis.
In the Northern Territory, Indigenous children suffer lower respiratory tract infections far more frequently than do the non-Indigenous and are more often hospitalised. Bronchiectasis consequentially ensues. The estimated prevalence of bronchiectasis in Indigenous children <15 years old is 1,470 per 100,000 – 40 times greater than that in non-Indigenous populations (35 per 100,000). Although recent detailed comparative data as to outcomes may be lacking there is likely to be little change from those reported for the 1991-1995 datasets we have available. During this period among Indigenous children the respiratory disease death rate for Indigenous children from birth to age 4 was 41.8 per 100,000 for males and 69.0 for females. Among the non-Indigenous population in the Northern Territory, and among all Australians in the same period, the respective death rates were 7.6 and 4.9 in males, and 3.9 and 4.2 in females, the disparity some tenfold.
As to root causation, Chang recites the usual suspects: ”health is closely linked to socioeconomic factors… An increased risk of acute lower respiratory tract infection is associated with greater numbers of house occupants, damp housing, … malnutrition, and inadequate water supply.” As has been well established, many Indigenous households in the Northern Territory are overcrowded, thence squalid, and hence a causative factor in the increased morbidity rates that sit behind the life expectancy gap.
Lung cancer
Later in life, contemporary tobacco smoking causes carcinoma (cancer) in the lung, typically leading to an early death. Lung cancer is twice as common in Indigenous people than in the non-Indigenous population. Between 2009 and 2013 inclusive, thus, the Indigenous age-standardised lung cancer incidence rate in Australia’s most remote areas, including the Northern Territory, was 82 per 100,000 people. Meanwhile the mortality rate was 62 per 100,000 (2011-2015). The non-Indigenous rates were respectively 44 (incidence) and 30 (mortality).
Interestingly, despite significantly greater exposure to cancer-causing tobacco than their non-Indigenous peers, Indigenous Australians in remote areas do not suffer proportionately high rates of lung cancer. Why is this the case? The answer appears to lie in the natural history of lung cancer: 71% of such cancerous neoplasms emerge from >65 years of age, by which age only 3.8% of all remote Indigenous people remain alive. Ironically, the earlier deaths experienced by this group from a range of other causes removes them from exposure to the longer-term effect of tobacco’s link to cancer.
Renal (Kidney) Disease
Kidney health may also be one of the most significant reasons behind the current Indigenous life expectancy gap. Chronic Kidney Disease (CKD) is caused by a range of well-established pre-existing health and environmental factors that impact much of Australia’s Indigenous population. CKD leads into End Stage Kidney Disease (ESKD) and consequentially an early death. A range of factors can impact the kidneys throughout a person’s life, including: preterm birth; the Group A Streptococcus mentioned above as causing rheumatic fever and which can also initiate glomerulonephritis (destructive inflammation of the kidney’s blood filters); the effects of other diseases, principally diabetes and high blood pressure; and by environmental challenges including tobacco smoking and alcohol consumption — all issues that feature prominently in the lives of remote and very remote area Indigenous Australians.
In 1998, research found that signs of kidney disease (such as albuminuria) in Indigenous peoples were “evident in early childhood and increased dramatically with age; 26% of adults had microalbuminuria and 24% had overt albuminuria. All renal failure developed out of a background of overt albuminuria. [It] … was significantly correlated with the presence of scabies at screening, with a history of poststreptococcal glomerulonephritis, … [and] with increasing … blood pressure, glucose, … and lipid levels, and with evidence of heavy drinking.” Most of these have been discussed above, with more information also available in the most recent Northern Territory Renal Services Strategy Report
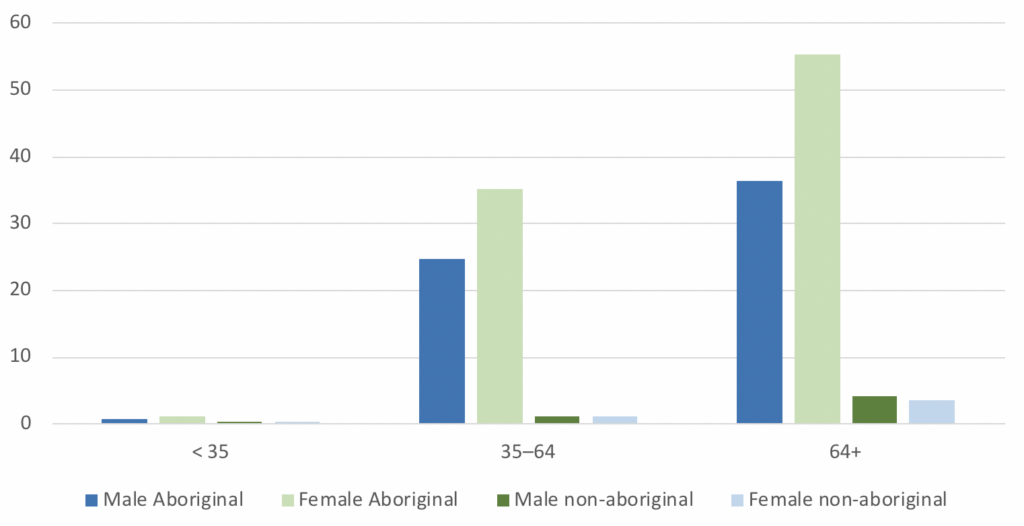
In the Northern Territory’s Indigenous population, kidneys are more likely to fail in general, to fail earlier, and to fail more rapidly and more acutely than those of non-Indigenous population. The stark data from 2013’s end can be seen below (Figure 5), and worsening morbidity is predicted in the next decade.
Treatments for Kidney Disease
Among Indigenous people with ESKD, approximately 20% opt for ‘natural history’: that is, they remain untreated. Most of the remainder haemodialyse (use of a machine to filter and clean blood). By 2023, it is expected that 953 Indigenous people will haemodialyse in the Northern Territory. This represents 94% of the 1,015 expected cases in the jurisdiction — some 1,500 per 100,000 Indigenous people. The Northern Territory’s median survival rate for such patients beginning dialysis in 2005-09 was 6 years. However, given the vastly different, earlier, onset pattern of ESKD seen in the jurisdiction’s Indigenous population, this 6 years does little to extend overall life expectancy.
Renal transplantation in the Indigenous population is also uncommon. In 2016, 1,035 kidneys were transplanted in Australia. Indigenous patients received just 34 of these transplants (3.3%). Across the past decade, the percentage received annually by Indigenous patients remained at approximately 3% of the total — well below the proportion of kidney diseases sufferers who are Indigenous.
Implications for Closing the Life Expectancy Gap
Kidney disease is yet another Indigenous health factor eroding the life expectancy of Indigenous Australians. While some of the causes of kidney disease are unavoidable, behavioural and environmental factors must be addressed to limit the impact of CKD and ESKD on the Indigenous population and close the life expectancy gap. There are a range of manageable harmful influences (such as tobacco smoking and excessive alcohol consumption) that govern one’s health, with the duty of self-care reverting to the individual to control these. Progressive renal failure is usually not symptomatic until near end-stage. It is the second silent Indigenous health killer, some thirtyfold by comparison with the non-Indigenous population. This can lead to death anywhere between 10 and 30 years sooner for Indigenous Australians. Thus it must be addressed proactively, well before clear symptoms arise.
Figure 5 – Prevalence of End Stage Kidney Disease per 1,000 people, by ancestry, gender and age (2013, Northern Territory)
Source: Li, L., Guthridge, S., Li, S.Q., Zhao, Y., Lawton, P. and Cass, A. (2018). Estimating the total prevalence and incidence of end-stage kidney disease among Aboriginal and non-Aboriginal populations in the Northern Territory of Australia, using multiple data sources. BMC Nephrology, 19(1)
3. Pregnancy and Healthy Birth – Closing the Gap Indigenous health Outcome 2
Outcome 2: By 2031, increase the proportion of Aboriginal and Torres Strait Islander babies with a healthy birthweight to 91 per cent
Supporting indicators:
- Proportion of mothers who smoke during pregnancy by age groups
- Proportion of mothers who consume alcohol during pregnancy by age groups
- Proportion of pregnant mothers with a pre-existing health condition
- Use of antenatal care by pregnant women
- Proportion of pre-term births
The second of the Indigenous health targets featured in the revised Closing the Gap framework embraces pregnancy and childbirth. A range of socio-economic factors impact this outcome and, as with the life expectancy target, it is inextricably linked with several of the 16 other targets in the framework. Most importantly, this target is undeniably a subset of Target 1, with improvements in pregnancy and subsequent healthy childbirth likely to play a major role in closing the life expectancy gap. To better understand the nature of the pregnancy and childbirth target, it is important to investigate the factors behind successfully achieving these outcomes.
Understanding healthy pregnancy and childbirth
Birthweight, Pre-Term Births & Teenage Pregnancy
Successful pregnancy is predicated on at least 37 weeks’ foetal residence in utero. Premature delivery and its inevitably-associated low birthweights have long been known to complicate pregnancy in women under approximately 18 years of age, irrespective of ancestry, and to burden the infant with ongoing morbidity across most of the body’s organ systems. These harmful effects are aggravated by maternal smoking and alcohol consumption during pregnancy.
Mean birthweight at term (38 to 42 weeks’ gestation) in European women is approximately 3.5 Kg, though the range from 2.5 to 4.5 Kg is accepted as normal. Infants from Asian ancestry are slightly lighter. Most infants add 1 Kg to their body mass in the last 4 weeks of gestation in utero. A birthweight less than 2.5 Kg thus constitutes a low birthweight and will occur with most deliveries at less than 37 weeks gestation.
Data here are available from both the AIHW and several sub-federal jurisdictions across Australia, though varying in content and extent because of different collection methodologies across those jurisdictions. Outcomes in the Northern Territory are the worst, and these are thus used as a baseline for comparison. Obviously however, when trying to explain causation, the broader data set must also be deployed where possible to permit assessment from that wider perspective.
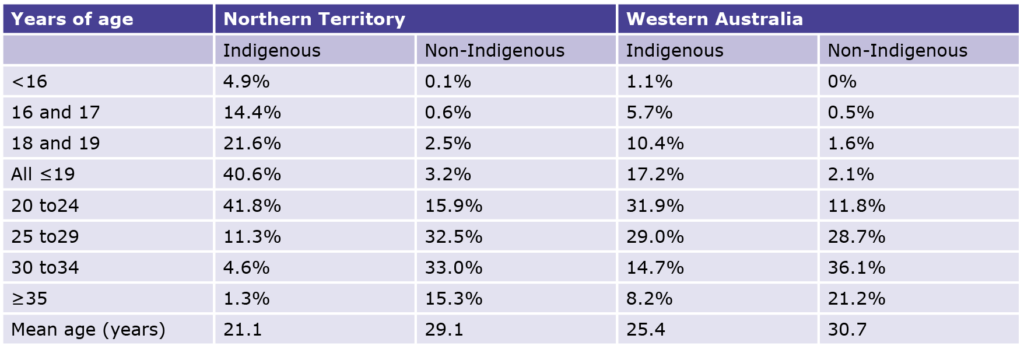
The 2016 Northern Territory Midwives’ data (See Table 4) massively finesse the analysis in that jurisdiction. They reveal that a significant number of Indigenous women begin conceiving before the legal age of intercourse, 16 years across Australia. Some conceive at as young as 13, and by 24 years of age, 83% have delivered an infant, with more than half having had two children by this age. By comparison, only 19% of non-Indigenous women in the Northern Territory have delivered a child by age 24. Data are also available from Western Australia, though not sub-classified at less than 16 years of age.
Table 4 – Northern Territory, first-time mothers in 2016, age at delivery, by percentage. Western Australia, % of women delivering by age group.
Source: Li L, O’Neil L (2019). Mothers and Babies 2016: Northern Territory Midwives’ Collection. Darwin: Department of Health & Commissioner for Children and Young People WA (2014). The State of Western Australia’s Children and Young People – Edition Two, [online] Available at: https://www.ccyp.wa.gov.au/media/1154/the-state-of-was-children-young-people-behaviours-risks-93-births-to-teenage-mothers.pdf
Table 5 – Birth Term and Weight Data, Northern Territory (2016)
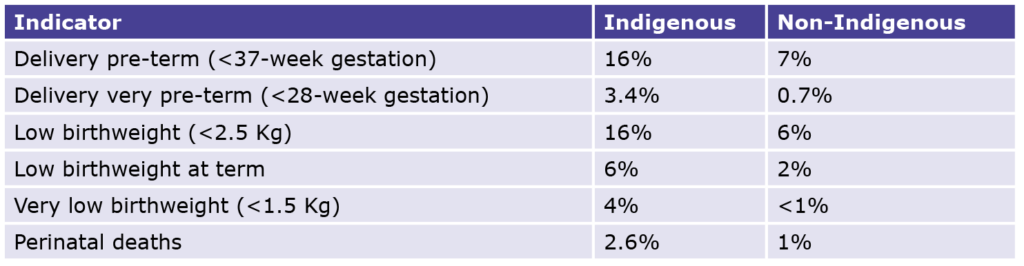
Source: Li L, O’Neil L (2019). Mothers and Babies 2016: Northern Territory Midwives’ Collection. Darwin: Department of Health
Table 6 – Low birthweight live born singleton infants % (2017)
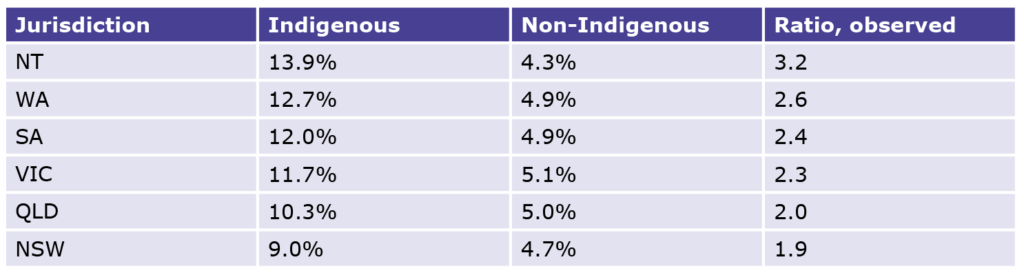
Source: AIHW. (2021).1.01 Low birthweight / Data. [online] Available at: https://indigenoushpf.gov.au/measures/1-01-low-birthweight/data#DataTablesAndResources
Among all women delivering in the Northern Territory in 2016, Indigenous mothers fared less well than non-Indigenous mothers. Comparing a key range of outcome statistics for the two groups provides a revealing insight into the Indigenous health discrepancies (See Table 5).
The outcomes seen here confirm the observation noted above and give a stark indication of where progress currently stands in relation to Closing the Gap Target 2. The prevalence of both pre-term delivery and low birthweight in NT Indigenous women is the same at 16%. Pre-term delivery dooms the infant to be of low birthweight and therefore to be at increased risk of experiencing other health issues. Low birthweight picks up the effect of premature delivery, to which juvenile mothers are prone, as well as low birthweight at term from other causes (e.g., smoking) and integrates the outcome. It is a useful cross-cause identifying surrogate marker but will benefit from further analysis of supporting data.
The AIHW focuses its data on birthweight. It gives the Australia-wide 2017 incidence of low birthweight by sub-federal jurisdiction. At 13.9% of births, Indigenous women in the Northern Territory are clearly thus the most afflicted. Western Australia and South Australia rank second and third. New South Wales, the state that has typically performed the best over the various iterations of Closing the Gap, had the lowest percentage of low birthweights among Indigenous infants. The outcomes, by jurisdiction can be found in Table 6 below.
The non-Indigenous women appear to be members of a tightly described cohort with probably similar heritage, habits, and environmental input factors that all lead to tightly similar outcomes.
Contrariwise, the Indigenous women’s outcomes, as well as being from two- to three-fold worse than their non-Indigenous peers, also show a modestly wider spread, suggesting that the array of environmental factors are influencing outcomes across the different jurisdictions at varying intensity. Reasons for this may include the greater concentration of Indigenous Australians in Major Cities and Inner Regional areas in states such as New South Wales (83% of Indigenous women) and Victoria (86%), versus the larger proportion of Indigenous women living in Remote and Very Remote areas in the Northern Territory (79%) and Western Australia (38%).
Table 7 – Indigenous to non-Indigenous Ratio of % of all Deliveries in Women aged <19 years. (QLD figure is <20 years.)

Source: See Endnotes
As noted, data reporting the stratification within teenaged pregnancy are less widely available from other jurisdictions. Data for one marker are available over the past decade from five jurisdictions with which to construct the ancestral ratio, Indigenous to non-Indigenous, of the percentage of all deliveries to women aged under 19 (See Table 7 above).
The pattern as between juvenile pregnancy and birthweight matches. The Northern Territory stands out, with Indigenous women there between two and three times more likely to have a pregnancy by age 19 than Indigenous women in other jurisdictions. However, those in all the other cited jurisdictions still become pregnant at twice the rate of non-Indigenous Australians.
Exploring contextual factors impacting birth outcomes
Employment and Education rates
Employment
The Northern Territory is home to the greatest geographical concentration of remote-dwelling Australian Indigenous people in its least populated sub-federal jurisdiction. In the Northern Territory, and also far northern Western Australia and Queensland, life in far remote communities is vastly different even from their linked regional cities such as Darwin, Broome or Cairns. Importantly, life is even more challenging for the Indigenous population in remote areas compared to the non-Indigenous population in the same remoteness categories. Jacinta Price’s 2021 CIS report described such remote communities as “worlds apart” from the rest of Australia.
ABS Census reports publish data reporting both employment status and educational achievement and other government departments attempt to clarify definitions, several cited below.
Gainful employment in remote and very remote Indigenous communities, except for several ‘service’ trades and professions — shop-keepers, teachers, clinicians, police — is virtually non-existent. (See Figures 6 & 7). In very remote communities, the overall Indigenous unemployment rate is 29% — ten times the rate for non-Indigenous people in this region type. The true extent of the issue, however, is laid further bare when the workforce participation figures are considered. In very remote areas across Australia, 62% of the working age Indigenous population is not even attempting to find work, nearly twice the non-Indigenous figure for very remote areas (33%). Australia–wide, just 18% of working age Indigenous people are not in the labour force. When the figures for unemployment and labour force non-participation are combined, nearly three quarters of working aged Indigenous people in very remote Australia are not working.
Figure 6 – Unemployment – % of Labour Force (2016, Aged 15+)
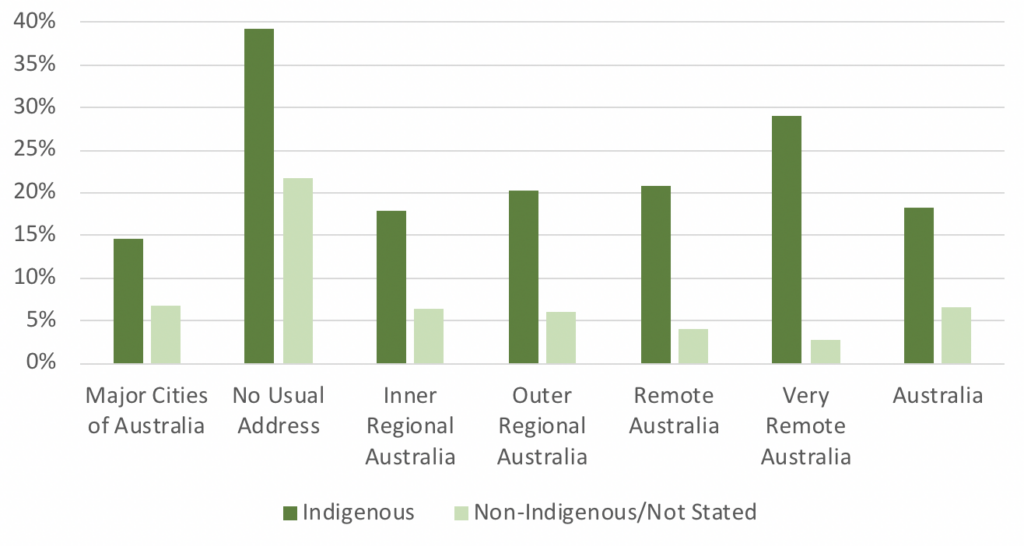
Source: ABS Census Table Builder (2016)
Figure 7 – Not in Labour Force % (2016, Aged 15+)
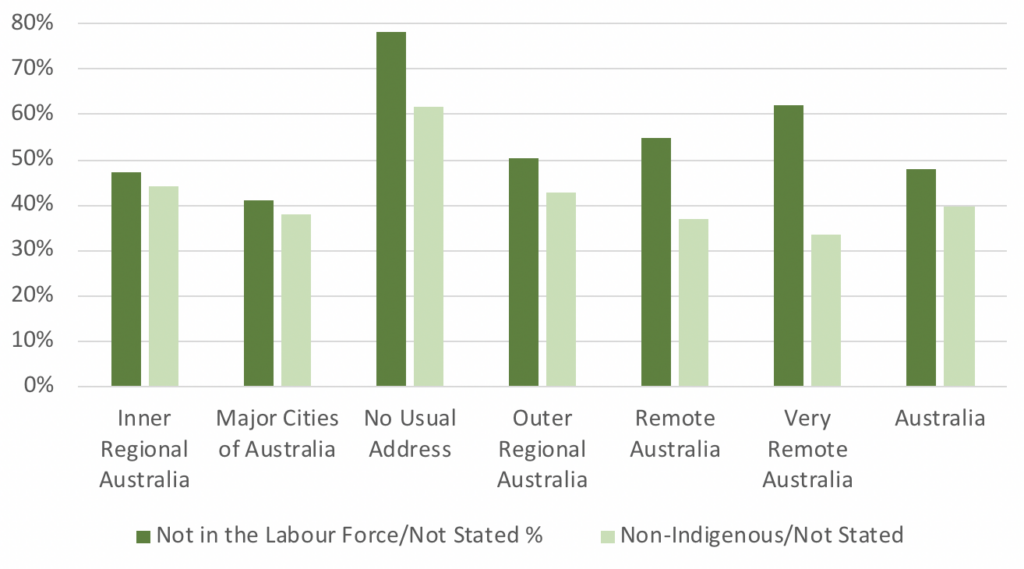
Source: ABS Census Table Builder (2016)
Focusing on a sampling of far remote communities from the NT and three states, a median of only some 12% of the working-aged Indigenous people there worked at full-time equivalence. Among non-Indigenous people there, the converse holds, or better. The full extent of the issue is further exposed when the ABS data are interrogated to reveal that in those far remote areas sampled, 63% of that Indigenous population did not consider itself obliged to work. Australia-wide, the ABS thus categorised 44.3% of Indigenous people as simply not “in the labour force”.
Consequently, the great majority of that working aged population depend instead on income support payments and, moreover, are seemingly not compelled to relocate to where work might be more readily available.
Education
These Indigenous health issues are further compounded by poor Indigenous school attendance rates in remote and very remote areas. School attendance rates have been a major problem area in the various iterations of the Closing the Gap framework. Indeed, rates have not improved in recent years, and in some cases have even declined.
Figure 8 (see below) gives us a telling insight into the situation. Most urban and even rurally-domiciled Indigenous children complete up to Year 10 and many go on to acquire TAFE-based qualifications. However, university degrees still elude most. The situation is profoundly worse in remote and very remote areas, where over a quarter of Indigenous people don’t have an education past Year 9, and just 3% have a bachelor’s degree or greater.
Figure 8 – Highest Level of Educational Achievement by Indigenous Status 7 Remoteness (2016)
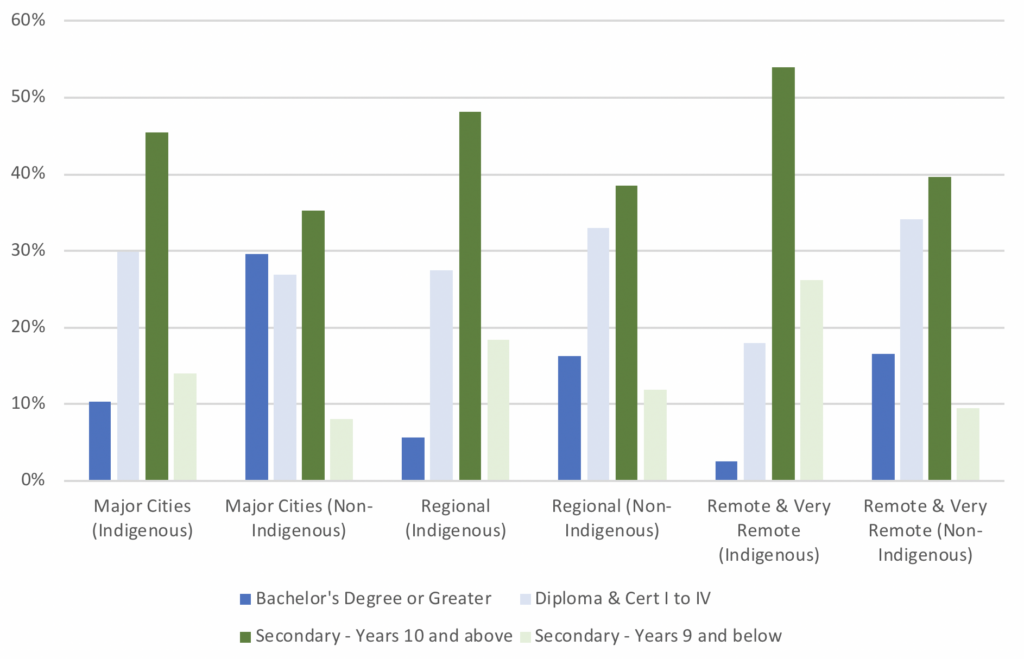
Source: ABS Census Table Builder (2016)
The Centre for Independent Studies’ recently published report ‘Mind the Gap: Understanding the Indigenous education gap and how to close it’ provides a further insight into education in remote Indigenous communities. Author Glenn Fahey found that: “18 per cent of Indigenous students can be identified in an educationally vulnerable group by Year 3. They are mostly located in remote locations, come from families with parents who are not employed, from a non-English speaking background, in relatively small schools, and in a majority-Indigenous school.”
Analysing data from The Australian Curriculum, Assessment, and Reporting Authority (ACARA), Fahey has established the proportion of various factors to which the Year 3 disparity can be attributed. Nearly a third (31%) remain unattributable (i.e. linked with “unmeasured factors”). Among the attributable factors he considers “significant” are the pertinent parents’ schooling (13%), parents’ post school education (22%), father’s occupation (5%) and the child’s own school attendance rate 15%. In 2021, the primary school aged attendance rate for Indigenous students in very remote areas was only 50% in the sampled 8 weeks in term 1. By comparison, attendance rates in the Darwin Region were 78%. He further notes that only “around 19 per cent of Indigenous students in remote schools attends 9 out of 10 school days — the threshold at which students’ learning is adversely impacted by non-attendance.” Data from New South Wales, a state often leading the Gap improvement race, now shows that school attendance rates have not improved in recent years, and in some cases have even declined (See Figure 9).
Poor school attendance rates are particularly significant regarding teenage pregnancy and the above-noted Indigenous health risks to children. Indeed, ongoing attendance at school is associated with a whole range of beneficial socioeconomic outcomes. Poor school attendance rates have been linked with an increased likelihood of teenage pregnancies, even in Britain where a study from 2004 to 2010 found a link between girls who skipped school and the likelihood of having had a pregnancy by age 19, at a ratio of 3.5:1. Extending schooling and postponing the age of first conception clearly go hand in hand, and need addressing as part of the gap closing task.
Figure 9 – Indigenous School Attendance Rates % (2015-18, New South Wales)
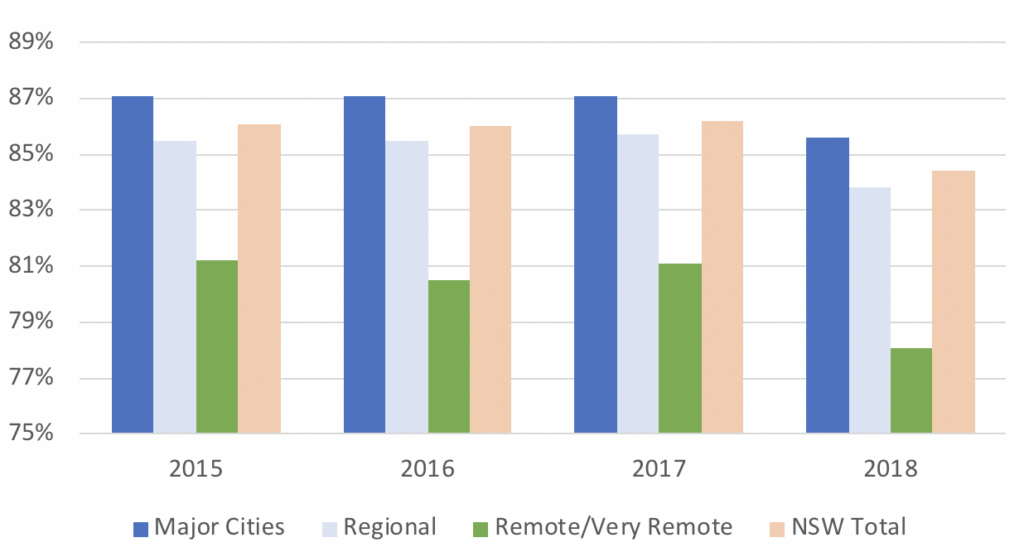
Source: Centre for Education Statistics and Evaluation NSW Database (2019)
Alcohol and Tobacco use
The AIHW notes that in all mainland Australia a “multivariate analysis of perinatal data for singleton births for the period 2015–2017 indicates that for full-term births, 47% of low birthweight births to Indigenous mothers were attributable to smoking, compared with 12% for non-Indigenous mothers.” It adds that “… if the smoking rate among Indigenous pregnant women was the same as that of non-Indigenous mothers, the proportion of low birthweight babies could be reduced by 33%.”
While such causation studies can provoke scepticism and need to be assessed carefully, Northern Territory Midwives’ data also note that 49.4% of Indigenous women self-reported smoking tobacco before 20 weeks gestation, and 10.2% drank alcohol at the time of their first antenatal visit. By comparison, among NT non-Indigenous women, 7% smoked and 1.4% drank alcohol.
In all other Australian jurisdictions, pregnant Indigenous mothers also smoke far more commonly than non-Indigenous mothers, ranging from 43% in all three eastern states to 48% in South Australia. Significant variation also correlates with remoteness. The AIHW reports that “… smoking rates during pregnancy for Indigenous mothers ranged from 38% in Major cities to 53% in Very remote areas. For non-Indigenous mothers … 10% in Major cities to 16% (sic) in Inner regional areas …” Maternal smoking impedes the growth of the foetus in the womb, with consequent low birthweights and their attendant sequelae; it increases the risk of subsequent lung complications, and the sudden infant death syndrome (SIDS) in the infants.
Prenatal alcohol exposure is a significant risk factor for neurodevelopmental vulnerability. It undoubtedly places children at risk for Fetal Alcohol Spectrum Disorder (FASD), manifesting in motor skill deficits and inducing the Attention Deficit Hyperactivity Disorder (ADHD). The Australian National Health and Medical Research Council recommends not drinking alcohol at all during pregnancy, or before conception, as the safest option for women who are pregnant or planning a pregnancy. While there is a significantly higher proportion of Indigenous women who do consume alcohol in pregnancy than among the non-Indigenous, the AIHW looks less closely here and opines that “Large, population-based studies are [still] needed to strengthen the evidence base.”
Premature delivery as a result of these issues predisposes the child to diabetes (the life-time risk doubling at birthweights around 2kg) and significantly increases the risk of renal failure. It interrupts the development and maturation of the kidneys during the critical third trimester growth period during which more than 60% of nephrons (the functional components of the kidney) are formed, thus resulting in a permanently lower nephron endowment than normal. Lower nephron numbers in turn are associated with the development of hypertension and progressive kidney disease later in life.
The low birthweights that affect a high proportion of Indigenous babies in remote areas, but also to a lesser extent across Australia, thus seem to have much of their root causation explained by the two provocative challenges identified here: teenaged pregnancy and related maternal use of tobacco and alcohol.
None of the consequent maleficent outcomes is inherited and, as noted by the evidence above, each may prime the surviving child for an ongoing disadvantaged life. All can be ameliorated by deliberate interventions, such as the parents choosing not to begin a family so young and by the mother refusing to combine pregnancy with either tobacco or alcohol. This reinforces why Target 2 of the latest Closing the Gap framework is so important. The ongoingly high prevalence of these issues has a major impact on an Indigenous Australian’s life before they are even an independent being. Children exposed to these factors are in essence being set up to fail. Resolving such pregnancy-related issues is thus imperative to closing the Indigenous health gap.
4. Addressing the Gap – Integrating health and socio-economic causes of disadvantage
A Note on Data and Measurement
We have discussed above the inextricable Indigenous health link between the pathophysiological aspects of disease and a person’s environment: physical, social, economic. All these environmental aspects can and do interplay with disease, its causes, and the impacted person. They have a profound impact on Indigenous health Targets 1 and 2 of the current Closing the Gap framework.
The currently deployed gap monitoring approach, assessing improvements (i.e. gap reduction) within each of Australia’s sub-federal jurisdictions, and as a national total, begins the assessment task but remains flawed. This is principally because it does not stratify sufficiently finely. It may mask both improvements in some sub-populations and failures in others.
It may leave some successful areas unrewarded while giving praise to what actually remains failure. Health data also often focuses on the specific occurrence of illness and disease rather than their socio-economic causes. The need for a deeper level of reporting, and thence assessing Indigenous health outcomes has been recognised by the Productivity Commission, and the possibility of meeting that need has been foreshadowed:
“In assessing progress since the baseline year for these… targets, it is also important to keep in mind that the data are reported at an aggregated level (national, state and territory) and outcomes may be very different at lower levels of geography and or for people with different characteristics. Disaggregated data for targets and supporting indicators will be incorporated iteratively in future reports.
[In particular,] Additional disaggregations required for future reporting [include]:Remoteness areas, Socioeconomic status of the locality, Disability status, … Level of education [and] Type of employment – part-time versus full-time.”
Housing, economic participation and the future of remote communities
Housing and economic participation are the most significant contemporary socio-economic factors that link with, and modulate, the adverse health outcomes targeted by the Closing the Gap framework. These matters unequivocally go to the deepest causative root of disadvantage that can be identified.
Housing issues affect a wide range of Indigenous peoples across Australia, and thus housing is unsurprisingly the subject of its own specific target in the framework: Target 9. Delivering on this target will be key to delivering on the inextricably linked health targets. When Indigenous housing issues are combined with genetic propensity to the pertinent disease, the Indigenous population becomes particularly disadvantaged.
A recent complete overview of remote Indigenous housing issues is the 2006 work by Baillie and Wayte, Housing and health in Indigenous communities. They summarise the shocking state of housing stock, calling for three essential reforms:
- Better housing: housing that meets agreed standards, is appropriate to the needs of Indigenous people, and contributes to their health and well-being;
- Better housing services: services that are well managed and sustainable;
- Growth in supply: growth in the number of houses to address both the backlog of Indigenous housing needs and emerging needs of a growing Indigenous population.
It is important to ask why — and how — this housing predicament still exists well into the 21st century in one of the world’s most advanced economies. In February 2016, a Parliamentary Inquiry into housing in Indigenous Town Camps was established by the Northern Territory government. It found that the various governments over the years had failed to provide an efficient and effective public housing service to Indigenous people living in Northern Territory Town Camp communities and commissioned from Deloitte a major review of all 43 such Indigenous communities in the jurisdiction.
Deloitte’s report, Living on the edge, is now publicly accessible. It delineates the millions of dollars of work needed to restore the examined housing stock to an acceptable, healthily habitable, level, but it also makes a much more profound judgement call, based precisely in the application of the problem’s perceived and grasped root cause. The report’s findings are summarised as follows:
- Building new housing stock in Town Camps will provide only a short-term fix, and may perpetuate social issues in the longer term;
- Without long-term integration of Indigenous communities into the economy, the socio-economic issues in Town Camps will remain;
and thus) - There is need to incentivise and enable Town Camp residents over time to relocate to economic centres that are expected to offer a greater diversity and sustainability of employment opportunities and investment in social housing in these regions;
- We need to invest in solutions to build long-term economic participation.
Deloitte’s researchers have grasped a critically vital point — economic participation is the bedrock of solving housing (and consequentially health) issues. Their proposal to transition remote Indigenous communities into economic centres is a sensitive one. However, it stands true that if we are to close the health gap, and indeed many other of the gaps under the new Closing the Gap framework, the country’s remote Indigenous communities must be detached from their currently inhabited socio-economic limbo — as Indigenous leader Noel Pearson has termed it, their “welfare pauperisation”. This need is not seen just in the Northern Territory; it exists in some remote and many very remote communities all across Australia.
The perils of remote communities and their profound impact on the health gap must be resolved. Federal, state and territory governments can no longer sustain non-viable communities as they have done for decades. This report has demonstrated that the impact remote living is having on Indigenous communities is profound. Poor life expectancy and childbirth outcomes are a part of daily life in many such communities. Many of these remote communities are thus unsustainable and untenable. In contemporary Australia, this is unacceptable. Nearly a fifth (18.5%) of Indigenous Australians live in remote and very remote communities, compared to just 2% of non-Indigenous Australians. There is a reason why most Australians live in urban areas: cities and major towns bring education, jobs, services and housing — factors that directly link to the successful resolution of the health outcomes that form such an important foundation to the Closing the Gap framework. It is time to address these issues head on, and to bring our most disadvantaged communities into 21st century Australia.
5. Recommendations
Personal Responsibility: A strong focus must be placed immediately on Indigenous Australians taking personal responsibility for managing controllable factors contributing to the health gap (e.g. alcohol and tobacco consumption, school attendance, and pregnancy scheduling).
Economic Participation: Government must provide the framework to transition remote Indigenous communities into the economy by moving them to sustainable social housing in pertinent economic centres; perhaps over one generation, 20 years at the very most.
No Future for Unsustainable Remote Communities: As soon as is humanely possible, and practically feasible, governments must cease support for unsustainable remote communities since in those communities an abundance of socioeconomic factors can only be expected to maintain health — and thence life expectancy — gaps in perpetuity.
6. Appendix
Methodology
This report has been crafted around a pre-posed structure, with that structure’s validity tested as the research proceeded. Data have been sought from work published in peer-reviewed learned journals, indicated by PubMed and broader literature searches and by accessing national and international, primarily government-assured, data bases such as the Australian Bureau of Statistics (ABS).
The work is not unlike an academic thesis, reporting findings from research to support, clarify, or disprove one or more pre-posited hypotheses. The central such hypothesis accepts that the life-altering inputs and outputs that have led — and continue to lead — to profound disadvantage for Australia’s Indigenous people are not imaginary. This paper will seek to show that they have existed and do exist, citing supportive data. But that is only the beginning of the investigation. It must lead on to the formulation of any insights that emerge from recognising the image in the thus assembled jigsaw of facts, discerning the nature of the beast. This is how history should emerge from chronicle, and thence point a way forward.
A Note on Remoteness Data
Remoteness in Australia is officially categorized with the Modified Monash Model (MMM), and the Australian Standard Statistical Geography Standard (ASGS) Remoteness Structure. MMM is based on ASGS categories, but subdivides data further based on ABS region types. The use of one measure or another in reporting varies from agency to agency. For example, health agencies typically utilise MMM, while census data is extrapolated using the ASGS region types. This paper utilises various datasets reported under both models. Table 1 (See below) identifies which MMM and ASGS regions correlate with each other.
Table 1 – Correlation between MMM & ASGS Geographical Classifications
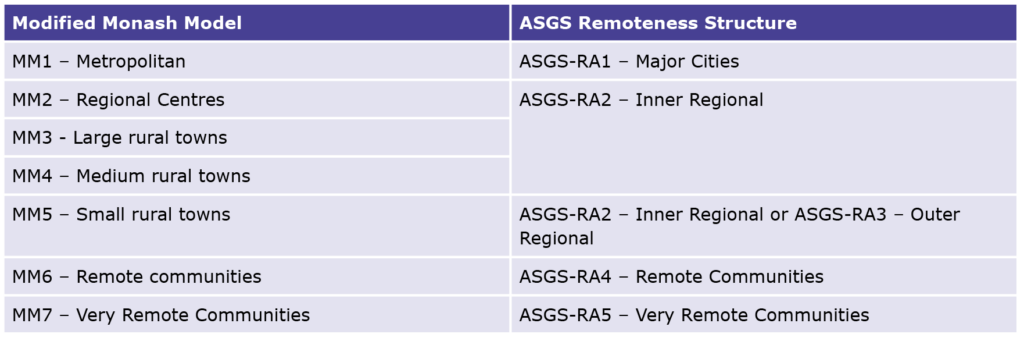
Source: Modified Monash Model. (2019). [online] Available at: https://www.health.gov.au/sites/default/files/documents/2019/12/modified-monash-model—fact-sheet.pdf.
ALSO READ: