
1. Summary and Introduction
Housing is too expensive. This leads to homelessness, rental stress, long commutes, overcrowding, inequality, declining home ownership, slower family formation, misallocation of labour, increased carbon emissions and many other social problems.
The fundamental cause is that planning restrictions limit supply, driving up prices and rents. It is important to be clear about this, and for it to be a focal point in public discussions. As discussed below, it is not well understood by the public, so opponents of housing developments do not realise the harm they do. Moreover, misguided policy proposals dominate public discussion.
These are major obstacles to better policy. Accordingly, this paper describes the evidence of large effects of planning restrictions on housing affordability. This includes significant effects on renters with low incomes. The paper then discusses various objections to this research finding and concludes with a discussion of policy options. The paper draws heavily on submissions the CIS has made to several recent government inquiries.
2. Evidence that planning restrictions make housing expensive
The Susan McKinnon Foundation (2023, p133, q31) asked 3000 Australians “In your opinion, what impact will building more homes in your city/suburb/neighbourhood have on housing prices?” Only 27% of respondents agreed with the economic research that it would reduce prices. A third replied it would actually increase prices with the remainder being neutral or not responding. A US Survey (Nall, Elmendorf and Oklobdzija, 2022) reported similar responses.
This ‘supply scepticism’ is sometimes echoed in influential places.[1] It represents a very large obstacle to zoning reform and housing affordability. Many opponents of new housing do not see that their stance makes housing more expensive. So, it is useful to note the breadth and variety of evidence.
A mountain of academic research finds zoning restricts supply, and this increases prices and rents. More specifically, researchers find:
- less building in jurisdictions with tight planning restrictions;
- more building when restrictions are eased;
- lower prices and rents when restrictions are eased;
- prices exceed marginal costs for both detached houses and apartments;
- restrictions make housing supply inelastic; and
- substantial economic harm from zoning restrictions.
These effects occur at a mix of local, regional and national levels, in both the short and long runs and in many different countries.
The research uses a wide variety of data sets and empirical approaches. Hoskins (2023) has a list of some of the relevant papers, broken down into over 20 categories, that extends for several pages. For surveys and summaries, see Gyourko and Molloy (2015), Hamilton (2021), Been, Ellen, and O’Regan (2018, 2023), Furman (2015), Glaeser and Gyourko (2018), Schuetz (2022), Phillips (2020), Schleicher (2021), Gray (2022), Erdmann (2019), Beyer (2022), Gleeson (2023) and Barr (2023). Each of these has its own emphasis. For example, Hilber and Vermeulen (2015, Section 2) focus on UK research. Tulip (2020) discusses Australian research. Section 3 presents representative examples.
Most of these surveys are by eminent urban economists. The individual papers they cite typically contain shorter literature reviews with the same conclusions. Accordingly, official reports emphasise the role of zoning in making housing expensive. Recent Australian examples include the Commonwealth Productivity Commission’s Report on housing, the Falinski Inquiry, the NSW Productivity Commission’s ‘Rebooting the economy’ and ‘Building more homes where people want to live’, and Infrastructure Victoria’s ‘Our Home Choices’. Government reports from successive administrations in the United States (2016, 2019, 2021), United Kingdom; Canada; New Zealand and other countries agree. The Economist magazine (2021) has complained that “no one needs any more papers showing that stringent zoning regulations raise housing costs. It is time for solutions.”
The research could be described as ‘mixed’ or ‘contested’ if one gave a substantial weight to badly-designed uninformative studies. However, the surveys above place more weight on research that is robust to criticism. The simple misunderstandings one sees in social media (discussed in Section 6) are not taken seriously in the research literature.
While the academic literature should be the basis of public policy, it is not necessary to rely on technical research. Personal observations have often been more influential. People have seen what happens to prices at housing auctions when the number of buyers and sellers change. They have seen what happens to rents when queues for rental inspections stretch around the block.
Simple observation also reveals the large effect of zoning restrictions. High rise development is visibly obvious in urban centres where it is allowed. For example, Box Hill in Melbourne, Chatswood in Sydney, Belconnen in Canberra. Yet within a kilometre, large swathes of land are restricted to low density and one sees only detached houses. In the Greater Sydney region, 77% of residential land is reserved for low density, 12% allows some medium density (typically 3 storeys) and only 2% allows ‘high density’ (with an average floor space ratio of 1.25) (NSW Department of Planning and Environment, 2023 p.19)
Or one can ask people involved in new construction. For example, the Lord Mayor of Sydney explains the level of new housing in her jurisdiction is essentially determined by the state government’s planning controls: “The city’s housing targets are set by the state, and we are on track to achieve them” (Moore 2023). Mosman council says “Council … considers that it is approving an appropriate number of new housing … as previously approved by the Greater Cities Commission.” (Barwell, 2023). Mayors and councillors from North Sydney, the Hills, Woollahra and other municipalities have offered similar defences of their low building rates. Ask a builder, developer or architect why their apartment building wasn’t taller, and the most common answer is that they built as high as they were allowed. People in the industry want to build more, but their routine experience is that the planning system stops them.
Personal observation can be difficult to verify and quantify. So consider some simple examples of large market-wide effects. Auckland’s planning reform of 2013 to 2016 removed many restrictions on medium density development. This was an unusually large-scale reform, conducted in a well delineated area, with less-affected regions forming a good comparison group. The reform was followed by a boom in construction in upzoned areas (about three-quarters of the city) relative to non-upzoned areas.
Chart 1: Dwelling consents in Auckland; 2010-2021
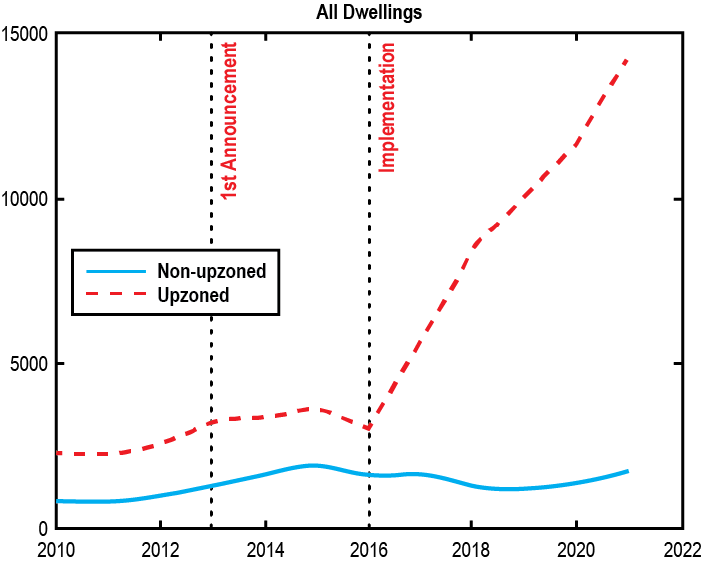
Source: Greenaway-McGrevy and Phillips (2023)
This boom cannot be attributed to favourable macroeconomic or financial factors, given that construction in Auckland boomed relative to history and other New Zealand cities. Chart 2 shows dwelling consents as a ratio to their level in September 2013, when Special Housing Areas began.
Chart 2: Dwelling Consents; New Zealand Regions
Ratio to 2013
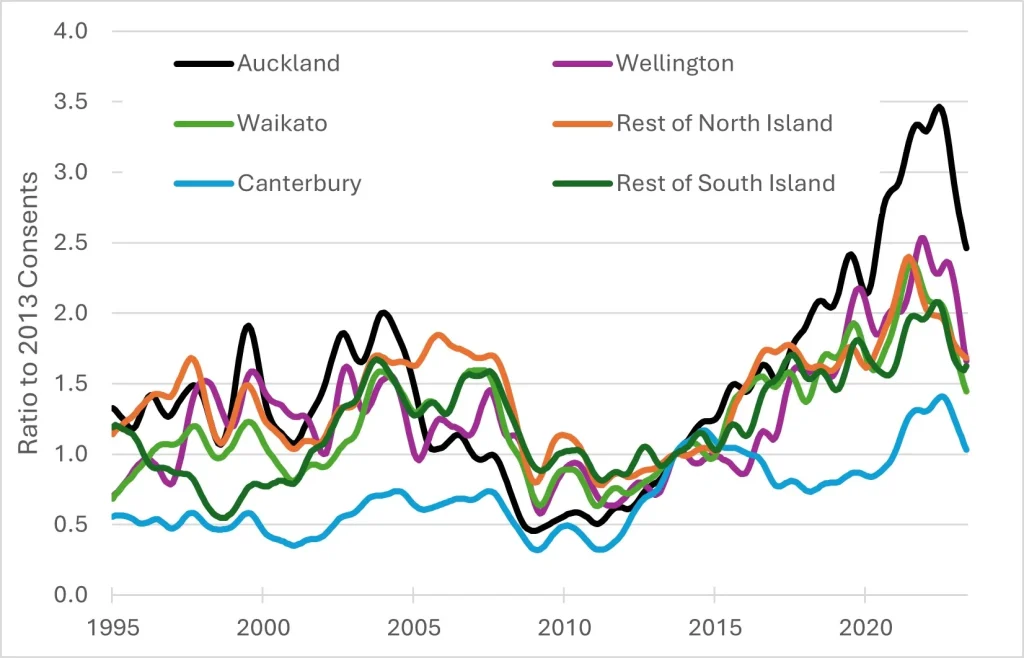
Source: https://infoshare.stats.govt.nz/SelectVariables.aspx?pxID=c6b9b9b6-b0ef-474d-ad46-aa9be4ec24ae
Data are smoothed by Statistics New Zealand.
Note that construction in Canterbury is an outlier due to the 2011 earthquake, which temporarily boosted construction in following years.
In a thorough econometric study, Greenaway-McGrevy and Phillips (2023) estimate that these reforms approximately doubled the rate of construction in Auckland, adding 5% to the dwelling stock (not allowing for demolitions) over 5 years.[2]
The planning reforms reduced rent relative to other New Zealand cities, as shown in Chart 3. Greenaway-McGrevy (2023b) estimates that rents in Auckland fell by 14% to 35% relative to what they otherwise would have been.
Chart 3: Rent in New Zealand Metropolitan Areas; 1993-2022
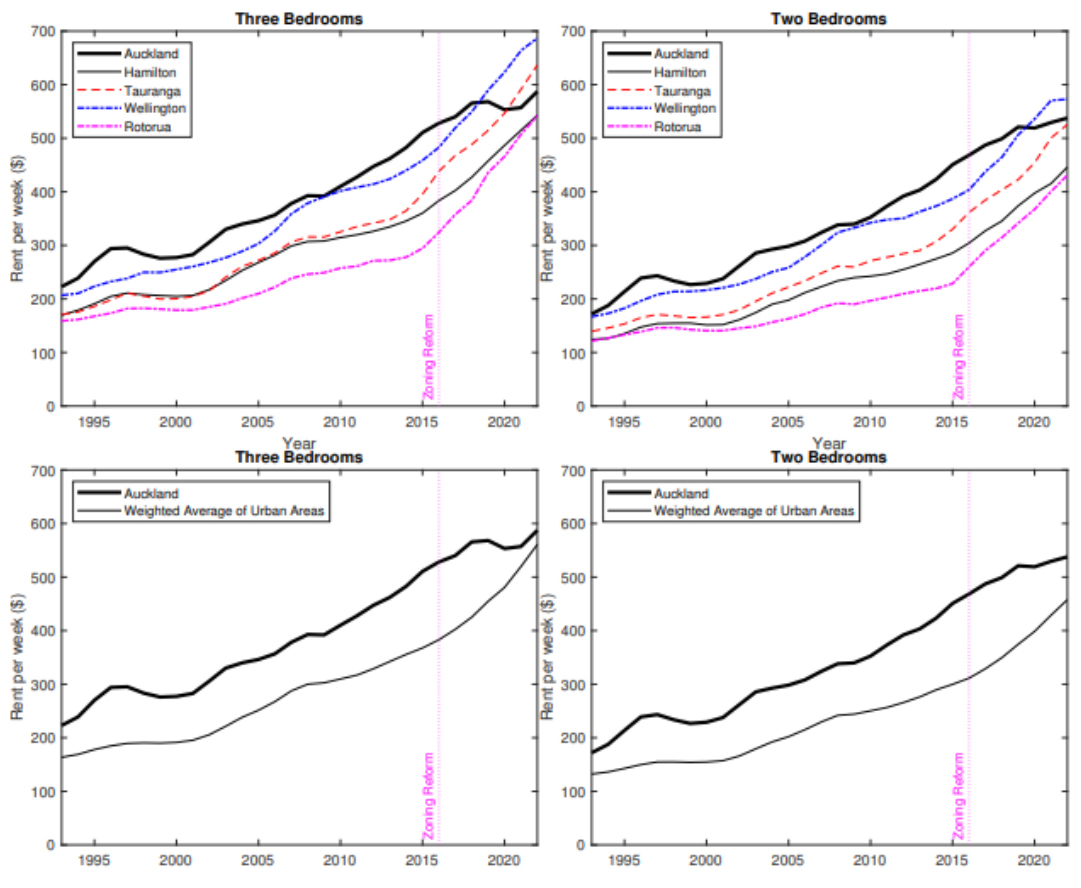
Notes: Geometric mean rents for selected urban areas. Weights based on 2018 census populations.
Source: Greenaway-McGrevy (2023b)
There are many other examples where lifting planning restrictions has been followed by huge increases in construction and reductions in housing costs. Interesting case studies include Minneapolis (Liang, Staveski and Horowitz, 2024; Burn-Murdoch, 2023), Tokyo (Harding, 2016; Gleeson, 2018), Houston (Furth, 2024) and Lower Hutt. What would have happened in the absence of policy change is less clear than Auckland, but the overall pattern is clear.
Closer to home, New South Wales lifted restrictions on ‘granny flats’ in 2009. As shown in Chart 4, this led to a five-fold increase in construction, or about 49,000 extra dwellings by 2020. This large increase in supply required no direct expenditure by the government — it simply involved getting out of the way.
Chart 4: Granny Flats in NSW following 2009 liberalisation
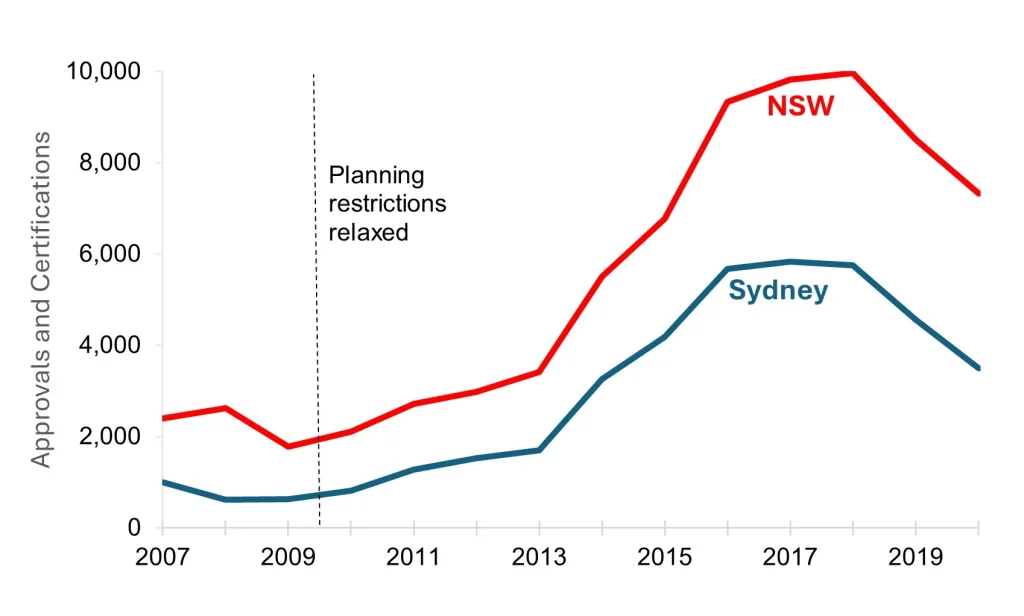
Source: https://pp.planningportal.nsw.gov.au/local-development-performance-monitoring-ldpm
Large effects of planning restrictions can also be easily seen in the huge increases in land values that accompany upzonings. For example, a property zoned for 13 storeys at 661 Chapel St, South Yarra in Melbourne was sold for $20 million in 2014. It was then rezoned for 31 storeys and sold later that year for $56 million (Lucas 2017). Loosening restrictions added $36 million in value. For similar examples see Millar, Vedelago and Schneiders (2015), Kendall and Tulip (2018, Appendix A) or the stream of corruption allegations that plague local politics. These examples are representative, as can be seen in Valuer-General valuations or the site values of apartment buildings, discussed in Section 3.
Large land revaluations are analogous to the high market value of quantity restrictions in other industries such as taxi licences, pharmacy licenses or import quotas. They show that legal permission to build is scarce and valuable. Developers only pay these large sums if the new permission is expected to be profitably used and if building is not possible without it. That is, the absence of permission is a binding constraint on construction.
3. Measuring the excess demand for housing
One common approach to estimating the ‘housing shortage’ is to project forward assumptions of household formation (labelled ‘demand’) and of construction (labelled ‘supply’) and to describe the gap between the series as a ‘shortage’.
While this approach helps communicate simple ideas to the public, it does not provide an adequate basis for policy. Among other problems, it requires an assumption about average household size; for example, a recent value is often used. However, current household size is constrained and too large: because we have not built enough, prices rise to the point where people overcrowd into the available dwellings. The approach is especially misleading at a regional level, as areas that have most restricted housing will tend to show the most over-pricing and hence rising household sizes. The demographic approach assumes these areas have the least need, whereas an economic approach would show the opposite.
A more rigorous approach is to calculate the excess demand for housing as the gap between prices and the marginal cost of supply. This is the leading approach in the academic literature.
For example, the NSW Productivity Commission (2023) estimates that the average new Melbourne apartment sold for $672,000 in 2022 but cost only $544,000 to supply; implying a gap of $128,000, or 19% of the price. Why are opportunities like this not traded away? Why don’t more of these highly profitable trades occur? The reason is that the planning system prohibits it. Restrictions on height, use, floor-area ratios, setbacks, heritage and many other aspects prevent builders supplying the housing that the market demands. So the wedge between price and cost persists. That wedge is a gauge of the severity of planning restrictions. In the same way that the wedge between domestic price and the world price measures the effect of import quotas.
Table 1 presents further estimates, using this approach.
Table 1: The Wedge Between Sale Prices and the Cost of Supply
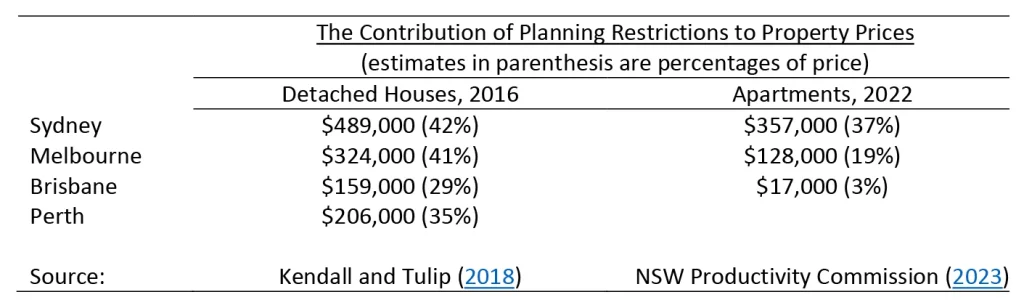
Details of how the estimates are constructed are discussed in Kendall and Tulip (2018) and Jenner and Tulip (2020). In Tulip (2020), I discuss the estimates and note that similar effects have been estimated by many researchers overseas, using a wide variety of data sets and testing sensitivity to many other factors, so the estimates are qualitatively robust.
‘Site values’ or ‘residual land values’ provide qualitative corroboration of the estimates for apartments. Knight Frank, one of Australia’s leading property consultancies, compiles estimates for major cities on a regular basis. Like the estimates in Table 1, these reflect the per-apartment difference between sales prices and costs.
There are differences in coverage, definitions, weighting and timing between the measures. In particular, Knight Frank’s estimates are before a Development Application (DA) is granted, so reflect large risk premiums and lower land values. Knight Frank estimate that land zoned for higher density in 2020 typically sold for about $180,000 per apartment in Sydney, $130,000 in Melbourne, about $80,000 to $100,000 in Hobart, Canberra and Gold Coast and about $40,000 to $50,000 in other capital cities.
Planning restrictions increase housing costs in two ways. First, they increase administrative costs and delays. For example, the Fresh Hope church group spent “more than $1 million” to gain approval for 50 apartments for low income tenants in Marrickville, NSW. (Perinotto, 2023). The Centre for International Economics (2013) and Deloitte Access Economics (2016, Section 3.1.1) estimate that easily quantified ‘red tape’ like this might increase supply costs by about $2,000 to $6,000 per dwelling.
Second, planning restrictions simply reduce the supply of housing. The estimates in Table 1, many of which are in hundreds of thousands of dollars, suggest that this is by far the bigger effect. This has important policy implications. Speeding up and streamlining planning decisions is desirable but it is not the priority; the important challenge is to turn ‘no’ into ‘yes’.
4. Housing for renters on lower incomes
While evidence that planning restrictions affect the average affordability of housing is overwhelming, affordability for renters on low incomes is of special interest.
Newly-constructed housing is often more expensive than old housing, giving rise to worries that ‘luxury’ construction will primarily benefit the wealthy. However, this concern is misplaced, because it does not consider the more important indirect ‘filtering’ or ‘cascade’ effects of increased supply on existing properties.
When wealthy residents occupy new housing, they vacate other housing, which falls in price. Those vacancies are filled by those on moderate incomes, who vacate other housing. That increases supply and lowers prices for those on lower incomes. And so on. Researchers in Australia, Sweden, the United States (twice), Germany and (most persuasively) Finland have all documented these ‘moving chains’, finding them to be fast and strong. As the Commonwealth Productivity Commission (2022, Section 12.5) concluded, based on its survey of the research, “More supply — in any segment of the market — can improve affordability for low-income households.”
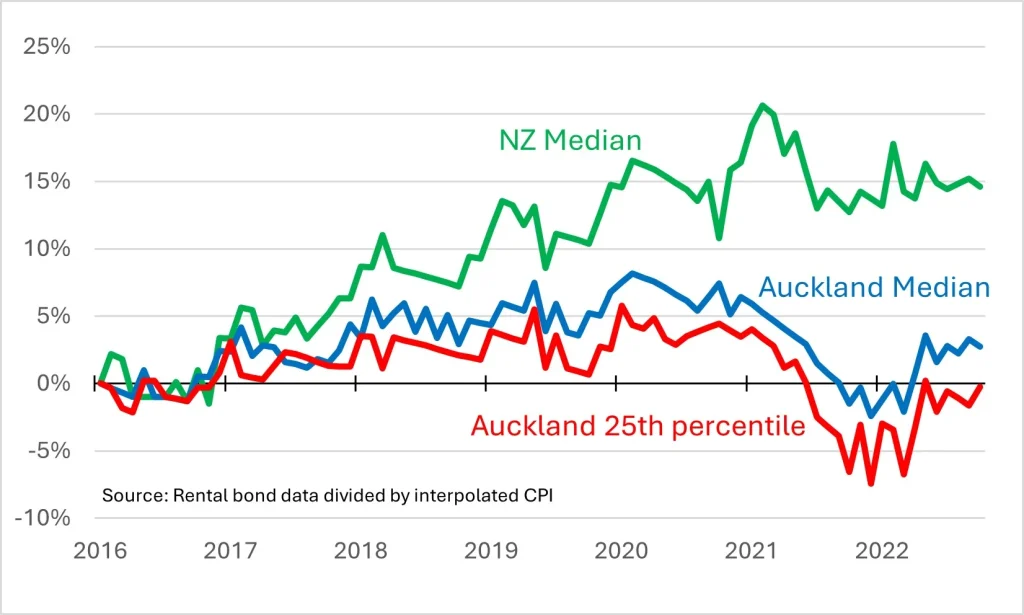
A shortage of housing is like a game of musical chairs. Regardless of who is playing or the quality of the chairs, if there are not enough then the weakest will miss out. If supply is abundant, those at the bottom benefit most. For example, after Auckland loosened zoning restrictions, as discussed in the previous section, the reduction in rent was especially pronounced in the bottom quartile.
Chart 5: Real Rent in Auckland
% Change since 2016Q4
Similarly, there is a strong relationship between rents (determined by overall supply) and homelessness (Chart 6). Indeed, average rents are the most important determinant of rates of homelessness — more so, for example than poverty rates, unemployment or drug abuse — as documented in the aptly named Homelessness Is A Housing Problem by Colburn and Aldern, 2022.
Chart 6: Homelessness and Rent; US cities
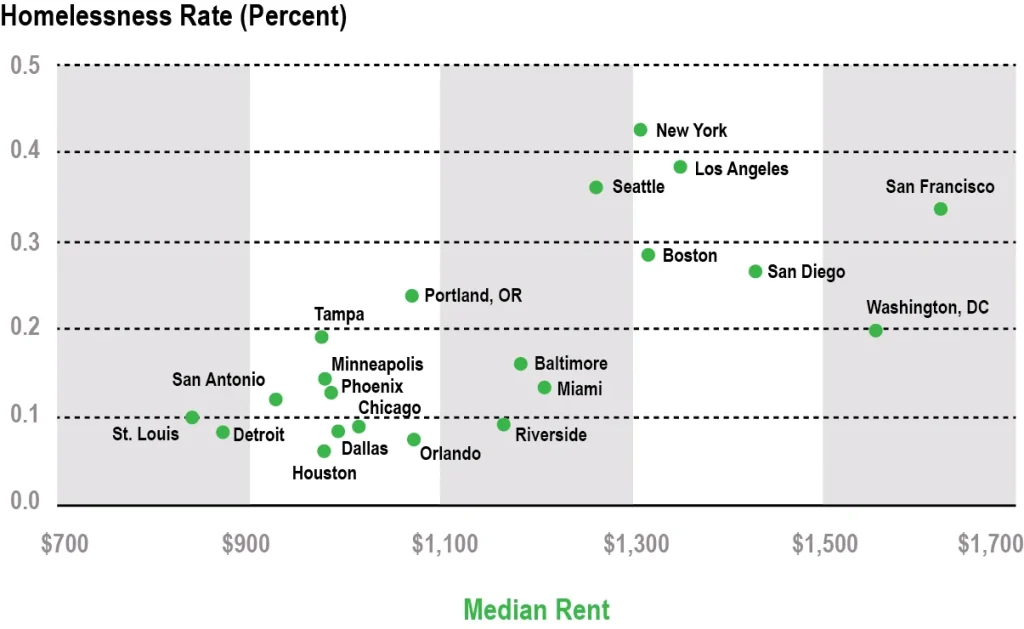
Source: Harvard Joint Center for Housing Studies (2017; Figure 35)
And average rent in a city is strongly correlated with measures of rental stress among low-income earners.
Chart 7: Rental Stress Increases with Average Rent
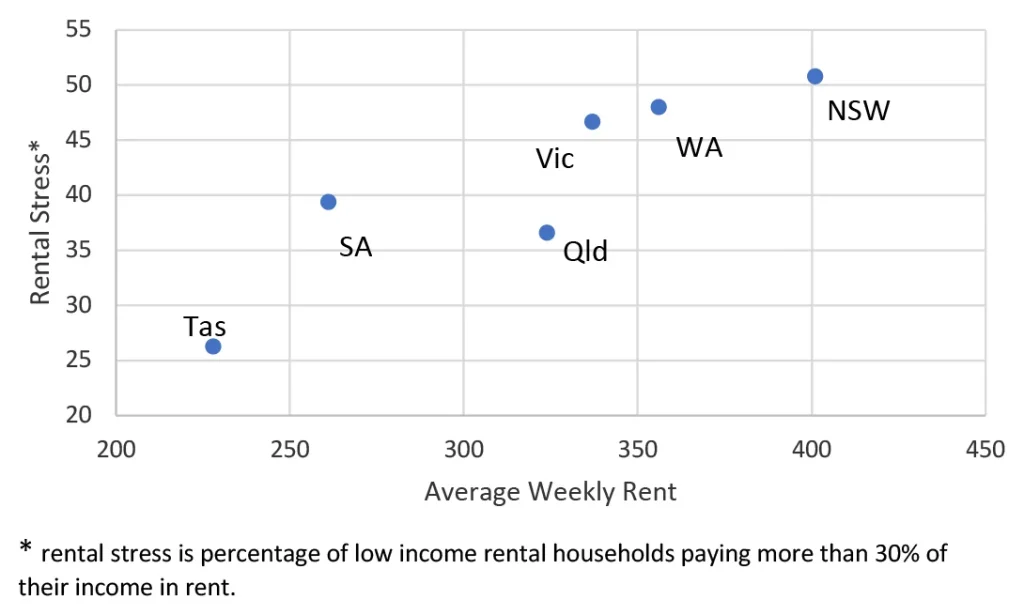
Source: ABS 41300, Housing Occupancy and Costs, 2015–16, Tables 13.1 and 22.1
Nygaard and coauthors (2022) find that filtering ‘on its own’ does not lower rents for those on lower incomes. However, contrary to what is suggested by Pawson and coauthors (2022), this is perfectly consistent with the other research on filtering. Filtering lowers rents for those on lower incomes when it is combined with increased supply. In contrast, properties ‘filter up’ (become more expensive) when supply is inadequate. In practice, the latter has often dominated. That does not contradict the finding that boosting supply would make housing more affordable for those who need it the most.
5. Amenity
The strongest argument for zoning restrictions is that they preserve local amenity. Some people find tall buildings ugly, they dislike congestion on local roads, and they consider that increased density impairs the character of their neighbourhood. These are value judgements on which reasonable people can agree to disagree.
However, it is doubtful how widely or strongly held these views are. Lanigan and Tulip (2021) discuss eight examples of high-density developments in Sydney and Melbourne. Contrary to fears these would damage neighbourhood amenity, nearby house prices did not change relative to adjoining suburbs. As judged by willingness to pay, the relative attractiveness of living in the neighbourhood did not change. While some neighbours may dislike new buildings, that has been offset by other homebuyers who like a lively walkable neighbourhood and the new shops, restaurants and transport that accompany higher density. Taylor Swift (2023) describes her preference for high density.
Similarly, econometric studies of special character overlays (elsewhere called heritage protection) in Auckland find that they increase housing values by about 4% (Greenaway-McGrevy and Jones, 2023; Fernandez and Martin, 2020; Bade, Castillo, Fernandez and Aguilar-Bohorquez, 2020). In economic terms, this quantifies the value of the externality in a way that can be directly compared with a Pigouvian ‘zoning tax’, which Lees (2018) estimates to be 54% in Auckland.
If one considered that opposition to new development was widespread, society would face a trade-off. Elected representatives would need to weigh the desire of wealthy neighbours for easy parking and aversion to shadows against potential residents’ need for shelter.
Current institutional arrangements make this trade-off by giving those wealthy neighbours a say, via their local councils, while the views of potential residents from outside the area are ignored. State and federal politicians representing wider electorates would place more weight on the latter group and make different trade-offs. Broader social welfare is advanced by taking the decision to restrict housing away from local representatives.
6. Misunderstandings
Whereas concerns about neighbourhood amenity reflect differing values, most other objections reflect simple misunderstandings. These other objections are not taken seriously in the research literature. For example, they are barely mentioned in the summaries of the research cited in Section 2. Nevertheless, these views are held by important participants in housing discussions, including the National Housing Supply and Affordability Council (NHSAC) and the Australian Housing and Urban Research Institute (AHURI).
The role of supply and demand
As noted in Section 3, many members of the public and some commentators doubt that extra supply would reduce housing costs, despite substantial evidence that it does. Part of the confusion may reflect observations where both supply and demand increase, though that is not relevant to a policy that increases supply for a given level of demand.
Another part of the confusion may occur because a small, isolated increase in supply — for example by one builder or in one suburb — will not materially affect prices. That is because it is small relative to the overall market and it competes with nearby housing, to which its prices are tied. In the same way a farmer doubling his crop will not affect his price or his neighbour’s price.
However, if all builders or suburbs increase supply — so the change is substantial relative to the level of demand — the cost of housing moves strongly and clearly. As shown in Chart 8, when the vacancy rate (a measure of the gap between supply and demand) is low, rents rise quickly. That is why rents are rising now. Conversely, when there is excess supply, rents fall. The same close relationship between the tightness of the housing market and rental growth is evident in Canada and the United States (national, by state).
Chart 8: Vacancy Rate and Change in Real CPI Rents; Australia
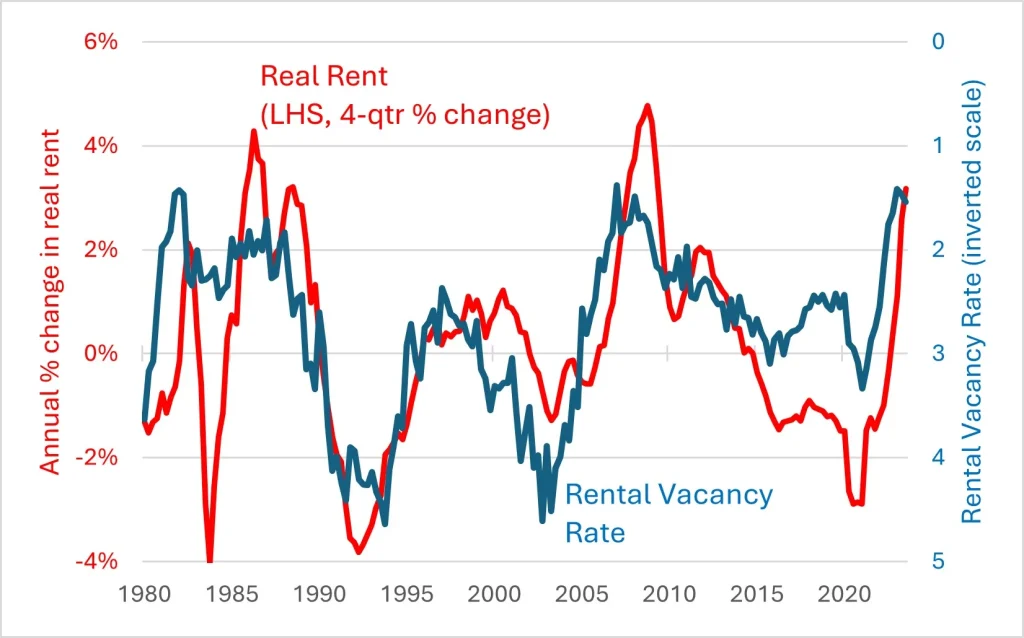
Notes: the red line is the 4-quarter % change in CPI rent less the average % change in trimmed mean CPI over the previous 3 years.
The blue line is REIA’s 8-city vacancy rate.
For an econometric version, see Saunders and Tulip (2019) Equation 18.
The effect of excess supply on the cost of housing is verified and quantified in econometric work. Studies at a local or city level (Phillips, Manville and Lens, 2021; Hanushek and Quigley, 1980; Albouy, Ehrlich and Liu, 2016) find extra supply has a small but clear effect, reducing the cost of similar housing nearby. In some cases, this is partially offset by positive externalities of new housing in gentrifying neighbourhoods. Studies at a national level find that an extra 1% increase in the housing stock reduces the cost of housing by about 2-3% (Girouad, Kennedy, van den Noord and André, 2006; Oxford Economics, 2016). A recent study for Australia, by Saunders and Tulip (2019) estimates that a 1% increase in the housing stock reduces rents and prices by 2.5%. We use this estimate below. A more recent study by Abelson and Joyeux (2023 p25) estimates this effect would be 2.3%.
Pawson and coauthors (2022) dispute these well-established empirical regularities on theoretical grounds. They do not point to any flaws in the empirical studies but claim that it would be irrational for builders to increase supply, reducing prices. This argument might make sense if developers were a monopoly or cartel, when restricting supply to boost prices is possible. However, construction is competitive, with 24,641 builders and developers in 2018/19, according to the ABS Counts of Australian Businesses. No individual firm has a material effect on price. Competitive firms rationally undercut their competitors all the time. For example, when supply restrictions (patents) on pharmaceuticals are removed, competitors enter and prices fall towards marginal production cost. (Vondeling and co-authors, 2018). To be clear, when there are long lags in production, then competitive firms have an incentive to time the market – selling when prices are unusually high. But that smooths prices, it does not increase them.
Pawson and coauthors (2022) also say that were supply to increase due to a relaxation of planning, then other supply would contract. Zero evidence is cited in support, nor is any plausible mechanism suggested. As noted in Section 2, Auckland doubled its construction industry after its planning restrictions were relaxed. Perhaps Pawson and coauthors think capacity constraints are important. However, given that dwelling completions per capita were over 30% higher a few years ago and over 60% higher five decades ago (Chart 9), it is difficult to see this as anything more than a temporary obstacle.
Chart 9: Annual Dwelling Completions per 1,000 People
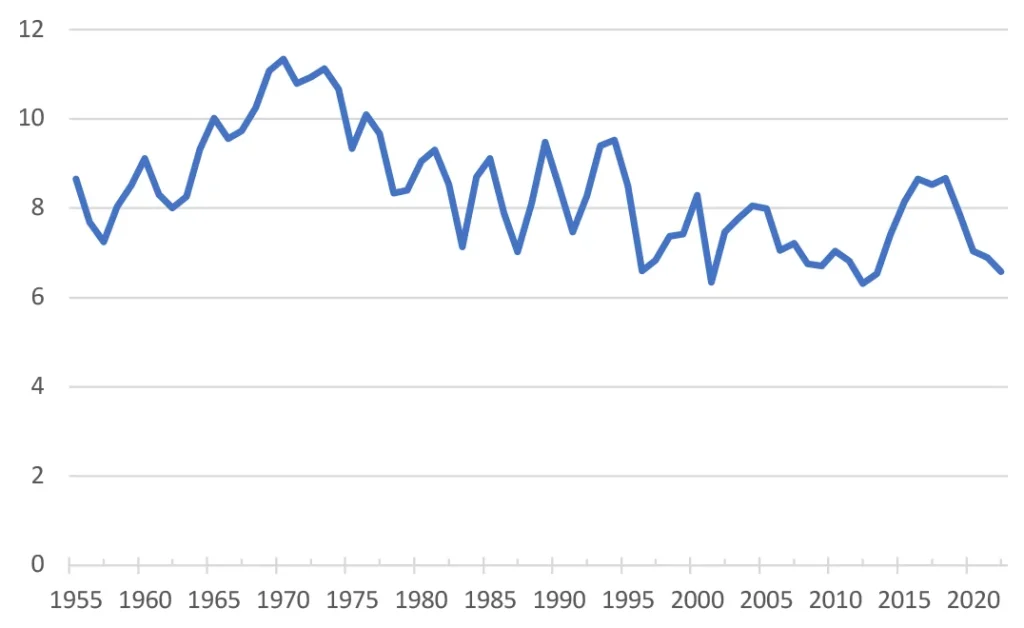
Sources: https://www.abs.gov.au/statistics/people/population/historical-population/2016
Or perhaps Pawson and coauthors assume (along with Farrelly, 2023, for example), that housing supply is highly price-elastic. However, that assumption is clearly rejected by econometric studies such as Saunders and Tulip, (2019, Section 4.1) or the RBA’s MARTIN model (Ballantyne et al, section 4.3.1) which find a modest and short-lived response to prices.
In economic terms, many residents are relatively indifferent between housing in nearby neighbourhoods, so demand at a local level is highly price-elastic. In contrast, moving to a different city typically requires all members of a household to change jobs, schools and social networks, so demand at a city or higher level is price-inelastic. This means local increases in supply have a small effect on prices whereas city-wide increases have large effects — which has important policy implications. It means one local council, by itself, can do little to overcome the housing affordability crisis. Were it to increase supply, residents would move from nearby. Co-ordinated city-wide increases in supply, organised by the state governments, are needed.
Other misunderstandings
Several other misunderstandings can be addressed more briefly. Indented quotations are representative of arguments frequently made on social media.
“Zoning is not an important determinant of housing prices because other factors, such as interest rates, immigration, taxes or location premiums, are more important.”
These other factors are not alternative explanations but complements. It is the interaction between demand-side factors and planning restrictions that inflates prices. In economic terms, zoning makes housing supply inelastic; that is, the supply curve is steep. In contrast, these other factors boost demand, shifting the demand curve to the right. A well-functioning housing market would respond to the higher demand by building more dwellings — as seen in most markets. Instead, because planning limits supply, we get higher rents and prices.
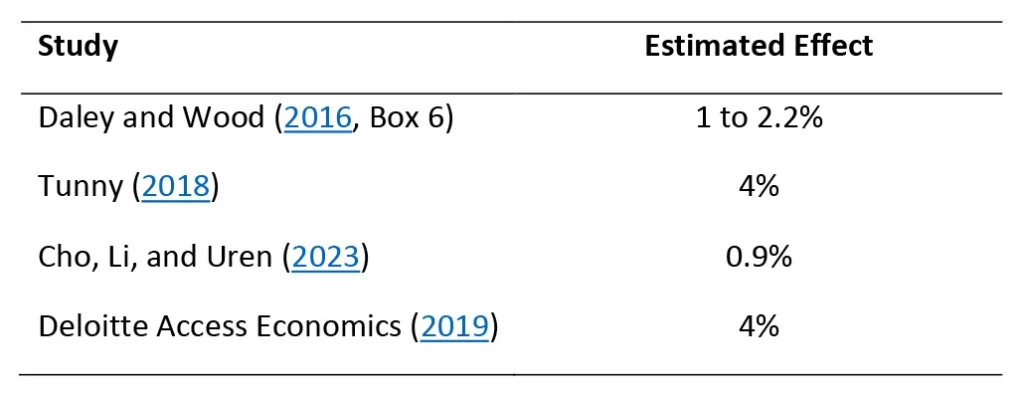
A popular variation on this argument (e.g. Kohler, 2023) emphasises tax concessions like negative gearing and the discount for capital gains. As above, these would provide a complementary explanation for rising prices, not an alternative. Moreover, the effect of these concessions on housing prices is tiny. Several researchers have estimated this effect using different approaches. As shown in Table 2, they find an effect of between 1% and 4%. This is trivial relative to the effect of zoning shown in Table 1.
Table 2: Estimates of the effect of tax concessions on housing prices
“Planning restrictions cannot explain recent high prices because those restrictions have been eased.”
Again, this ignores the interaction. It is true that restrictions barely change, despite demand increasing with increases in population, incomes or lower interest rates; in fact, that is the problem. With higher demand, the constraint becomes more binding.
“Concentrating on increasing supply is one-sided. A more comprehensive approach to housing affordability would also reduce demand.”
Increasing supply (that is, providing housing to those who need it) makes us better off, whereas reducing demand (denying housing to those who need it) reduces living standards. Richardson (2023) advocates reducing student immigration, a lucrative source of export earnings. This would reduce housing costs but it would also reduce per capita national income. As Richardson notes, it would be better to solve the housing shortage directly.
“Recent construction levels have been high.”
Recent construction levels have not been high enough to clear the long-term accumulated backlog, nor to meet growing demand. Those who point to the flow of new housing are simply ignoring the research (discussed in Sections 2 and 3) finding that the stock of housing is inadequate. The relevant shortage is the level.
“Some developers are allowed to build but they choose to withhold supply.”
The importance of this is contested but the more important response is “So what? Why is that an argument for stopping the many builders and developers who do want to build?”
In Tulip (2021), I discuss further objections to estimates of a large zoning effect.
7. Policy Recommendations
We need to relax zoning restrictions to allow more housing.
This requires a change in social values, otherwise no policy change will be sustained. As a society we need to be more accepting of higher density and less opposed to new development. We need to put more weight on the interests of renters and future home buyers and less weight on the interests of nearby residents. Public education is necessary for this. Opponents of new housing need to understand the harm they do.
The government has enormous resources that could encourage more informed public debate. The rhetoric from the Prime Minister, National Cabinet and other federal representatives in this regard has been clear and evidence-based.
Unfortunately, some of the government’s other vehicles for public education, specifically the Australian Housing and Urban Research Institute (AHURI) and the National Housing Supply and Affordability Council (NHSAC), detract from public discussion rather than contribute. Rather than disseminating evidence on housing policy, these bodies amplify views of fringe “supply-deniers” that are contradicted by most research.
The federal government has allocated $3.5 billion in incentive payments for more housing (Albanese, 2023). This encourages more building, helps alleviate infrastructure bottlenecks and amplifies the message that more housing is needed. Reform of the Grants Commission, to direct more funds to those states that build more housing, would reinforce this. This could be achieved by revising the Grants Commission formulae to treat housing construction as a disability, in the same manner as transport spending. This would be fair, given that more housing requires more capital outlays on public infrastructure (above that paid for by infrastructure charges on developers). The CIS Submission to the Falinski Inquiry (2021, Section 6.2) discusses further.
Housing and public infrastructure go together. We should not have one without the other. So federal infrastructure funding should require extra housing. An explicit quid pro quo allays objections of overcrowding and clarifies the benefits of greater density. Support for rail projects, like Melbourne’s Suburban Rail Loop, Sydney’s metro and Canberra’s light rail should require high density at stations. Support for Sydney’s Beaches Link tunnel should accompany extra housing in the Northern Beaches. Support for Mamre Rd should accompany extra housing near the Aerotropolis. Support for Richmond Rd should accompany housing in Marsden Park. And so on.
While the federal government should encourage and fund more housing, the important decision-makers are state governments. They need to allow more housing. Specifically, they need to announce credible plans detailing how the National Cabinet target of 1.2 million homes over the next five years will be achieved.
New South Wales, the state with the worst affordability problems, has recently announced several policies that over-ride local council restrictions (Minns, 2023). These include allowing 3-6 storey apartments in medium density (R3) zones near train stations; allowing townhouses and low-rise apartments in low-density (R2) zones near train stations, and allowing dual occupancies in all low-density (R2) zones. 40 precincts (most importantly, the old Rosehill racecourse) have been designated for high-density transit-oriented-development. These are the kinds of measures that are needed. However, they fall short of the 377,000 homes that would comprise NSW’s share of the national target.
In most of Australia, direct responsibility for zoning rests with local councils. To ensure councils make progress towards the state and national targets, they also need targets and these targets need to be enforced.
Targets set the quantity of housing centrally while the type and precise location are decentralised. Each council can choose whether to meet its target by a small number of high-density developments or a larger number of medium density developments. Either choice improves housing affordability, which is what the central government cares about, while preserving some local control, which has public support.
There are several over-lapping reasons why state governments should over-ride local councils.
First, councils are biased against development. Councils represent nearby residents, not the direct beneficiaries — the newcomers moving into the area – nor the indirect beneficiaries, the renters and future home buyers who pay lower housing costs. Councils will act like a cartel, restricting supply and driving up the price of housing. That benefits local property owners, but this is more than outweighed by the harm done to potential residents from outside the area and future generations.
Second, local decisions are inconsistent. Some voters support extra housing, but not near them. Hence the acronym NIMBY. Local control would mean nothing is built, against the wishes of these voters.
Third, housing affordability can be seen as a public good, subject to a free-rider problem. There is little that one council, acting alone can achieve. But if all councils allow more building, housing costs will fall substantially. So, it is rational for individual councils to contribute if, and only if, other councils are also required to contribute.
Fourth is considerations of fairness and the onus of proof. If high targets are set for all councils, especially if they are based on clear principles and data, objection to new development becomes a claim for special treatment.
In Tulip (2023) I discuss how targets for local councils can be calculated and enforced.
8. Public and Social Housing
Some commentators prefer public and social housing to more market-supplied housing. That is partly based on the view that market housing will not help those on lower incomes. As discussed in Section 4, that view is inconsistent with the evidence.
It is not necessary to discuss public housing policy here in detail as it has been sensibly and authoritatively examined by the Henry Review, the McClure Review and the Productivity Commission.
In summary, there are compassionate grounds for providing temporary shelter to victims of domestic violence, refugees and others with emergency needs. Furthermore, there are paternalistic reasons for providing longer term housing assistance for those suffering from mental illness or substance abuse. However, most public and social housing tenants would be better off if they were given the subsidy in cash and allowed to choose housing that best suited their changing individual circumstances.
This is not a hypothetical point. In the 2022-23 Budget, the federal government increased Commonwealth Rental Assistance (CRA) by 15%, making 1.1 million households better off. In contrast to public housing subsidies, CRA is directed to the neediest families, without a waiting list, and provides poor renters with the goods and services that they most value.
Complaints about the trend reduction in government subsidies often fail to recognise that these subsidies are being replaced, more cost-effectively, by CRA. This replacement is recommended and explained by the expert reviews noted above.
If public and social housing takes the form of new construction, it increases housing supply and improves affordability. However, it comes at a large unnecessary fiscal cost. For example, the federal government’s Housing Australia Future Fund costs $10 billion to provide 30,000 new dwellings. That represents a 0.2% increase in the national dwelling stock. Using the estimates discussed in Section 6, it would reduce the average cost of housing by about 0.5%. Compared to the estimates in Table 1, that is tiny, if not trivial. It might also be compared with the liberalisation of granny flats in NSW shown in Chart 4, which led to 49,000 extra dwellings at zero cost to the taxpayer.
The National Greens have called for a million extra homes over the next 20 years, in addition to what would ordinarily be provided. In contrast to the government’s proposals, this would make a meaningful improvement in affordability. Assuming a 1% increase in the housing stock reduces the cost of housing by 2.5%, as above, the Greens’ proposal would reduce prices and rents by about 25%. The problem is the fiscal cost. The average Australian dwelling costs $925,000, so the capital outlay for a million dwellings over 20 years would be about $46 billion a year, or 2% of GDP. Assuming each dwelling receives an average subsidy of about $15,000 a year (Coates, 2021), a million homes would cost $15 billion (0.6% of GDP) a year. The associated increase in taxes is likely to be unacceptable to the Australian electorate. Especially as an increase in the housing stock like this could be achieved at zero direct cost to the taxpayer, by just allowing the market to provide more housing.
9. Conclusion
Planning restrictions mean housing prices and rents are too high. The solution is for state and local governments to stop saying ‘no’ and start saying ‘yes’. Setting and enforcing high targets for local councils would help achieve this. Making federal grants and expenditure on infrastructure conditional on extra housing would also help.
More fundamentally, we need a change in social values. As a society, we need to be more accepting of higher density. We need to put more weight on the interests of renters and future home buyers and less weight on the interests of nearby residents.
Endnotes
[1] Rachel Ong Viforj, the academic economist on the National Housing Supply and Affordability Council, is one of 3 out of 26 expert economists who disagree with the proposition that increased supply would make housing more affordable (Coates, 2018). Peter Mares (2023), author of the book No Place Like Home: Repairing Australia’s Housing Crisis, writes: “Nor is there great evidence of planning and zoning being a significant brake on development”. Geraldine Brooks, the Pulitzer-prize winning writer, says “There’s not a scintilla of evidence that more nice flats in close-in suburbs, many with views, will push prices down.”
[2] Those estimates have been challenged by Murray and Helm (2023) but their concerns have been addressed in subsequent work by Greenaway-McGrevy (2023a), leading to stronger conclusions (see also Maltman, 2023; Phillips (2023)).