Home » Submission to Victorian Legislative Council Select Committee Inquiry
· CIS

Victoria Planning Provisions Amendments VC257, VC267 and VC274: Submission to Victorian Legislative Council Select Committee Inquiry
Housing in Victoria, as in the rest of Australia, is too expensive. This leads to homelessness, rental stress, long commutes, overcrowding, inequality, declining home ownership, slower family formation, misallocation of labour, increased carbon emissions and many other social problems.
The fundamental cause is that planning restrictions limit supply, driving up prices and rents. It is important to be clear about this, as it is central to this inquiry’s terms of reference.
A key objective of the Planning and Environment Act 1987, and of housing policy more broadly, is to ‘facilitate the provision of affordable housing in Victoria’. The amendments that are the subject of this inquiry do exactly that. By loosening planning restrictions, they boost housing supply and hence make housing more affordable. Accordingly, these provisions need to be supported.
Other submissions to this inquiry discuss the details of the amendments and how they are being implemented. This submission focuses on their fundamental motivation: the large effect of planning restrictions on housing affordability.
This submission draws heavily on Tulip (2024)[1], which discusses academic issues and other policies in greater depth.
Some witnesses to this inquiry have denied that planning restrictions make housing expensive. For example, the Submission of Charter 29 (p8), claims that ‘planning rules, including zoning, have not limited land supply or housing approvals.’ And ‘broadscale rezoning of land as the means of increasing supply will not achieve the aim of providing affordable housing’ (supplementary submission 15.1, p14)
This supply-denialism is a serious misunderstanding. It would undermine the rationale for the amendments, so needs to be refuted. Contrary to what Charter 29 implies, the evidence that planning restrictions make housing expensive is broad, robust and varied.
Let’s start with the obvious. We see high rise development in urban centres where it is allowed. For example, Box Hill in Melbourne, Chatswood in Sydney, Belconnen in Canberra. Yet within a kilometre, large swathes of land are restricted to low density and we see only detached houses. So planning matters.
Everyday observation shows that variations in supply and demand, like these, drive housing prices. At housing auctions, prices change when the number of sellers or buyers changes. When queues for rental inspections lengthen, rents rise. The property pages of our newspapers routinely run stories saying, ‘Prices and rents in neighbourhood X rise as demand outpaces supply.’ All of which is unsurprising; it is how most markets work.
Chart 1 shows these observations apply at a large scale. The vacancy rate is a measure of the gap between supply and demand. When vacancies are low, rents rise quickly. Rents are rising now because there aren’t enough homes available. Conversely, when there is excess supply, rents fall. The same close relationship between the tightness of the housing market and rental growth is evident in Canada and the United States.
Chart 1: Vacancy Rate and Change in Real CPI Rents; Australia
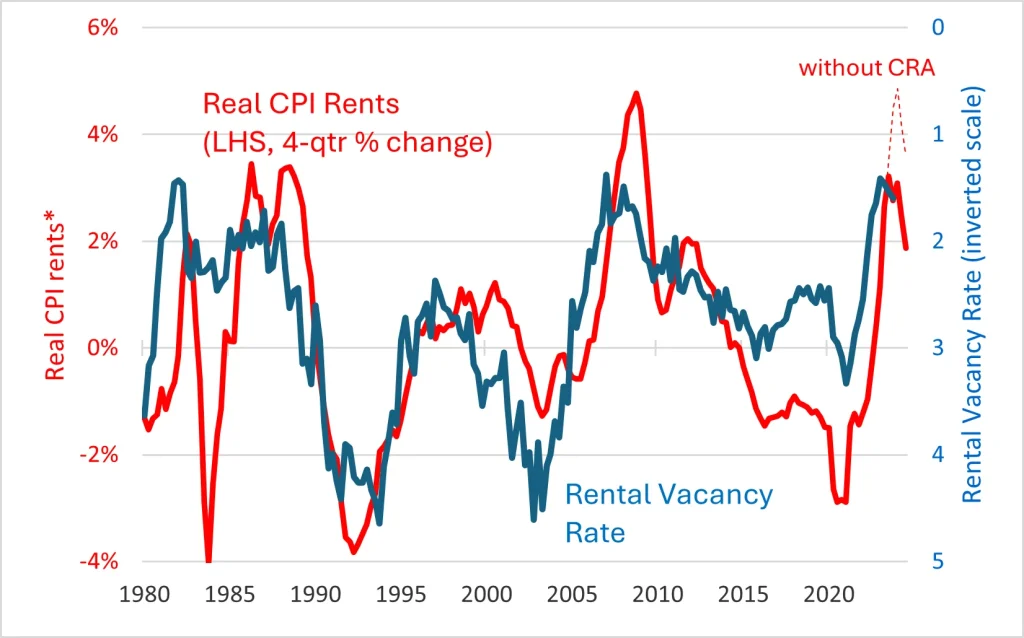
Notes: the red line is the 4-quarter % change in CPI rent less the average % change in trimmed mean CPI over the previous 3 years. The dashed line removes the effect of recent increases in Commonwealth Rental Assistance, as estimated by the ABS.
The blue line is REIA’s 8-city vacancy rate.
For an econometric version, see Saunders and Tulip (2019) Equation 18.
These relationships apply to changes in land use regulations.
The clearest example of planning reform boosting supply and reducing the cost of housing may be Auckland. In 2013 and 2016 Auckland lifted restrictions on medium density development. As shown in Chart 2, this was followed by a boom in construction in upzoned areas (about three-quarters of the city) relative to non-upzoned areas.
Chart 2: Dwelling consents in Auckland; 2010-2021
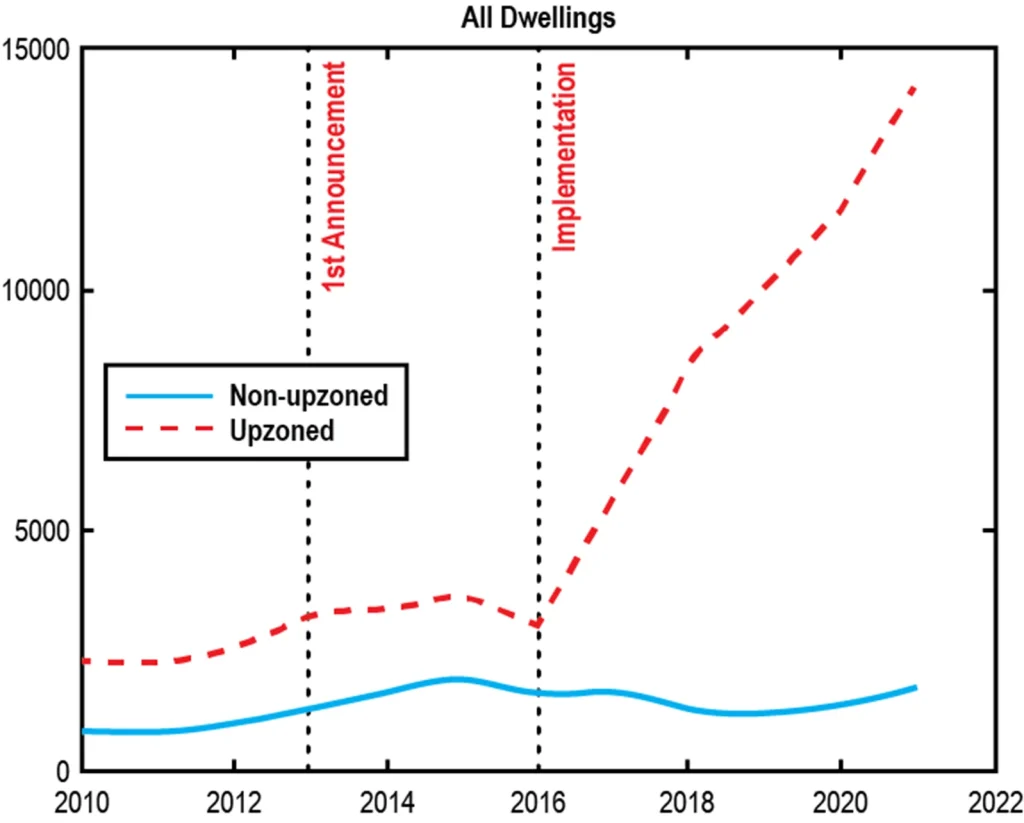
Source: Greenaway-McGrevy and Phillips (2023)
In a thorough econometric study, Greenaway-McGrevy and Phillips (2023) estimate that these reforms approximately doubled the rate of construction in Auckland, adding 5% to the dwelling stock (not allowing for demolitions) over five years. Those results have been challenged in a blog post by Murray and Helms (2024), however, Donovan and Maltman (2025) examine these criticisms in detail and find them to be without merit.
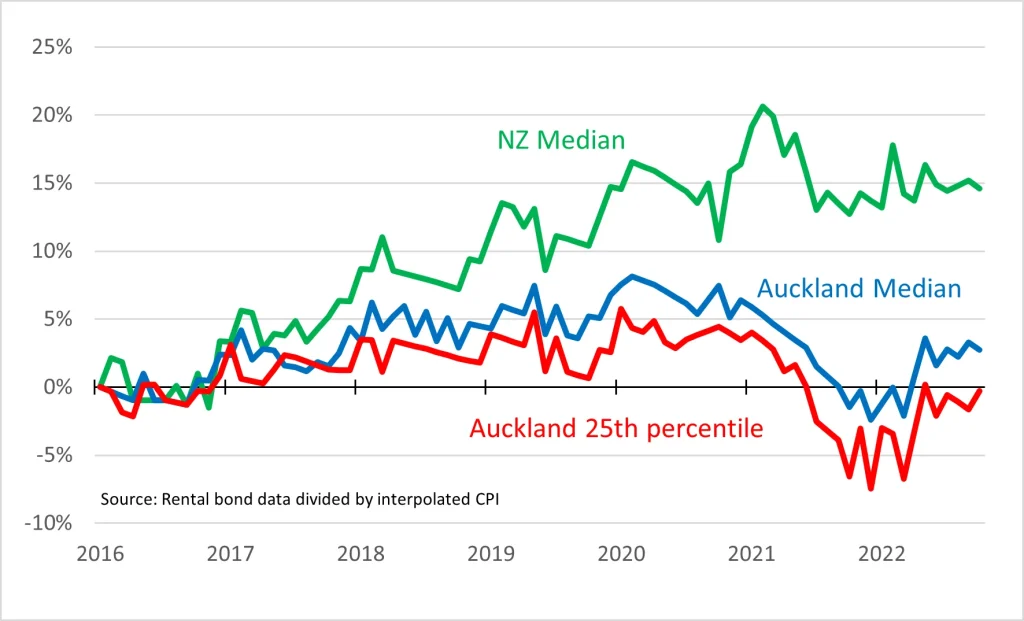
As shown in Chart 3, the planning reforms reduced rent relative to other New Zealand cities. Note that lower income renters especially benefit. Greenaway-McGrevy and So (2024) estimate that rents in Auckland fell by 28% relative to comparable New Zealand cities.
Chart 3: Real Rent in Auckland
There are many other examples where lifting planning restrictions has been followed by large increases in construction and reductions in housing costs. Interesting case studies include Lower Hutt (Maltman and Greenaway-McGrevy, 2025), Zurich (Büchler and Lutz, 2024), Minneapolis (Liang, Staveski and Horowitz, 2024; Burn-Murdoch, 2023), Tokyo (Harding, 2016; Gleeson, 2018), Edmonton (OhTheUrbanity, 2024), Houston (Furth, 2024), and Sao Paolo (Anagol, Ferreira and Rexer, 2023). Counter-factuals are often less clear than Auckland, but the pattern is the same.
Large effects of planning restrictions can also be easily seen in the huge increases in land values that accompany upzonings. For example, a property zoned for 13 storeys at 661 Chapel St, South Yarra, in Melbourne was sold for $20 million in 2014. It was then rezoned for 31 storeys and sold later that year for $56 million (Lucas 2017). Loosening restrictions added $36 million in value. For similar examples see Millar, Vedelago and Schneiders (2015), Kendall and Tulip (2018, Appendix A) or the stream of corruption allegations that plague local politics. These examples are representative, as can be seen in Valuer-General valuations or the site values of apartment buildings, discussed below.
Large land revaluations are analogous to the high market value of quantity restrictions in other industries such as taxi licences, pharmaceutical patents or import quotas. They show that legal permission to build is scarce and valuable. Developers only pay these large sums if the new permission is expected to be profitably used and if building is not possible without it. That is, the absence of permission is a binding constraint on construction.
A mountain of academic research finds zoning restricts supply, and this increases prices and rents. More specifically, researchers find:
· less building in jurisdictions with tight planning restrictions;
· more building when restrictions are eased;
· lower prices and rents when restrictions are eased;
· prices exceed marginal costs for both detached houses and apartments;
· restrictions make housing supply inelastic; and
· substantial economic harm from zoning restrictions.
These effects occur at a mix of local, regional and national levels, in both the short and long runs and in many different countries, measuring restrictions in different ways.
It is useful to quote some surveys of the research.
· “There is a strong consensus in the empirical literature that stricter land use regulation impedes development.”
“The conclusion that relaxing restrictions on land development and new constructions could lead to large aggregate gains is pervasive in the literature”
— Baum-Snow and Duranton, (2025, pp 97, 93)
· “Most studies have found substantial effects on the housing market. In particular, regulation appears to raise house prices, reduce construction, reduce the elasticity of housing supply, and alter urban form … The available research suggests [the zoning] tax is quite large for many markets.”
— Gyourko and Molloy, (2015, pp 1289, 1296)
· “There is a strong consensus among economists that … land use regulations are standing in the way of new housing construction and are causing high and rising prices”
— Hamilton, (2021 p195)
· “Dozens of empirical studies have shown that more restrictive land use regulations are associated with higher housing prices”
— Been, Ellen, and O’Regan (2018, p227)
· “Recent evidence provides additional reasons to counter the supply skepticism that has fueled resistance against efforts to reform land use regulations to allow more housing …”
— Been, Ellen, and O’Regan (2023, p24)
Similar conclusions are found in surveys by Furman (2015), Schuetz (2022), Schleicher (2021), Manville, Lens and Monkkonen (2020), Gray (2022), Erdmann (2019), Beyer (2022), Gleeson (2023), Barr (2023) and Caplan (2024). Each of these has their own emphasis. For example, Phillips, Manville and Lens (2021) focus on local rents. Hilber and Vermeulen (2015, Section 2) focus on UK research. Tulip (2020) discusses Australian research. Section 3 presents representative examples.
As noted above, some witnesses to this inquiry have disputed these results and the analysis on which it is based. Their objections reflect simple misunderstandings that are not taken seriously by researchers. The surveys above are exhaustive; for example, Baum-Snow and Duranton’s is 118 pages. They examine many objections and questions in detail. However, they do not consider the simple misunderstandings of social media sceptics and planning academics worth discussing. While there are unsettled questions about details and nuances, the central results are robust.
Qualitatively similar results have been obtained from cities in over a dozen countries. It is natural to expect these results would also apply in Australia. Especially as Australian research (described in the next section) has used the same approaches as foreign research and found very similar results. If anything, housing affordability is even worse here.
The leading approach for quantifying the overall effect of planning restrictions is to estimate the gap between prices and the marginal cost of supply. For example, the NSW Productivity Commission (2023) estimates that the average new Melbourne apartment sold for $672,000 in 2022 but cost only $544,000 to supply; implying a gap of $128,000, or 19% of the price. Why are opportunities like this not traded away? Why don’t more of these highly profitable trades occur? The reason is that the planning system prohibits it. Restrictions on height, use, floor-area ratios, setbacks, heritage and many other aspects prevent builders supplying the housing that the market demands. So, the wedge between price and cost persists. That wedge is a gauge of the severity of planning restrictions. In the same way that the wedge between domestic price and the world price measures the effect of import quotas.
Table 1 presents further estimates, using this approach.
Table 1: The Wedge Between Sale Prices and the Cost of Supply
| The Contribution of Planning Restrictions to Property Prices (estimates in parenthesis are percentages of price) |
||
| Detached Houses, 2016 | Apartments, 2022 | |
| Sydney | $489,000 (42%) | $357,000 (37%) |
| Melbourne | $324,000 (41%) | $128,000 (19%) |
| Brisbane | $159,000 (29%) | $17,000 (3%) |
| Perth | $206,000 (35%) | |
| Source: | Kendall and Tulip (2018) | NSW Productivity Commission (2023) |
Tulip (2020) discusses the estimates and notes that similar effects have been estimated by many researchers overseas, using a wide variety of data sets and testing sensitivity to many other factors, so the estimates are qualitatively robust. For example, Gyourko and Krimmel (2021) find slightly larger effects for vacant sites for detached houses, showing that worries about structure cost or lot divisibility are unimportant.
To be clear, a change in zoning restrictions typically does not precede the gap between price and cost. Often, a widening of the gap follows an increase in demand. However, zoning restrictions prevent supply responding and hence sustain the gap. That contrasts with well-functioning markets, where supply adjusts, keeping price near cost.
‘Site values’ or ‘residual land values’ provide qualitative corroboration of the estimates for apartments. Knight Frank, one of Australia’s leading property consultancies, compiles estimates for major cities on a regular basis. Like the estimates in Table 1, these reflect the per-apartment difference between sales prices and costs.
There are differences in coverage, definitions, weighting and timing between the measures. In particular, Knight Frank’s estimates are before a Development Application (DA) is granted, so reflect large risk premiums and lower land values. Knight Frank estimates that land zoned for higher density in 2020 typically sold for about $180,000 per apartment in Sydney, $130,000 in Melbourne, about $80,000 to $100,000 in Hobart, Canberra and Gold Coast and about $40,000 to $50,000 in other capital cities.
While evidence that planning restrictions affect the average affordability of housing is overwhelming, affordability for renters on low incomes is of special interest.
Newly-constructed housing is often more expensive than old housing, giving rise to worries that ‘luxury’ construction will primarily benefit the wealthy. However, this concern is misplaced, because it does not consider the more important indirect ‘filtering’ or ‘cascade’ effects of increased supply on existing properties.
When wealthy residents occupy new housing, they vacate second-tier housing, which falls in price. Those vacancies are filled by those on moderate incomes, who vacate third-tier housing. That increases supply and lowers prices for those on lower incomes. And so on. Researchers in Australia (twice), the United States (twice), Sweden, Germany and (most persuasively) Finland have all documented these ‘moving chains’, finding them to be fast and strong. As the Commonwealth Productivity Commission (2022, Section 12.5) concluded, based on its survey of the research, ‘More supply — in any segment of the market — can improve affordability for low-income households.’
A shortage of housing is like a game of musical chairs. Regardless of who is playing or the quality of the chairs, if there are not enough then the weakest will miss out. If supply is abundant, those at the bottom benefit most. As shown in the previous section, after Auckland loosened zoning restrictions, the reduction in rent was especially pronounced in the bottom quartile.
Abundant housing is of most benefit to those at the bottom of the housing ladder. As shown in Chart 4, there is a strong relationship between rents (determined by overall supply) and homelessness. Indeed, average rents are the most important determinant of rates of homelessness — more so, for example than poverty rates, unemployment or drug abuse — as documented in the aptly named Homelessness Is A Housing Problem by Colburn and Aldern, 2022.
Chart 4: Homelessness and Rent; US cities
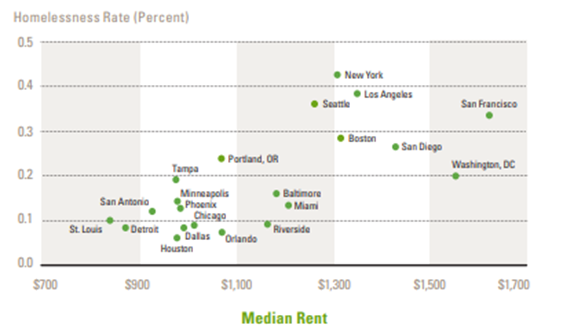
Source: Harvard Joint Center for Housing Studies (2017; Figure 35)
And average rent in a city is strongly correlated with measures of rental stress among low-income earners.
Chart 5: Rental Stress Increases with Average Rent
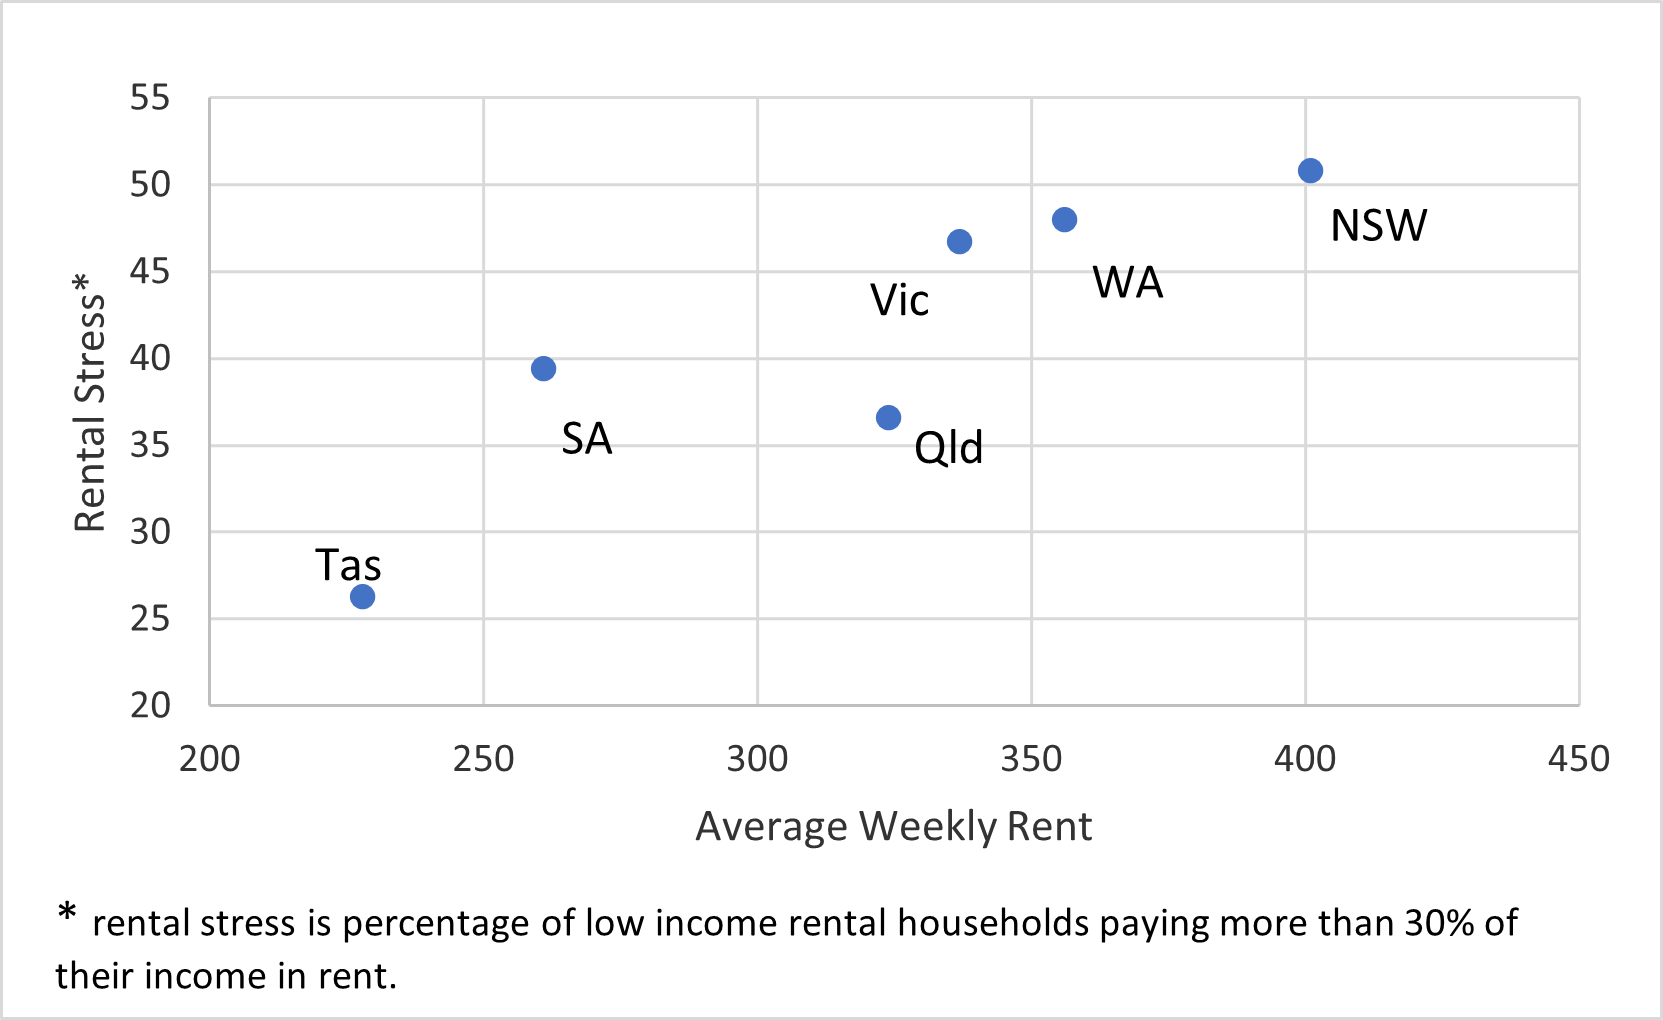
Source: ABS 41300, Housing Occupancy and Costs, 2015–16, Tables 13.1 and 22.1
In short, if you want to help the homeless or lower-income renters, then increasing housing supply, driving down average rents, is effective. In contrast to other policies with this objective, increasing supply does not cost the taxpayer. The government just needs to get out of the way.
The strongest argument for zoning restrictions is that they preserve local amenity. Some people find tall buildings ugly, they dislike congestion on local roads, and they consider that increased density impairs the character of their neighbourhood. These are value judgements on which reasonable people can agree to disagree.
However, it is doubtful how widely or strongly held these views are. Lanigan and Tulip (2021) discuss eight examples of high-density developments in Sydney and Melbourne. Contrary to fears these would damage neighbourhood amenity, nearby house prices did not change relative to adjoining suburbs. As judged by willingness to pay, the relative attractiveness of living in the neighbourhood did not change. While some neighbours may dislike new buildings, that has been offset by other homebuyers who like a lively walkable neighbourhood and the new shops, restaurants and transport that accompany higher density. Taylor Swift (2023) describes her preference for high density.
Similarly, econometric studies of special character overlays (elsewhere called heritage protection) in Auckland find that they increase housing values by about 4% (Greenaway-McGrevy and Jones, 2023; Fernandez and Martin, 2020; Bade, Castillo, Fernandez and Aguilar-Bohorquez, 2020). In economic terms, this quantifies the value of the externality in a way that can be directly compared with a Pigouvian ‘zoning tax’, which Lees (2018) estimates to be 54% in Auckland.
If one considered that opposition to new development was widespread, society would face a trade-off. Elected representatives would need to weigh the desire of wealthy neighbours for easy parking and aversion to shadows against potential residents’ need for shelter.
Conventional institutional arrangements have decided this trade-off by giving those wealthy neighbours a say, via their local councils, while the views of potential residents from outside the area were ignored.
The Victorian government represents a wider electorate, taking the interests of potential residents into account. It improves broader social welfare by taking the decision to restrict housing away from local representatives. If housing is to be made affordable, the state government needs to override local councils.
Specifically, the amendments being considered by this inquiry allow extra housing to be supplied. The research discussed in previous sections indicates this this is an effective way to make housing more affordable, especially for low-income renters. Moreover, they do so without requiring government expenditure.
Transport stations are an ideal place to locate new housing. The demand to live near public transport is high. They are already busy, lively areas so neighbourhood disruption is minimised. And encouraging public transport reduces traffic congestion.
It is sometimes suggested that the new planning controls should require ‘affordable’ (i.e., subsidised) housing, often called Mandatory Inclusionary Zoning (MIZ).
These suggestions are well-meaning but counterproductive. Mandatory Inclusionary Zoning is a tax on development. Like any tax, it discourages supply and raises prices.
Builders should not pay for something society, as a whole, wants. It is like making doctors and nurses pay for Medicare or making professors pay for extra university places. To get more of something, don’t tax the people who provide it.
MIZ leads to lower bids for sites. For profitable developments. this will be passed on to lower land prices. But for the many development sites that are marginal, a lower bid will be unsuccessful and the development will not happen. This reduces supply, making housing more expensive.
Hamilton (2021) surveys the research and concludes ‘Inclusionary Zoning Hurts More Than It Helps‘. She analyses six studies, four of which find that inclusionary zoning increases prices. Three find that inclusionary zoning reduces the quantity of new housing, two find no effect, and one doesn’t examine supply effects.
Subsequent research has strengthened these conclusions. in 2019, Seattle’s ‘mandatory housing affordability‘ (MHA) required builders to include subsidised components in medium density projects. Medium density construction collapsed (Chart 6).
Chart 6: Building permits in Seattle
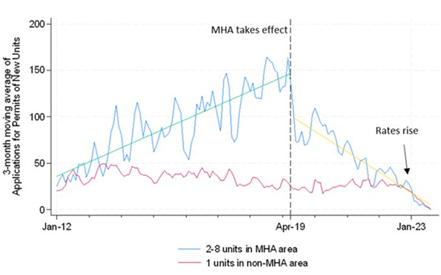
The same thing happened in Portland, Oregon.
Phillips (2024) estimates that every below-market unit produced by Inclusionary Zoning in Los Angeles reduces market-rate production by more than four units, worsening affordability for everyone except the lucky lottery winners.
In contrast, evidence supporting MIZ is very thin. Proponents cite many examples where MIZ has increased subsidised housing, but they do not cite research showing that MIZ has maintained supply or overall affordability.
Planning restrictions mean housing prices and rents are too high. The Victorian government’s planning reforms will help fix this.
More fundamentally, we need a change in social values. As a society, we need to be more accepting of higher density. We need to put more weight on the interests of renters and future home buyers and less weight on the interests of nearby residents. Hopefully this inquiry’s report will promote this change.
[1] References are provided by hyperlinks in the pdf version.
Submission to Victorian Legislative Council Select Committee Inquiry